1476 Supply, Demand, and Government Policies
137. Refer to Figure 6-13. If the government imposes a price floor of $7 on this market, then there
will be
a. no surplus.
b. a surplus of 10 units.
c. a surplus of 15 units.
d. a surplus of 20 units.
Figure 6-14
Supply, Demand, and Government Policies 1477
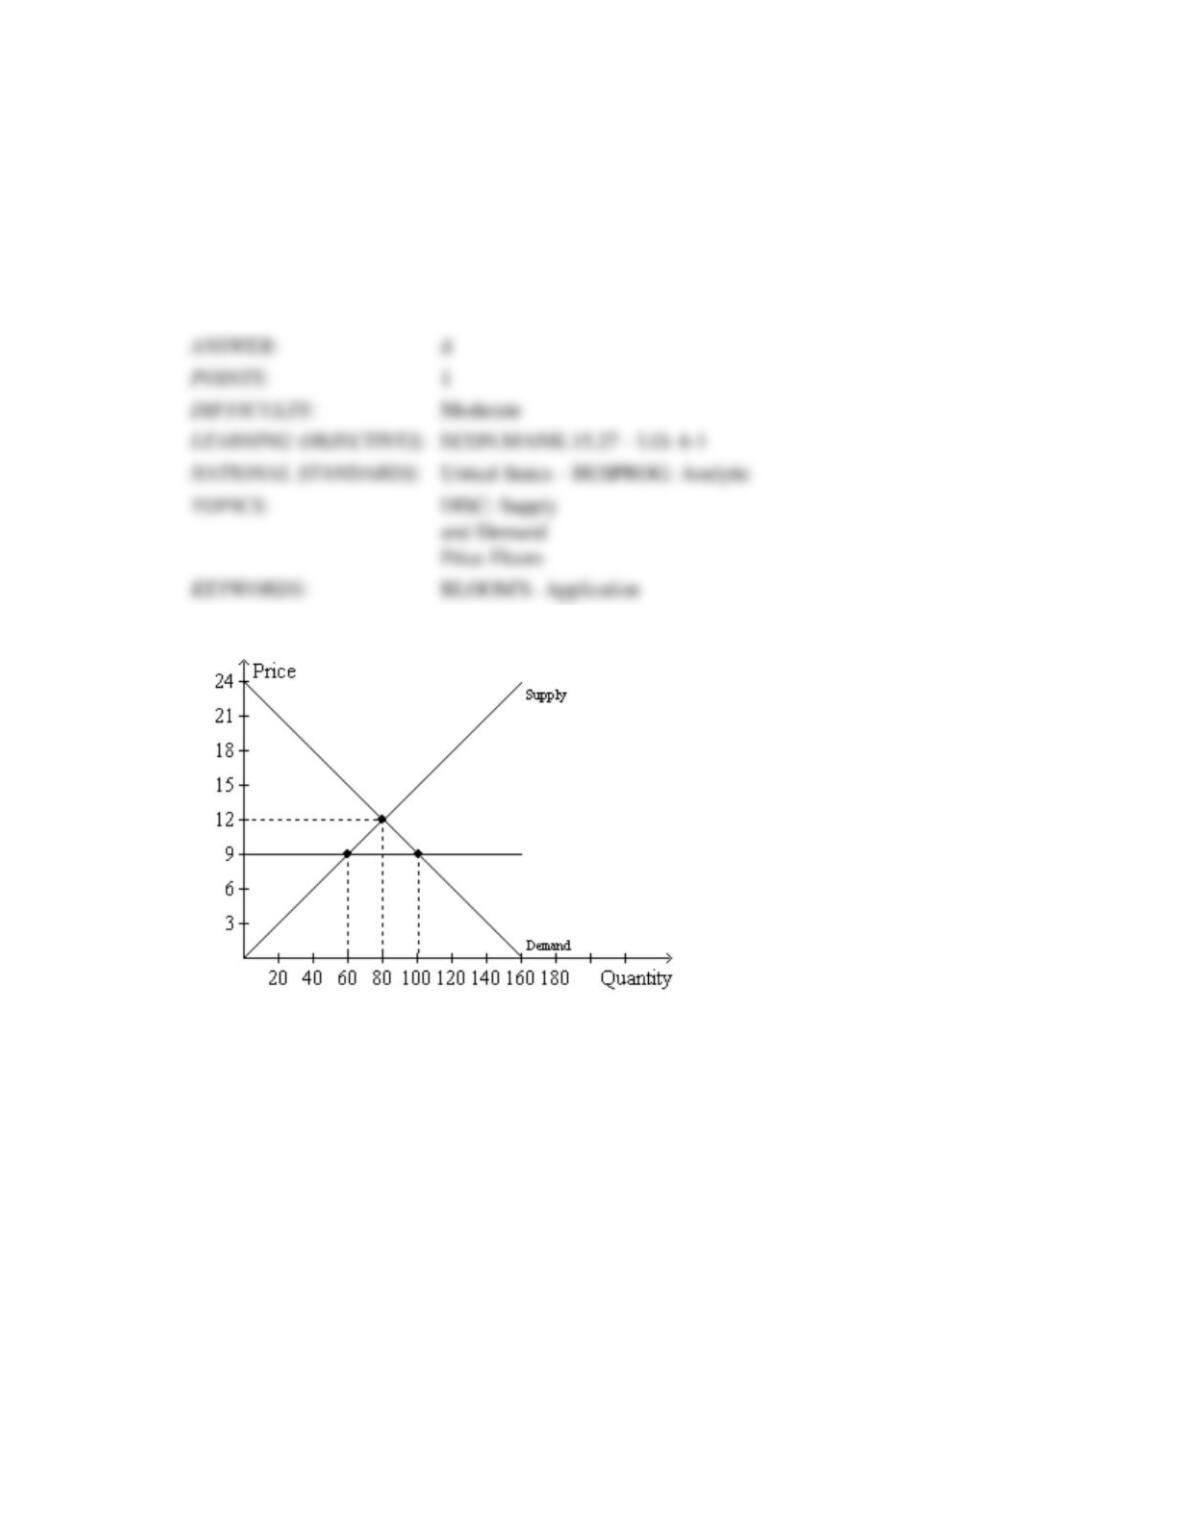
138. Refer to Figure 6-14. If the horizontal line on the graph represents a price ceiling, then the
price ceiling is
a. binding and creates a shortage of 20 units of the good.
b. binding and creates a shortage of 40 units of the good.
c. not binding but creates a shortage of 40 units of the good.
d. not binding, and there will be no surplus or shortage of the good.
139. Refer to Figure 6-14. If the horizontal line on the graph represents a price floor, then the price
floor is
a. binding and creates a shortage of 20 units of the good.
b. binding and creates a shortage of 40 units of the good.
c. not binding but creates a shortage of 40 units of the good.
d. not binding, and there will be no surplus or shortage of the good.
1478 Supply, Demand, and Government Policies
Figure 6-15
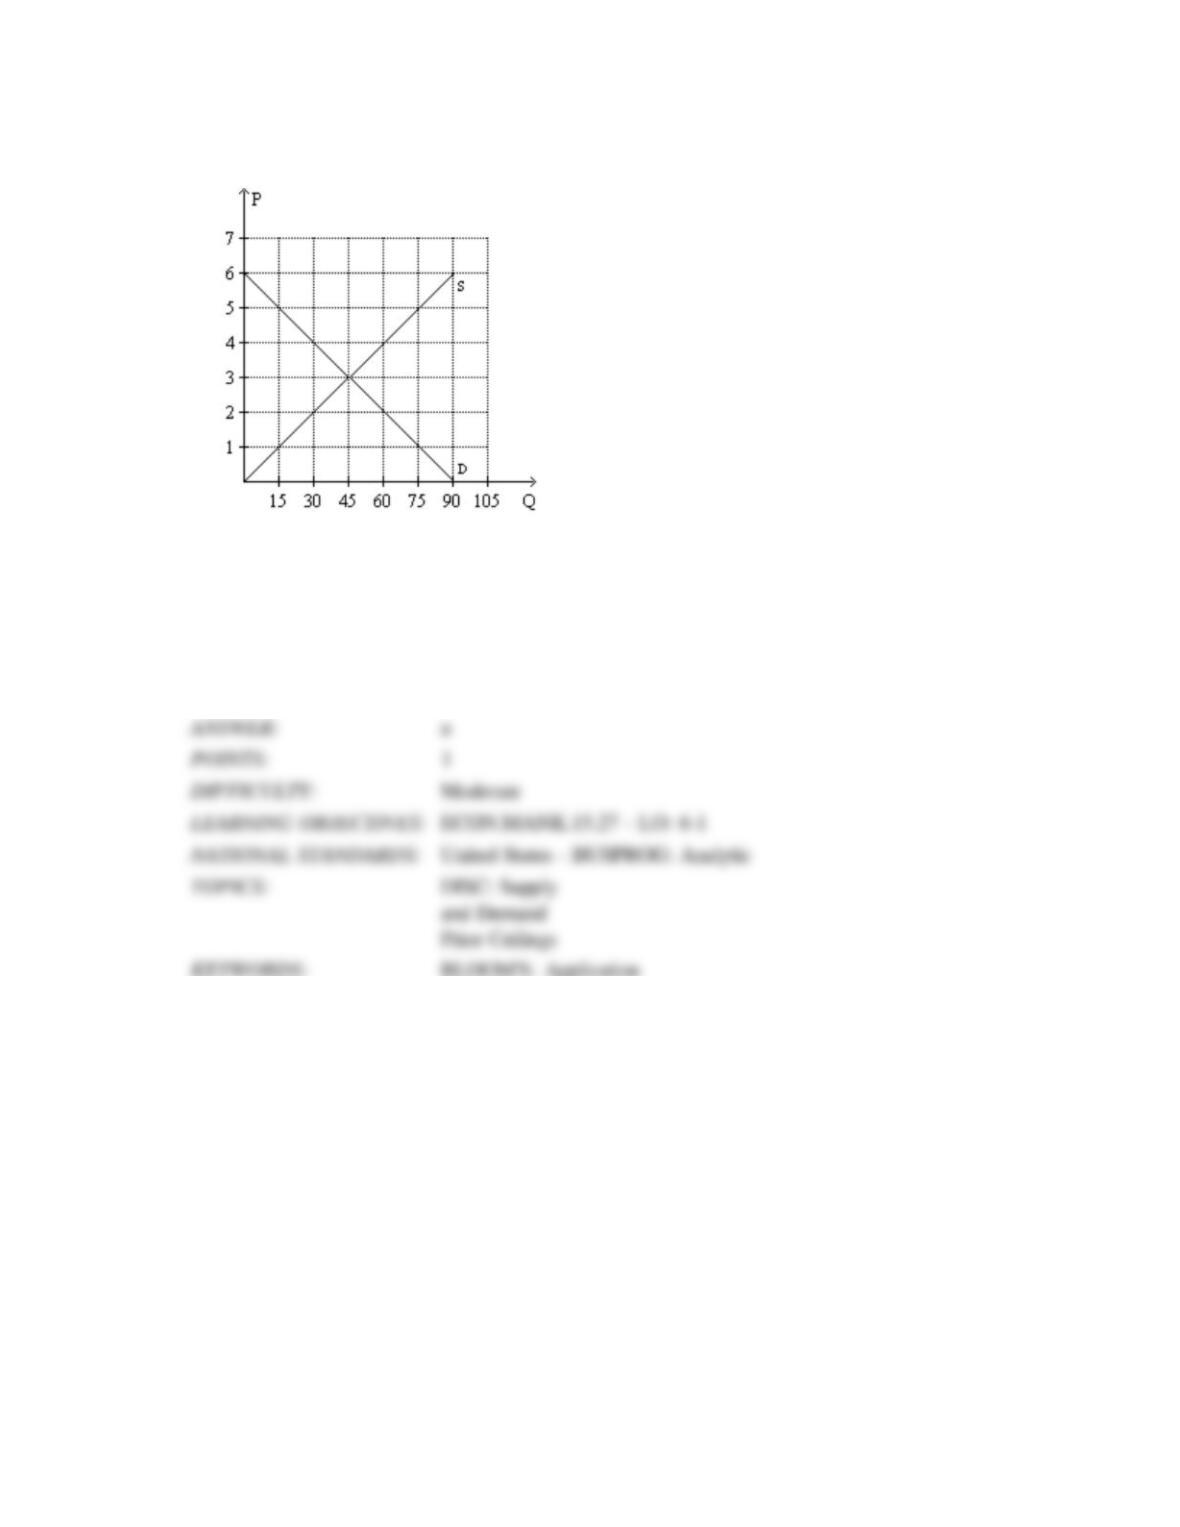
140. Refer to Figure 6-15. For a price ceiling to be binding in this market, it would have to be set at
a. any price below $3.
b. a price between $2 and $3.
c. a price between $3 and $4.
d. any price above $3.
Supply, Demand, and Government Policies 1479
141. Refer to Figure 6-15. For a price floor to be binding in this market, it would have to be set at
a. any price below $3.
b. a price between $2 and $3.
c. a price between $3 and $4.
d. any price above $3.
142. Refer to Figure 6-15. Suppose a price ceiling of $2 is imposed on this market. As a result,
a. the quantity of the good supplied decreases by 30 units.
b. the demand curve shifts to the left so as to now pass through the point (quantity = 30, price =
$2).
c. buyers’ total expenditure on the good decreases by $75.
d. buyers’ total expenditure on the good falls by $15.
1480 Supply, Demand, and Government Policies
143. Refer to Figure 6-15. Suppose a price floor of $4 is imposed on this market. As a result,
a. buyers’ total expenditure on the good decreases by $15.
b. the supply curve shifts to the left so as to now pass through the point (quantity = 30, price =
$4).
c. the quantity demanded of the good decreases by 30 units.
d. the number of units sold in the market will increase by 15 units.
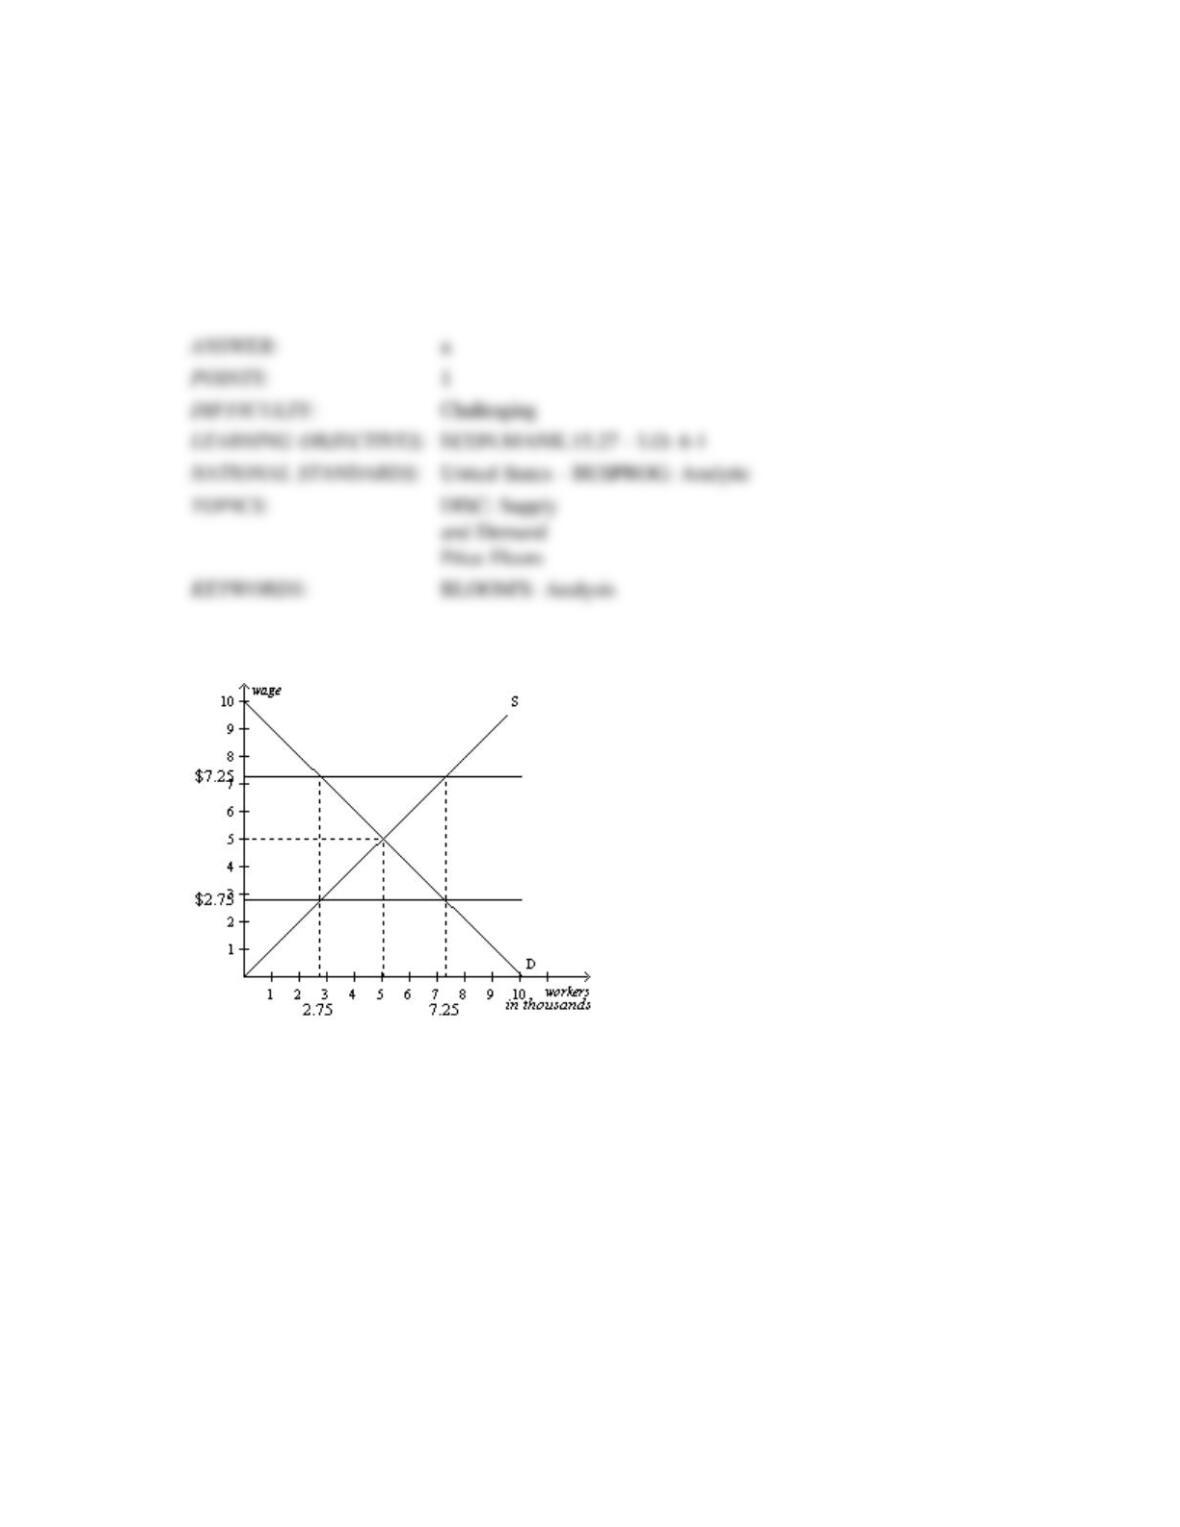
Figure 6-16
Supply, Demand, and Government Policies 1481
144. Refer to Figure 6-16. In this market, a minimum wage of $7.25 is
a. binding and creates a labor shortage.
b. binding and creates unemployment.
c. nonbinding and creates a labor shortage.
d. nonbinding and creates neither a labor shortage nor unemployment.
145. Refer to Figure 6-16. In this market, a minimum wage of $2.75 is
a. binding and creates a labor shortage.
b. binding and creates unemployment.
c. nonbinding and creates a labor shortage.
d. nonbinding and creates neither a labor shortage nor unemployment.
1482 Supply, Demand, and Government Policies
146. Refer to Figure 6-16. In this market, a minimum wage of $7.25 creates a labor
a. shortage of 2,250 workers.
b. shortage of 4,500 workers.
c. surplus of 2,250 workers.
d. surplus of 4,500 workers.
147. Refer to Figure 6-16. In this market, a minimum wage of $2.75 creates a labor
a. shortage of 2,250 workers.
b. shortage of 4,500 workers.
c. surplus of 2,250 workers.
d. neither a labor shortage nor surplus.
Supply, Demand, and Government Policies 1483
Table 6-1
Price
Quantity
Demanded
Quantity
Supplied
$20
2400
0
$30
2000
200
$40
1600
400
$50
1200
600
$60
800
800
$70
400
1000
$80
0
1200
148. Refer to Table 6-1. Which of the following price ceilings would be binding in this market?
a. $80
b. $70
c. $60
d. $50
149. Refer to Table 6-1. Which of the following price floors would be binding in this market?
a. $70
b. $60
c. $5
d. $40
1484 Supply, Demand, and Government Policies
150. Refer to Table 6-1. Suppose the government imposes a price ceiling of $40 on this market.
What will be the size of the shortage in this market?
a. 0 units
b. 400 units
c. 1200 units
d. 1600 units
Supply, Demand, and Government Policies 1485
151. Refer to Table 6-1. Suppose the government imposes a price ceiling of $70 on this market.
What will be the size of the shortage in this market?
a. 0 units
b. 400 units
c. 600 units
d. 1000 units
152. Refer to Table 6-1. Suppose the government imposes a price floor of $30 on this market. What
will be the size of the surplus in this market?
a. 0 units
b. 200 units
c. 1800 units
d. 2000 units
1486 Supply, Demand, and Government Policies
153. Refer to Table 6-1. Suppose the government imposes a price floor of $70 on this market.
What will be the size of the surplus in this market?
a. 0 units
b. 400 units
c. 600 units
d. 1000 units
Table 6-2
Price
Quantity
Demanded
Quantity
Supplied
$0
375
0
$5
300
50
$10
225
100
$15
150
150
$20
75
200
$25
0
250
154. Refer to Table 6-2. A price ceiling set at $5 will
a. be binding and will result in a shortage of 50 units.
b. be binding and will result in a shortage of 250 units.
c. be binding and will result in a shortage of 300 units.
d. not be binding.

Supply, Demand, and Government Policies 1487
1488 Supply, Demand, and Government Policies
155. Refer to Table 6-2. A price ceiling set at $20 will
a. be binding and will result in a shortage of 75 units.
b. be binding and will result in a shortage of 200 units.
c. be binding and will result in a shortage of 125 units.
d. not be binding.
156. Refer to Table 6-2. A price floor set at $20 will
a. be binding and will result in a surplus of 75 units.
b. be binding and will result in a surplus of 125 units.
c. be binding and will result in a surplus of 200 units.
d. not be binding.
Supply, Demand, and Government Policies 1489
157. Refer to Table 6-2. A price floor set at $5 will
a. be binding and will result in a surplus of 50 units.
b. be binding and will result in a surplus of 250 units.
c. be binding and will result in a surplus of 300 units.
d. not be binding.
158. Refer to Table 6-2. A price ceiling set at $5 results in
a. 50 units sold.
b. 250 units sold.
c. 300 units sold.
d. 350 units sold.
1490 Supply, Demand, and Government Policies
159. Refer to Table 6-2. A price floor set at $20 results in
a. 75 units sold.
b. 125 units sold.
c. 200 units sold.
d. 275 units sold.
Table 6-3
The following table contains the demand schedule and supply schedule for a market for a
particular good. Suppose sellers of the good successfully lobby Congress to impose a price floor
$2 above the equilibrium price in this market.
Price
Quantity
Demanded
Quantity
Supplied
$0
15
0
$1
13
3
$2
11
6
$3
9
9
$4
7
12
$5
5
15
$6
3
18
Supply, Demand, and Government Policies 1491
160. Refer to Table 6-3. How many units of the good are sold after the imposition of the price
floor?
a. 5
b. 9
c. 10
d. 15
161. Refer to Table 6-3. Following the imposition of a price floor $2 above the equilibrium price,
irate buyers convince Congress to repeal the price floor and to impose a price ceiling $1 below
the former price floor. The resulting market price is
a. $2.
b. $3.
c. $4.
d. $5.
1492 Supply, Demand, and Government Policies
162. Refer to Table 6-3. Following the imposition of a price floor $2 above the equilibrium price,
irate buyers convince Congress to repeal the price floor and to impose a price ceiling $1 below
the former price floor. The resulting shortage is
a. 0 units.
b. 2 units.
c. 5 units.
d. 7 units.
Table 6-4
The following table contains the demand schedule and supply schedule for a market for a
particular good. Suppose sellers of the good successfully lobby Congress to impose a price floor
$3 above the equilibrium price in this market.
Price
Quantity
Demanded
Quantity
Supplied
$0
15
0
$1
13
3
$2
11
6
$3
9
9
$4
7
12
$5
5
15
$6
3
18
Supply, Demand, and Government Policies 1493
163. Refer to Table 6-4. How many units of the good are sold after the imposition of the price
floor?
a. 3
b. 9
c. 15
d. 18
164. Refer to Table 6-4. Following the imposition of a price floor $3 above the equilibrium price,
irate buyers convince Congress to repeal the price floor and to impose a price ceiling $1 below
the former price floor. The resulting market price is
a. $2.
b. $3.
c. $4.
d. $5.
1494 Supply, Demand, and Government Policies
165. Refer to Table 6-4. Following the imposition of a price floor $3 above the equilibrium price,
irate buyers convince Congress to repeal the price floor and to impose a price ceiling $1 below
the former price floor. The resulting shortage is
a. 0 units.
b. 4 units.
c. 5 units.
d. 10 units.
Table 6-5
Price
Quantity
Demanded
Quantity
Supplied
$0
150
0
$3
120
45
$6
90
90
$9
60
135
$12
30
180
$15
0
225
Supply, Demand, and Government Policies 1495
166. Refer to Table 6-5. Which of the following price ceilings would be binding in this market?
a. $3
b. $6
c. $9
d. None of the above price ceilings would be binding.
167. Refer to Table 6-5. Which of the following price floors would be binding in this market?
a. $3
b. $6
c. $9
d. None of the above price floors would be binding.