Chapter 6—The Normal Distribution
MUTLIPLE CHOICE QUESTIONS
6.1 + The normal distribution is
6.2 We care a great deal about areas under the normal distribution because
6.3 + We know that 25% of the class got an A on the last exam, and 30% got a B. What
percent got either an A or a B?
6.4 The difference between the histogram of 175 behavior problem scores and a
normal distribution is
6.5 If a population of behavior problem scores is reasonably approximated by a
normal distribution, we would expect that the X axis would
Chapter 6
243
6.6 + If behavior problem scores are normally distributed, and we want to say
something meaningful about what values are likely and what are unlikely, we
would have to know
6.7 The ordinate of a normal distribution is often labeled
6.8 Knowing that data are normally distributed allows me to
6.9 The distribution that is normally distributed with a mean of 0 and a standard
deviation of 1 is called
6.10 The symbol p is commonly used to refer to
6.11 + A z score of 1.25 represents an observation that is
6.12 + A linear transformation of data
Test Bank
244
6.13 Which of the following is a good reason to convert data to z scores?
6.14 If behavior problem scores are roughly normally distributed in the population, a
sample of behavior problem scores will
6.15 + The tables of the standard normal distribution contain only positive values of z.
This is because
6.16 + If we know that the probability for z > 1.5 is .067, then we can say that
6.17 If you are interested in identifying children who are highly aggressive, and you
have a normally distributed scale that will do so, you will be particularly
interested in
6.18 The text discussed setting “probable limits” on an observation. These limits are
those which have a
Chapter 6
6.19 + There are a few z scores that we use often that are worth remembering. The upper
50%, and 97.5 percent of a normal distribution are cut off by z scores of
6.20 + The formula for calculating the 95% probable limits on an observation is
6.21 We are interested in what the text calls “probable limits” because
6.22 + If we have data that have been sampled from a population that is normally
distributed with a mean of 50 and a standard deviation of 10, we would expect
that 95% of our observations would lie in the interval that is approximately
6.23 + Assume that your class took an exam last week and the mean and standard
deviation of the exam were 85 and 5, respectively. Your instructor told you that
30 percent of the students had a score of 90 or above. You would probably
6.24 The difference between “probable limits” and “confidence limits” is that the
probable limits
Test Bank
246
6.25 + When we transform scores to a distribution that has a mean of 50 and a standard
deviation of 10, those scores are called
6.26 Stanine scores
6.27 Transforming a set of data to a new mean and standard deviation using a linear
transformation
6.28 Which of the following is NOT always true of a normal distribution?
6.29 + The difference between a standard score of –1.0 and a standard score of 1.0 is
6.30 + If the test scores on an art history exam were normally distributed with a mean of
76 and standard deviation of 6, we would expect
6.31 + A test score of 84 was transformed into a standard score of –1.5. If the standard
deviation of test scores was 4, what is the mean of the test scores?
Chapter 6
6.32 “Abscissa” is to _______ as “ordinate” is to _______.
6.33 The advantage of using T-scores and standard scores is
6.34 The difference between a normal distribution and a standard normal distribution is
6.35 An example of a linear transformation is
6.36 The most common situation in statistical procedures is to assume that
6.37 For a normal distribution
6.38 A normal distribution
Test Bank
248
6.39 In a normal distribution, about how much of the distribution lies within two (2)
standard deviations of the mean?
d) *95% of the distribution
TRUE/FALSE QUESTIONS
population of observations is not normal.
0 and a standard deviation of 1.
theprobability of falling within that portion of the distribution.
mode.
means that she scored as high or higher than 95% of the other students who took
the test.
standard deviation from the mean on an exam, assuming the scores are normally
distributed, is approximately 68%.
minus one standard deviation from the mean.
OPEN-ENDED QUESTIONS
6.50 The birth weight of healthy, full term infants in the United States is nearly
normally distributed. The mean weight is 3,500 grams, and the standard deviation
is 500 grams.
a) What percent of healthy newborns will weigh more than 3,250 grams?
b) What weights would 95% of all healthy newborns tend to fall between?
c) What is the z score for an infant who weighs 2,750 grams?
Chapter 6
249
6.51 Create a z distribution based on the following data. Explain the process.
10 20 20 30 30 30 40 40 40 40 50 50 50 60 60 70
6.52 Using the distribution in the previous question, calculate z scores for:
a) X = 11
b) X = 35
c) X = 71
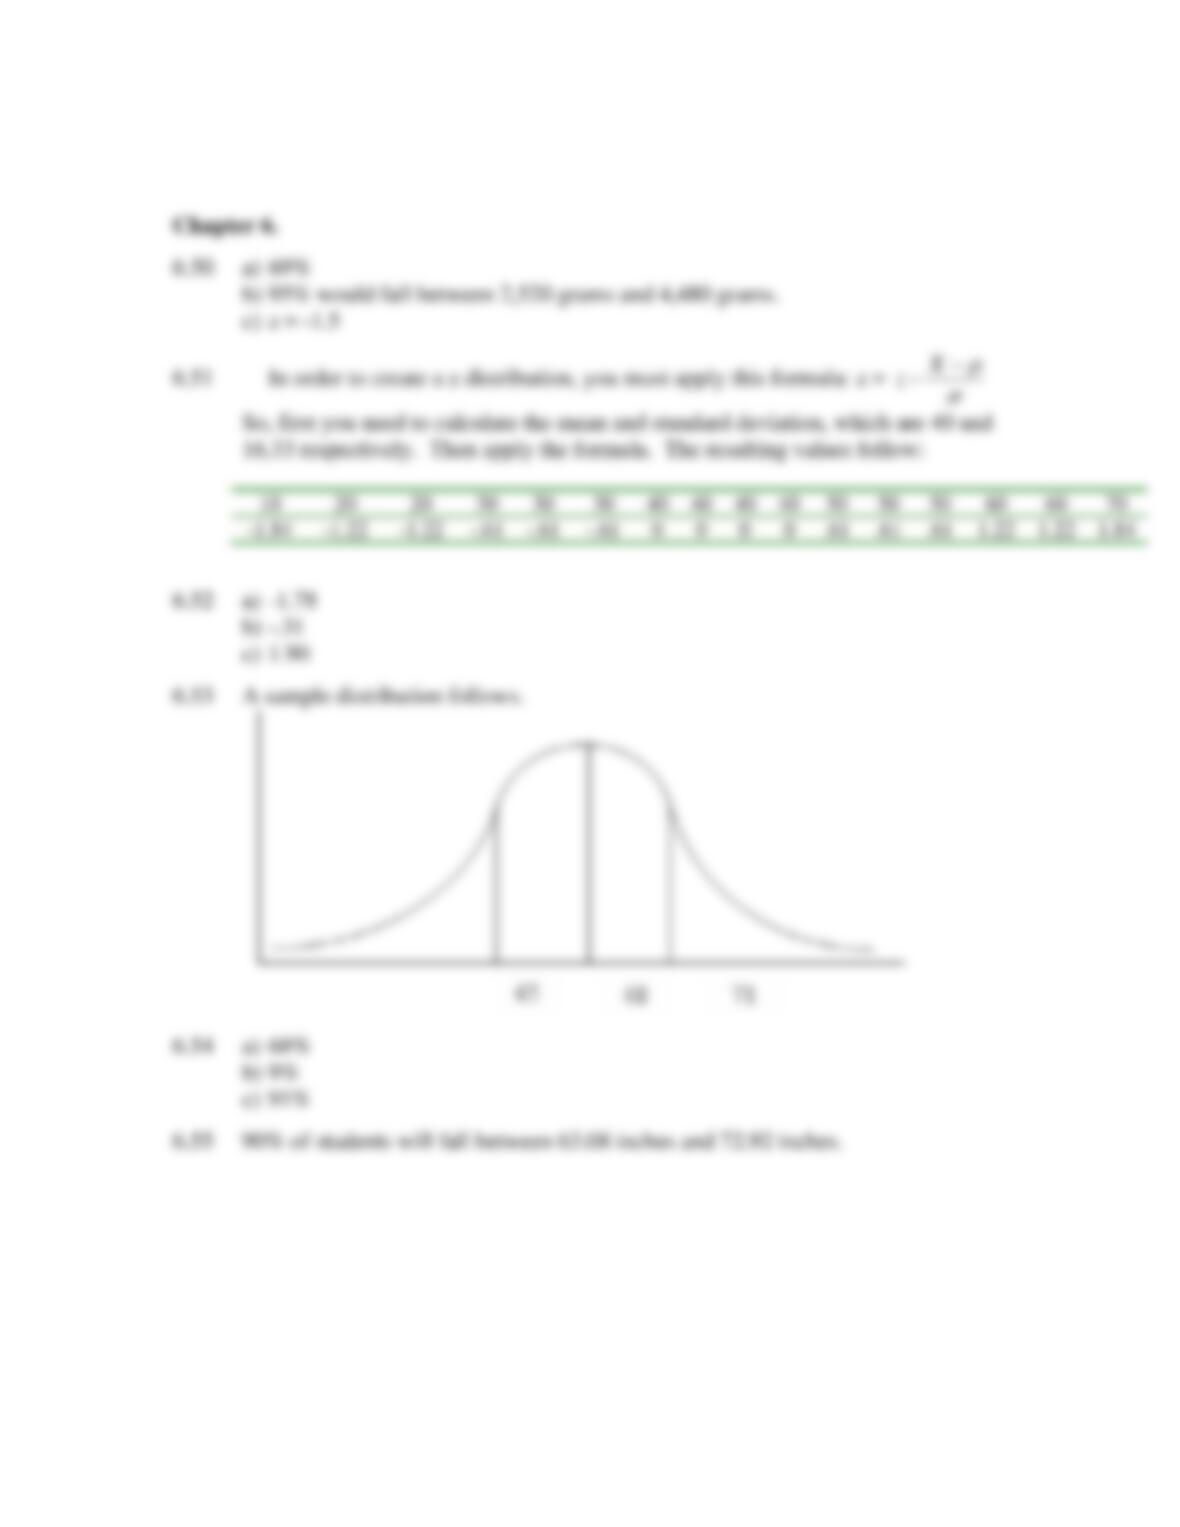
6.53 The height of students in a dormitory is normally distributed with a mean of 68
inches and a standard deviation of 3 inches. Draw the distribution.
6.54 Based on the height data in the previous question:
a) What percent of residents are between 65 inches and 71 inches tall?
b) What percent of residents are taller than 72 inches?
c) What percent of residents are shorter than 72 inches?
6.55 Based on the previous data, we could conclude that 90% of the students are likely
to fall between what heights?
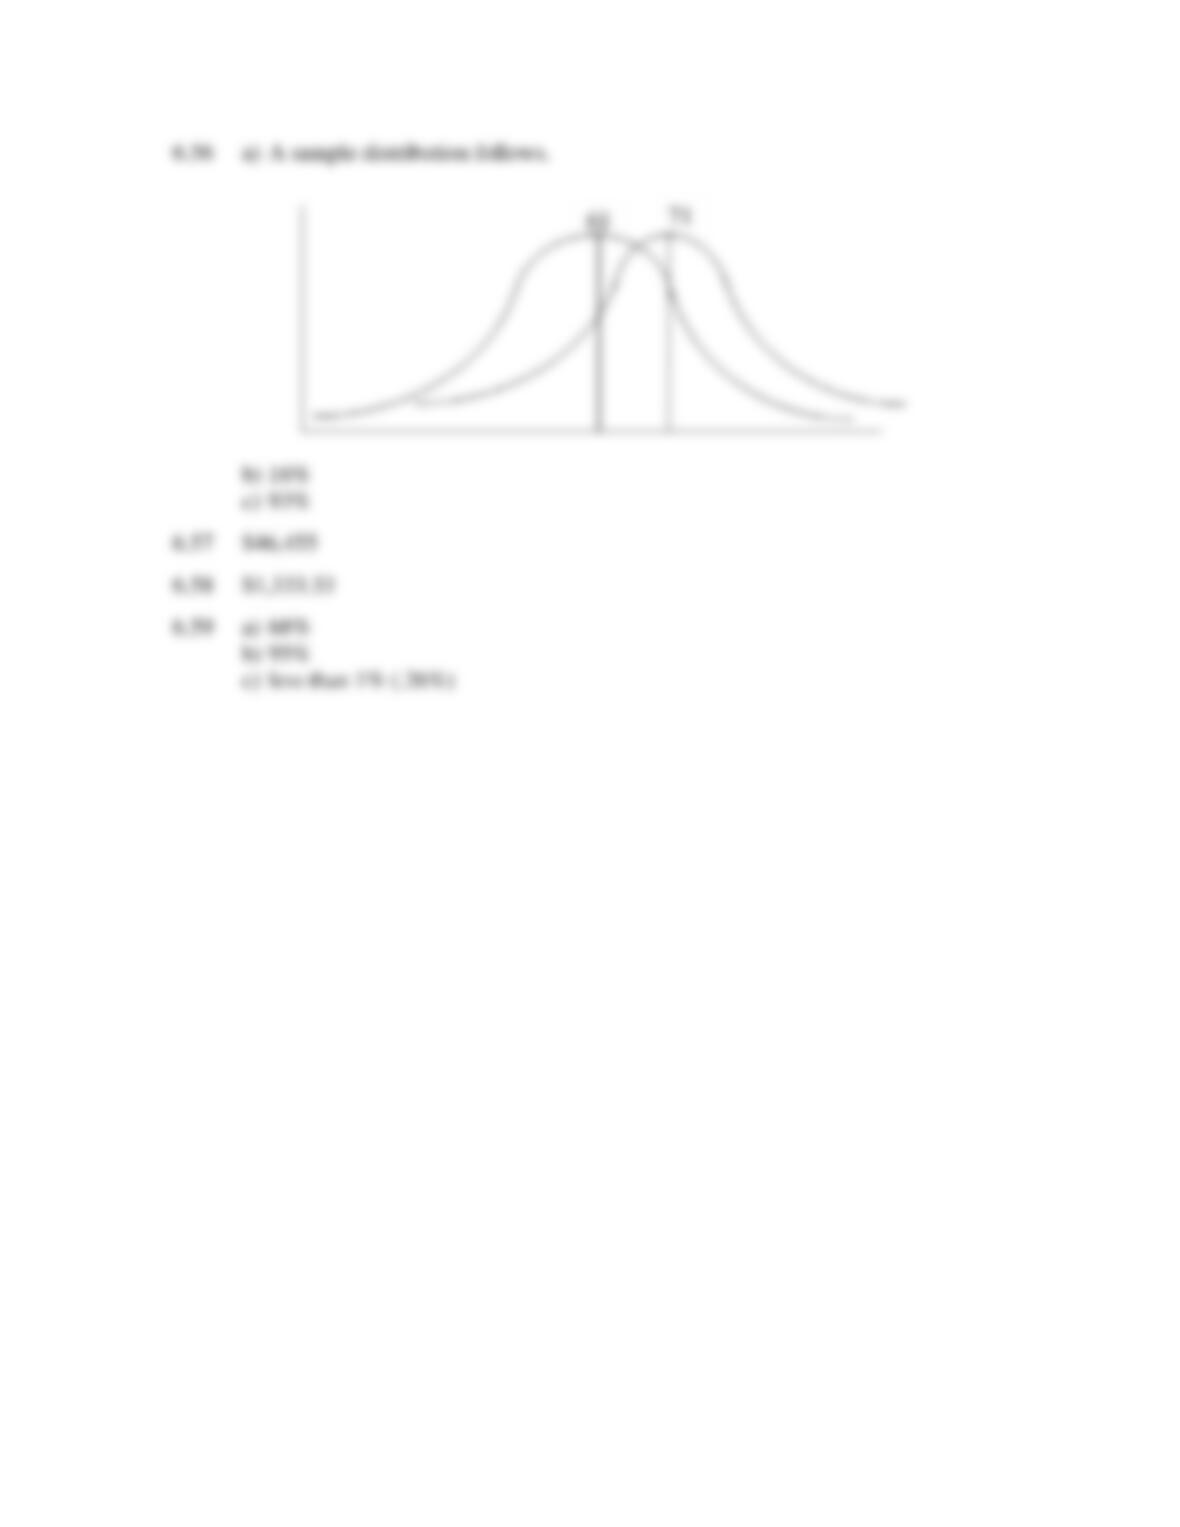
6.56 The basketball team lives in another dorm from those in the previous question.
Their heights are normally distributed as well, with a mean height of 71 inches
and a standard deviation of 2 inches.
a) Draw their distribution on the same graph as students who lived in the first
dorm (e.g., draw separate but overlapping distributions).
b) What percent of students in the first dorm are at least as tall as the average
basketball players?
c) What percent of basketball players are taller than the average dorm resident?
6.57 If the salary of assistant professors in this university is normally distributed with a
mean of $45,000 and a standard deviation of $1,500, what salary would have a z
score of .97?
6.58 At a neighboring university, the average salary is also $45,000 and the
distribution is normal. If $47,000 has a z score of 1.5, what is the standard
deviation?
6.59 In a normal distribution, indicate what percent of scores fall:
a) between the mean and 1 standard deviation above the mean
b) between plus and minus 2 standard deviations of the mean.
c) 3 standard deviations above or below the mean.
Test Bank
250
Answers to Open-ended Questions
Chapter 6
251