12) You notice that the price of butter falls and then rises. The best explanation for this is that
A) demand for butter increased causing price to fall, which attracted other firms to enter the
market causing supply to increase, which caused the price to go back up.
B) demand for butter decreased causing price to fall, which attracted other firms to enter the
market causing supply to increase, which caused the price to go back up.
C) demand for butter decreased causing price to fall, which induced other firms to exit the
market causing supply to decrease, which caused the price to go back up.
D) demand for butter decreased causing price to fall, which attracted other firms to enter the
market causing supply to decrease, which caused the price to go back up.
13) If the demand for a product increases, we would expect that price will initially ________,
and eventually ________.
A) rise; fall
B) rise; continue to rise
C) fall; rise
D) fall; continue to fall
14) If the demand for a product decreases, we would expect that price will initially ________,
and eventually ________.
A) rise; fall
B) rise; continue to rise
C) fall; rise
D) fall; continue to fall
15) If the demand for a product in an increasing cost perfectly competitive industry decreases,
we would expect that price in the long-run would ________ and the number of firms in the
market would ________.
A) decrease; decrease
B) increase; increase
C) decrease; increase
D) increase; decrease
16) If the demand for a product in an increasing cost perfectly competitive industry increases, we
would expect that price in the long-run would ________ and the number of firms in the market
would ________.
A) decrease; decrease
B) increase; increase
C) decrease; increase
D) increase; decrease
17) In a perfectly competitive industry, in the long run
A) firms earn a positive economic profit.
B) firms earn zero economic profit.
C) firms earn a negative economic profit.
D) firms might earn a positive, zero, or negative economic profit.
18) One difference between the short run and the long run is that perfectly competitive firms
A) always earn positive economic profit in the short run, but never in the long run.
B) can earn positive, negative, or zero economic profit in the short run, but will earn zero
economic profit in the long run.
C) earn zero economic profit in the short run, but will earn positive economic profit in the long
run.
D) always earn more economic profit in the long run.
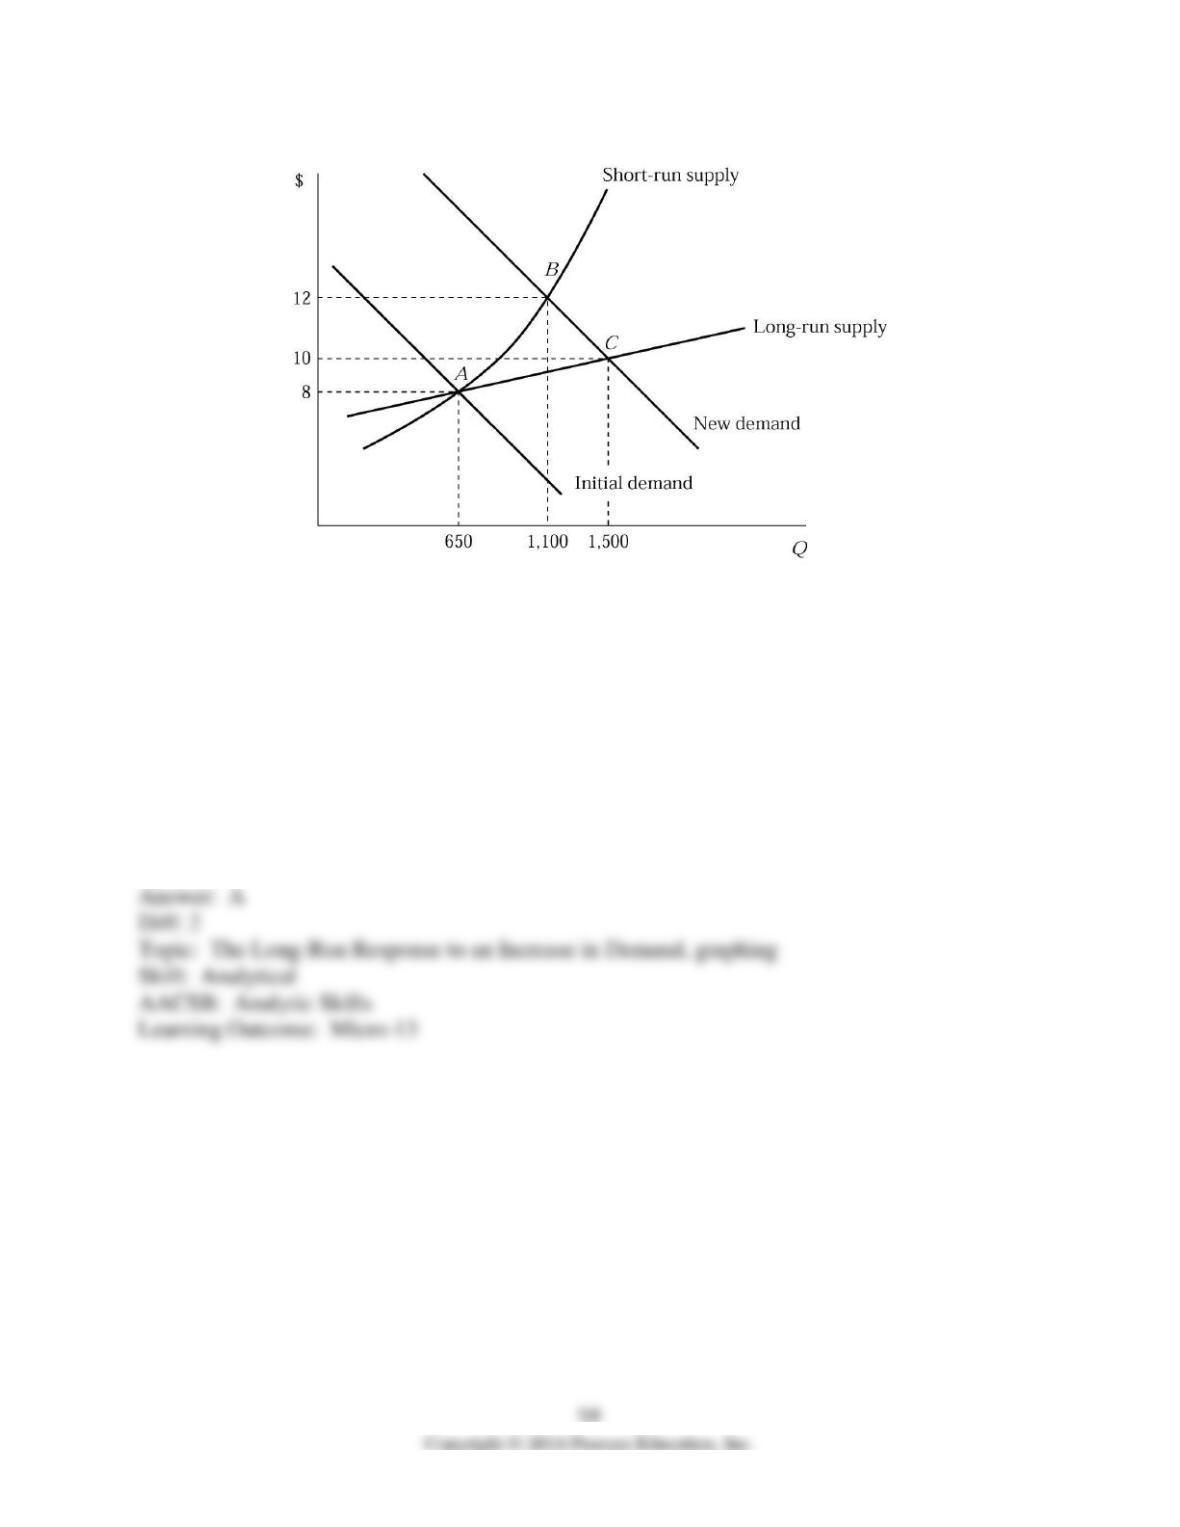
Figure 6.5
19) Figure 6.5 shows the short-run and long-run effects of an increase in demand of an industry
with increasing cost. The market is in equilibrium at point A, where 100 identical firms produce
6 units of a product per hour. If the market demand curve shifts to the right, what will happen to
an individual firm’s profit?
A) Each firm earns a positive profit at point B.
B) Each firm earns a zero profit at point B because the market is perfectly competitive.
C) The profit of each firm decreases as more firms enter the market and share the benefits of an
increase in demand pushing the market from point A to point B.
D) none of the above
20) Figure 6.5 shows the short-run and long-run effects of an increase in demand of an industry.
The market is in equilibrium at point A, where 100 identical firms produce 6 units of a product
per hour. If the market demand curve shifts to the right, what will happen to the number of firms
in the industry as the industry moves from point A to point B?
A) It increases.
B) It decreases.
C) It remains the same.
D) either A or B or C
21) Figure 6.5 shows the short-run and long-run effects of an increase in demand of an industry.
The market is in equilibrium at point A, where 100 identical firms produce 6 units of a product
per hour. If the market demand curve shifts to the right, what has happened to an individual
firm’s output level at point B?
A) Each firm produces two more units per hour.
B) Each firm produces relatively smaller level of output as more firms enter the market.
C) Each firm will produce the same level of output.
D) none of the above
22) Figure 6.5 shows the short-run and long-run effects of an increase in demand of an industry.
The market is in equilibrium at point A, where 100 identical firms produce 6 units of a product
per hour. If the market demand curve shifts to the right, which of the following statements is true
in the short-run?
A) The market price rises to $12, which is greater than the average total cost.
B) Each existing firm maximizes its profit by producing the output where marginal cost equals
$12.
C) Each existing firm produces two more units per hour, compared to its initial profit
maximizing output level at point A.
D) all of the above
23) Figure 6.5 shows the short-run and long-run effects of an increase in demand of an industry.
The market is in equilibrium at point A, where 100 identical firms produce 6 units of a product
per hour. If the market demand curve shifts to the right, which of the following statements is true
in the long-run?
A) The market price drops below $12 as more firms enter the market build more plants.
B) Both existing firms and new firms earn a zero economic profit.
C) All firms in the industry maximize their profits by producing the output where the marginal
cost equals $10.
D) all of the above
24) Figure 6.5 shows the short-run and long-run effects of an increase in demand of an industry.
The market is in equilibrium at point A, where 100 identical firms produce 6 units of a product
per hour. Suppose that the market demand curve shifts to the right. Why is the short-run supply
curve steeper than the long-run supply curve?
A) because production facilities are fixed in the short-run
B) because each firm experiences diminishing returns in the short-run
C) because production becomes costlier as firms squeeze more output from the existing
production facilities
D) all of the above
25) Figure 6.5 shows the short-run and long-run effects of an increase in demand of an industry.
The industry is
A) a constant-cost industry.
B) an increasing-cost industry.
C) a decreasing-cost industry.
D) There isn’t sufficient information.
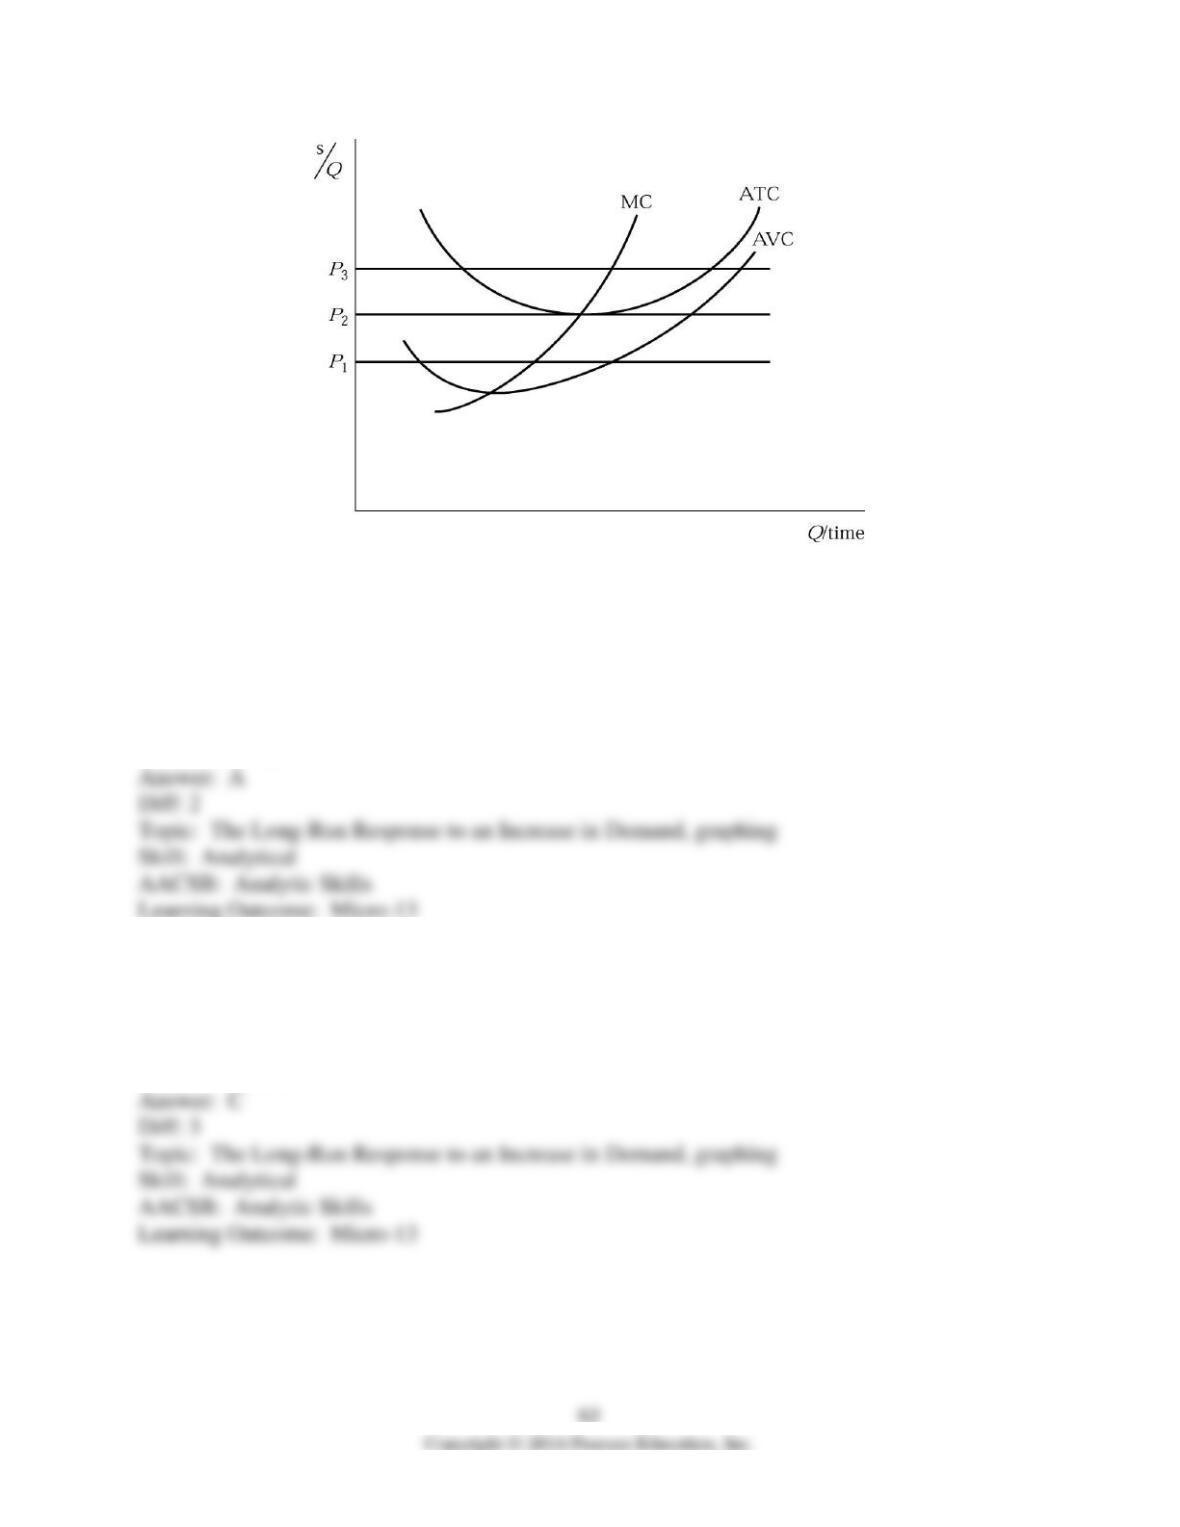
Figure 6.6
26) In figure 6.6 if price is P3 then the industry will
A) expand.
B) contract.
C) stay the same size.
D) cease to exist.
27) In Figure 6.6 if price is P2 then the industry will
A) expand.
B) contract.
C) stay the same size.
D) cease to exist.
28) In Figure 6.6 if price is P1 then the industry will
A) expand.
B) contract.
C) stay the same size.
D) merge.
Recall the Application about the price and supply of wine to answer the following
question(s).
29) Recall the application. The supply of wine in the short run is ________, so an increase in
demand causes the price to ________.
A) flexible; rise
B) flexible; fall
C) inflexible; rise
D) inflexible; fall
30) Recall the application. As the quantity of wine demanded increases, prices ________ in the
short-run and ________ as supply catches up with demand.
A) rise; stabilize
B) fall; stabilize
C) rise; fall
D) fall; rise
31) If perfectly competitive firms are earning positive economic profits in the short run, then in
the long run other firms will enter the market.
32) In the long-run perfectly competitive equilibrium, firms produce at the minimum of average
total cost.
33) An increase in demand will lead to a decrease in supply in the long run.
34) An increase in demand will induce entry by firms in the long run.
35) If firms make a profit in the short run, firms will exit the market in the long run.
36) It is possible that a firm in a perfectly competitive market earns a negative profit in the long
run.
37) Consider a perfectly competitive market. What do you expect to happen to the number of
firms and firm profitability in the short run and long run if demand for the product falls?
38) In a perfectly competitive market, what would you expect to happen to the number of firms
and firm profitability in the short run and long run if demand for the product rises?
39) Explain why perfectly competitive firms make zero economic profit in the long run.
6.7 Long-Run Supply for a Constant-Cost Industry
1) A constant cost industry is one in which
A) input prices do not change as output changes in the long-run.
B) supply is highly inelastic.
C) short-run supply is horizontal.
D) all of the above
2) A constant cost industry is more likely to arise in a market where
A) the industry takes only a small portion of the resources available.
B) the industry takes only a large portion of the resources available.
C) inputs have very different levels of quality.
D) firms have large fixed costs and small marginal costs.
3) A constant cost industry is one in which
A) demand is horizontal.
B) long-run supply is horizontal.
C) short-run supply is horizontal.
D) all of the above
4) In a constant cost industry, an increase in price causes
A) some firms to exit the industry.
B) quantity supplied to remain constant.
C) some firms to enter the industry.
D) price controls.
5) In a constant cost industry, a decrease in price causes
A) some firms to exit the industry.
B) quantity supplied to remain constant.
C) some firms to enter the industry.
D) price controls.
6) Which of the following products is the most likely to have constant costs in the long run?
A) ice
B) wine grapes
C) housing
D) copper
Recall the Application about the demand and price for margarine to answer the following
question(s).
7) Recall the Application. Between 2000 and 2009, total U.S. consumption of margarine
________ and the price, in real terms, ________.
A) doubled; doubled
B) decreased by roughly half; decreased by roughly half
C) decreased by roughly half; stayed roughly the same
D) doubled; stayed roughly the same
8) Recall the Application. The reason that the change in demand for margarine did not change
the equilibrium price in the long run is because the margarine industry is an example of
________ industry.
A) a decreasing-cost
B) an increasing-cost
C) a constant-cost
D) a negative-cost
9) The long-run supply curve is upward sloping in a constant cost industry.
10) In a constant cost industry, inputs prices do not change with changes in output.
11) Large industries that employ most of the available resources tend to have constant costs in
the long run.
12) A constant cost industry has an infinitely elastic long-run supply curve.
13) An increase in price causes exit from a constant cost industry.
14) What characterizes a constant cost industry and what causes it to be a constant cost industry?
15) What happens in the short-run and long-run in a constant cost industry like bags of ice after a
natural disaster like a hurricane?