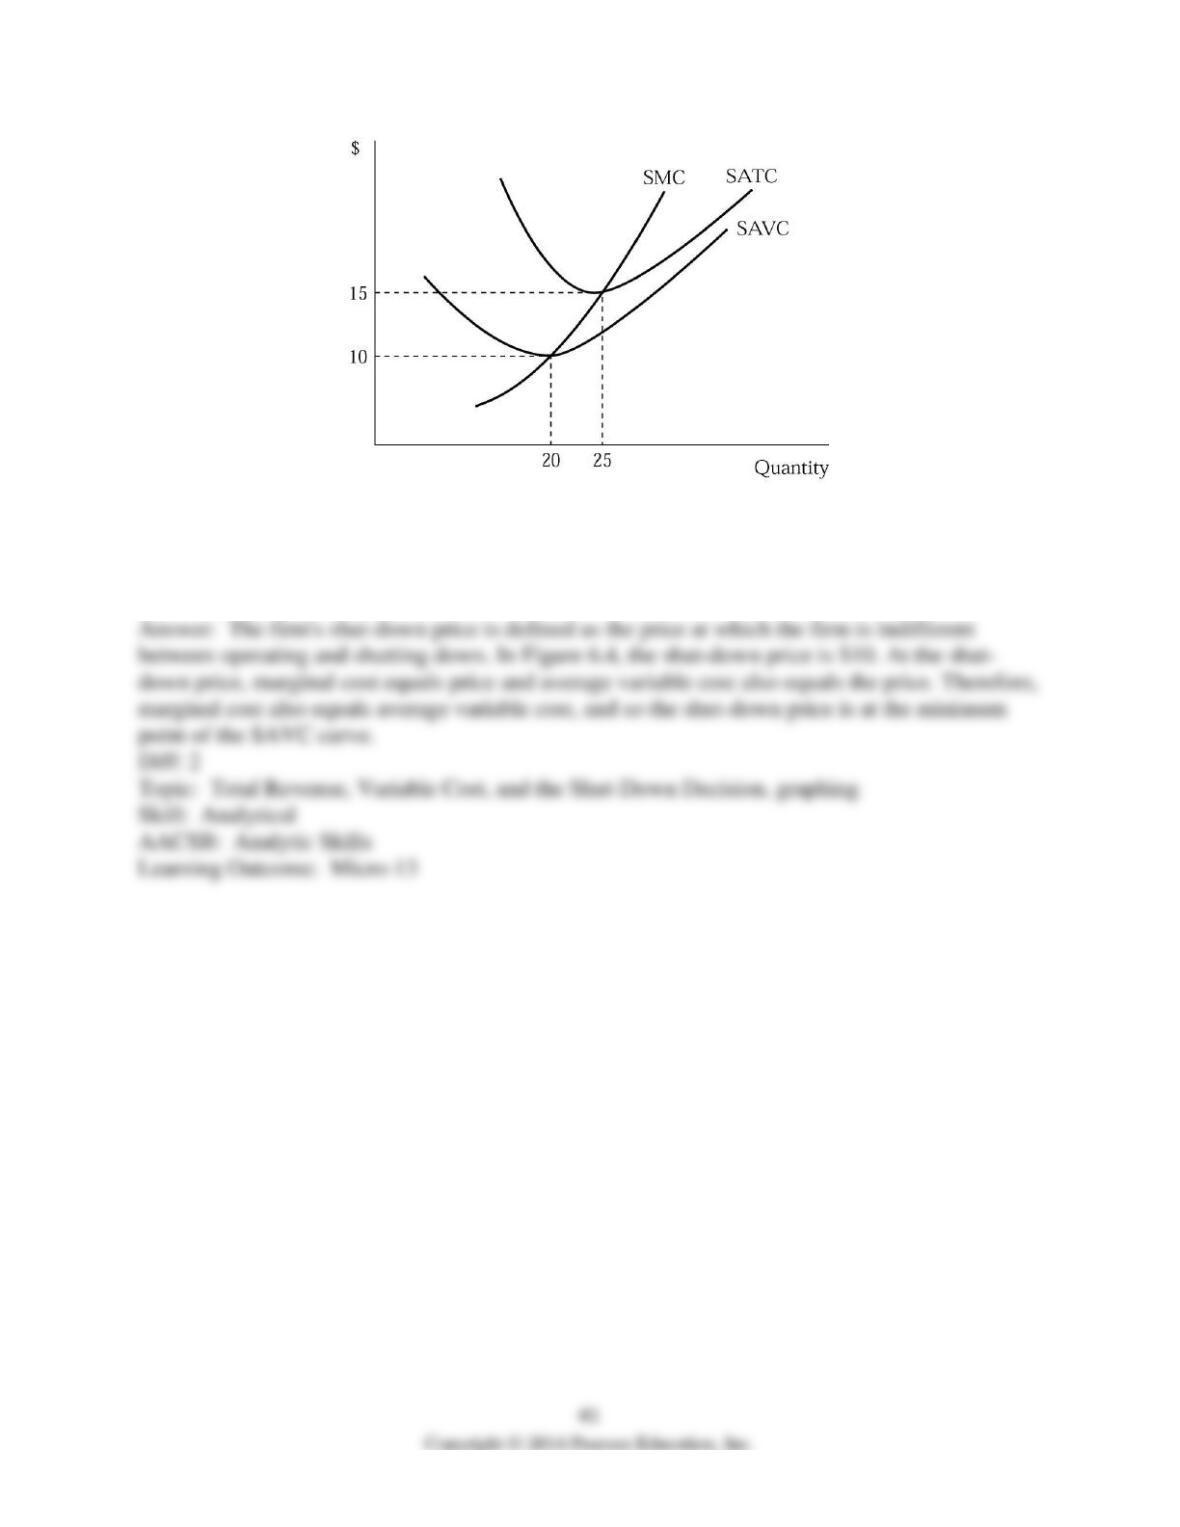
Figure 6.4
38) Figure 6.4 represents a perfectly competitive firm’s costs. Illustrate the firm’s shut-down
price on the graph. Explain.
6.4 Short-Run Supply Curves
1) A firm’s marginal cost curve above the minimum of the average variable cost curve is also
A) the firm’s demand for production curve.
B) the firm’s producer surplus curve.
C) the firm’s short-run supply curve.
D) the market supply curve.
2) The firm’s short-run supply curve shows the relationship between the price of a good and the
A) quantity demanded of that good.
B) quantity supplied of that good.
C) willingness of consumers to purchase the good.
D) firm’s capacity output.
3) A firm’s short-run supply curve is the firm’s
A) marginal revenue curve.
B) marginal cost curve above the minimum point of the average total cost curve.
C) marginal cost curve above the minimum point of the average variable cost curve.
D) average cost curve, below the minimum point of the marginal cost curve.
4) The relationship between the market price of a good and the quantity supplied of that good by
a firm in the short run is the firm’s
A) short-run supply curve.
B) average cost schedule.
C) total revenue minus total cost schedule.
D) optimal production level.
5) A perfectly competitive firm’s marginal cost curve above the minimum of the average variable
cost curve is its
A) short-run supply curve.
B) average cost schedule.
C) capacity output schedule.
D) total revenue minus total cost schedule.
6) The supply curve for a perfectly competitive market
A) is the summation of all the average cost curves of each firm in a market.
B) is the summation of all the marginal cost curves, above the minimum of the average variable
cost curve, from all the individual firms in the market.
C) is not related to the supply curves of individual firms.
D) is independent of price.
7) The summation of all individual firm marginal cost curves above the minimum of the average
variable cost curve
A) forms a curve that is usually downward sloping.
B) defines the relationship between price and demand.
C) defines the relationship between price and capacity output.
D) is the market supply curve.
8) Suppose that 100 firms operate in a perfectly competitive industry and each firm has the same
technology and cost structure. If each firm maximizes profits by selling 20 units of output at
$5.00, then the quantity supplied in the market at $5.00 is
A) 2,000.
B) less than 2,000.
C) greater than 2,000.
D) zero.
9) Which of the following is true for a perfectly competitive market in short-run equilibrium?
A) The quantity supplied equals the quantity demanded.
B) The typical firm earns zero economic profit.
C) The typical firm will always make a positive profit.
D) All of the above are correct.
10) Which of the following is true for a perfectly competitive market in long-run equilibrium?
A) There is no incentive for new firms to enter the market.
B) Each firm in the market earns zero economic profit.
C) There is no incentive for existing firms to leave the market.
D) All of the above are correct.
Recall the Application about the supply of shipping services to answer the following
question(s).
11) Recall the Application. The short-run supply curve for shipping services is
A) positively sloped.
B) negatively sloped.
C) perfectly vertical.
D) perfectly horizontal.
12) Recall the application. At a relatively low freight rate, only the ________ efficient ships
operate, and they save on cost by traveling at a ________ speed.
A) most; fast
B) most; slow
C) least; fast
D) least; slow
13) A firm’s short-run supply curve shows the relationship between price and quantity supplied.
14) A firm’s short-run supply curve is its marginal cost curve above the it average total cost
curve.
15) A firm’s short-run supply curve is its marginal cost curve above its average variable cost
curve.
16) A firm’s short-run supply curve is its marginal cost curve above the shut down point.
17) A competitive firm’s short-run supply curve is perfectly elastic.
18) The short-run market supply curve shows the relationship between the market price and the
quantity supplied in the short run.
19) If there are 100 identical firms in a perfectly competitive industry, and the typical firm
supplies 50 units of output at a price of $30, the industry output is 5,000 units at a price of $30.
20) In the long run, each firm in a perfectly competitive market earns zero economic profit.
21) Describe and explain a perfectly competitive firm’s short-run supply curve.
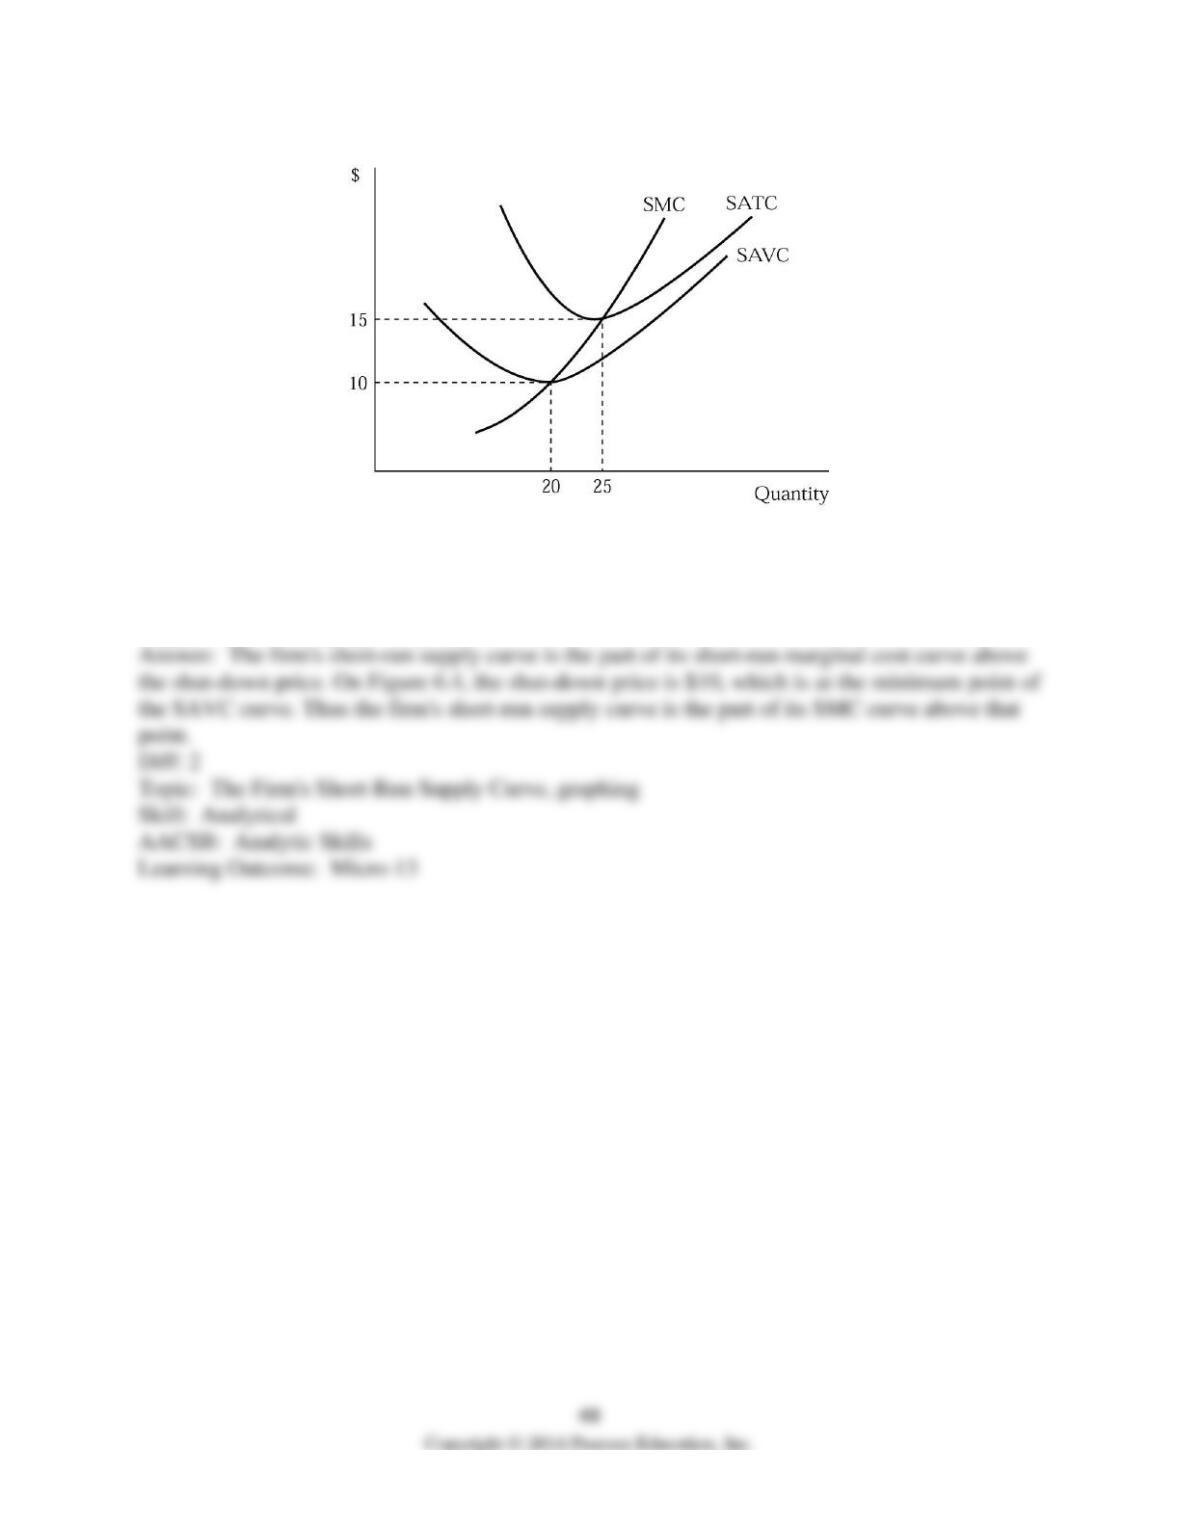
Figure 6.4
22) Figure 6.4 represents a perfectly competitive firm’s costs. Illustrate the firm’s short-run
supply curve on the graph. Explain.
6.5 The Long-Run Supply Curve for an Increasing-Cost Industry
1) An increasing-cost industry is one in which the average cost of production ________ as the
total output of the industry ________.
A) increases; increases
B) increases; decreases
C) decreases; increases
D) None of the above; there are no increasing-cost industries.
2) Costs increase with output in an increasing-cost industry because
A) input prices increase as the industry competes for scarce resources.
B) firms may be forced to use less productive inputs.
C) the firms become monopolies.
D) Both A and B are correct.
3) Heterogeneous inputs in a perfectly competitive market will cause the industry to face
________ costs because as the firm produces a larger quantity, it is forced to use ________
productive inputs.
A) increasing; less
B) decreasing; less
C) increasing; more
D) decreasing; more
4) In an increasing-cost industry, the long-run market supply curve is
A) positively sloped.
B) negatively sloped.
C) vertical.
D) horizontal.
Recall the Application about the production of coffee in China to answer the following
question(s).
5) Recall the application. Farmers in the city of Pu’er, China currently earn more growing
________ than they do growing ________.
A) tea; coffee
B) rice; coffee
C) coffee; tea
D) rice; tea
6) Recall the Application. Farmers in the city of Pu’er, China changing the acreage devoted to
coffee production illustrates the law of supply in that the ________ in the price of coffee
________ the quantity supplied.
A) increase; increased
B) increase; decreased
C) decrease; increased
D) decrease; decreased
7) One reason for increasing costs industries is that as an industry grows, it drives up the prices
of inputs.
8) An increasing cost industry is one where total costs rise as the industry grows.
9) The long-run supply curve is upward sloping in an increasing cost industry.
10) What is an increasing cost industry?
11) What is a long-run supply curve?
12) Firms in the long-run do not experience diminishing marginal returns. Then why do some
industries have upward-sloping long-run supply curves?
6.6 Short-Run and Long-Run Effects of Changes in Demand
1) If the market demand decreases for a good sold in a perfectly competitive market, firms in the
market
A) will be able to charge a higher price for their product.
B) will receive a lower price for their product.
C) will not be able to change their price.
D) will not be affected by the change in demand.
2) Toby sells wheat in a perfectly competitive market. This month Toby receives a lower price
for a bushel of wheat than he did last month. Which of the following might explain this?
A) The market demand for wheat increased.
B) The market demand for wheat decreased.
C) Firms exited the market.
D) Toby’s costs have increased.
3) Toby sells wheat in a perfectly competitive market. This month Toby receives a higher price
for a bushel of wheat than he did last month. Which of the following might explain this?
A) The market demand for wheat increased.
B) The market demand for wheat decreased.
C) Firms entered the market.
D) Toby’s costs have decreased.
4) Sheila sells corn in a perfectly competitive market. This month Sheila receives a lower price
for a bushel of corn than she did last month. This might have happened because
A) the market demand increased for corn.
B) the market demand decreased for corn.
C) firms exited the market.
D) Sheila’s costs have increased.
5) Sheila sells corn in a perfectly competitive market. This month Sheila receives a higher price
for a bushel of corn than she did last month. Which of the following might explain this?
A) The market demand increased for corn.
B) The market demand decreased for corn.
C) Firms entered the market.
D) Sheila’s costs have decreased.
6) A perfectly competitive industry is in long-run equilibrium. If demand for the product
increases, we can expect
A) firms to enter the market.
B) firms to exit the market.
C) no change in the number of firms in the market.
D) Not enough information to tell what will happen to the number of firms in the market.
7) A perfectly competitive industry is in long-run equilibrium. If demand for the product
decreases, we can expect
A) firms to enter the market.
B) firms to exit the market.
C) no change in the number of firms in the market.
D) Not enough information to tell what will happen to the number of firms in the market.
8) A perfectly competitive industry is in long-run equilibrium. If demand for the product
increases, we can expect the price of the good to
A) rise at first and then fall.
B) fall at first and then rise.
C) rise and remain at the higher price.
D) fall and remain at the lower price.
9) A perfectly competitive industry is in long-run equilibrium. If demand for the product
decreases, we can expect the price of the good to
A) rise at first and then fall.
B) fall at first and then rise.
C) rise and remain at the higher price.
D) fall and remain at the lower price.
10) Long-run equilibrium for a perfectly competitive industry occurs when
A) P = MC = ATC.
B) P = MC = AVC.
C) P = MC = AFC.
D) P > MC = ATC.
11) You notice that the price of butter rises and then falls. The best explanation for this is that
A) demand for butter increased causing price to rise, which attracted other firms to enter the
market causing supply to increase, which caused the price to go back down.
B) demand for butter decreased causing price to rise, which attracted other firms to enter the
market causing supply to increase, which caused the price to go back down.
C) demand for butter increased causing price to rise, which induced other firms to exit the
market causing supply to decrease, which caused the price to go back down.
D) demand for butter increased causing price to rise, which attracted other firms to enter the
market causing supply to decrease, which caused the price to go back down.