
52) Which curve best describes survivorship in elephants?
A) A
B) B
C) C
D) D
E) E
53) Which curve best describes survivorship in a marine crustacean that molts?
A) A
B) B
C) C
D) D
E) E
54) Which curve best describes survivorship in humans who live in undeveloped nations?
A) A
B) B
C) C
D) D
E) E
55) Which statement best explains survivorship curve B?
A) It is likely a species that provides little postnatal care, but lots of care for offspring during midlife as
indicated by increased survivorship.
B) This curve is likely of a species that produces lots of offspring, only a few of which are expected to
survive.
C) It is likely a species where no individuals in the cohort die when they are at 60—70% relative age.
D) There was a mass emigration of young to middle-aged individuals in this cohort.
E) Survivorship can only decrease; therefore, this curve could not happen in nature.
16
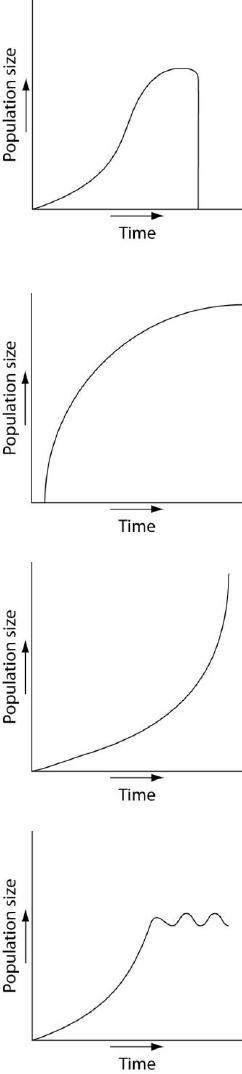
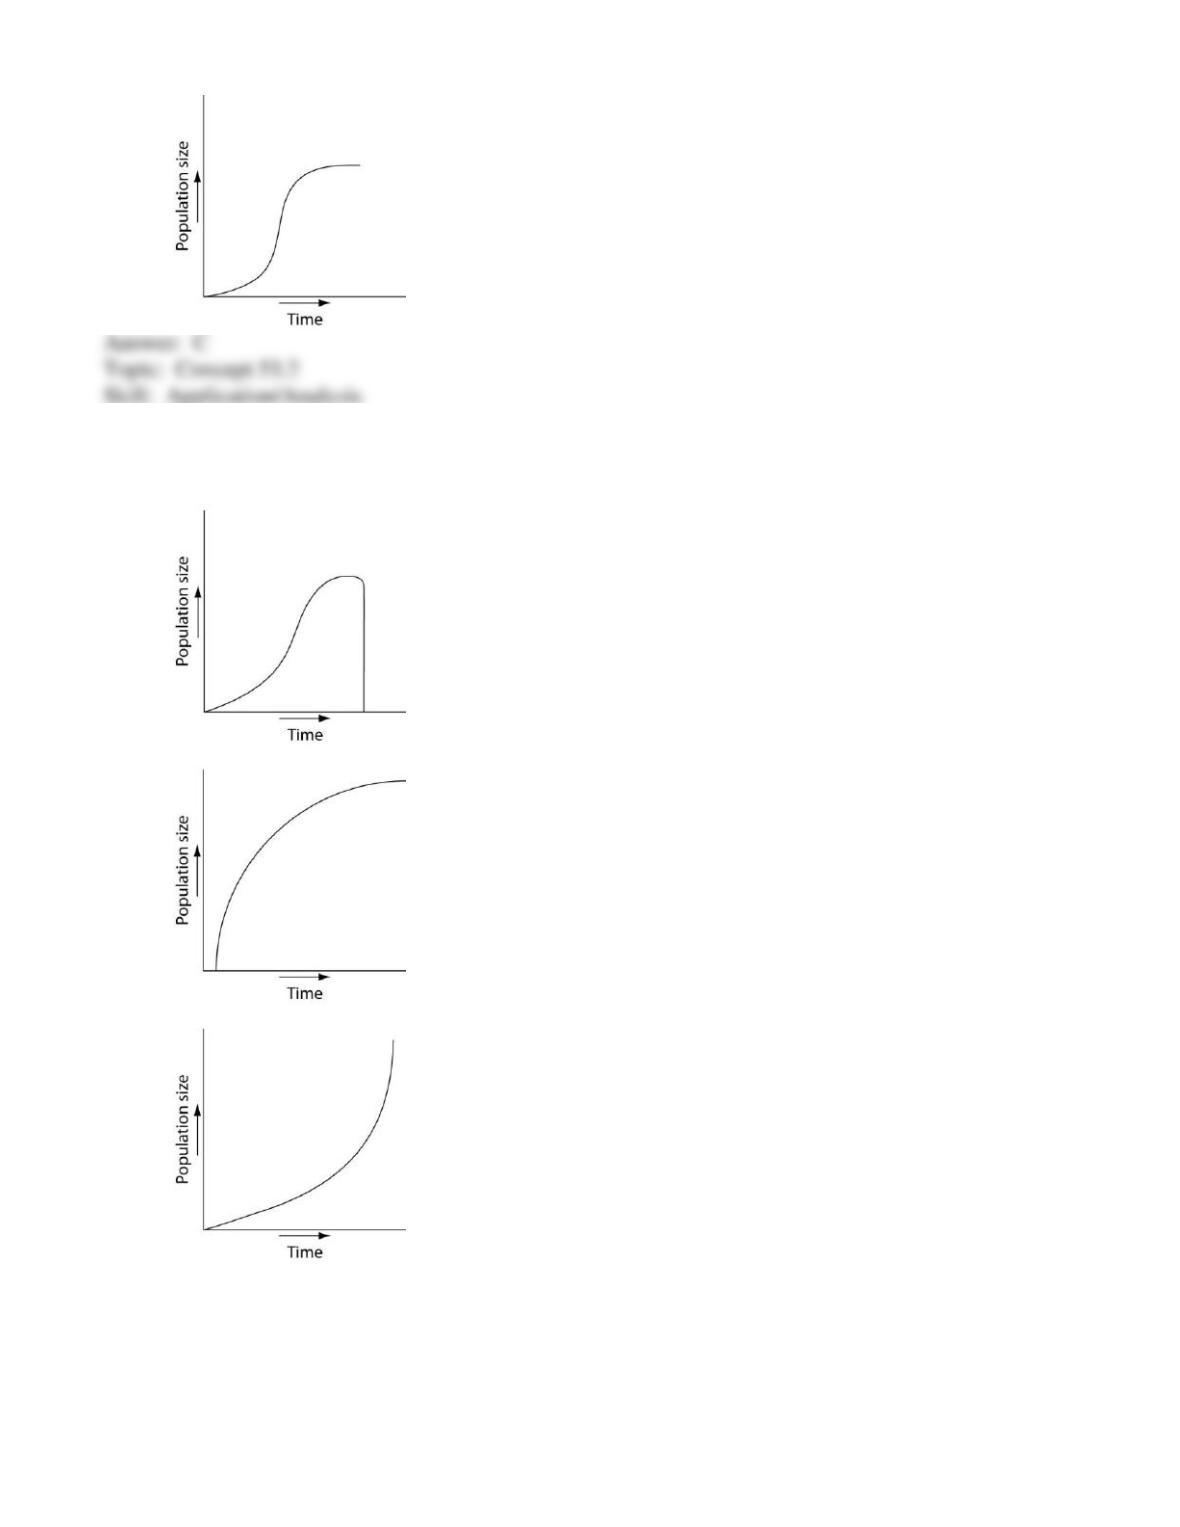
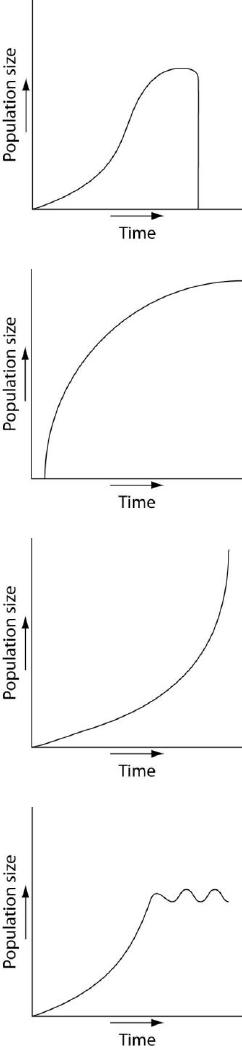
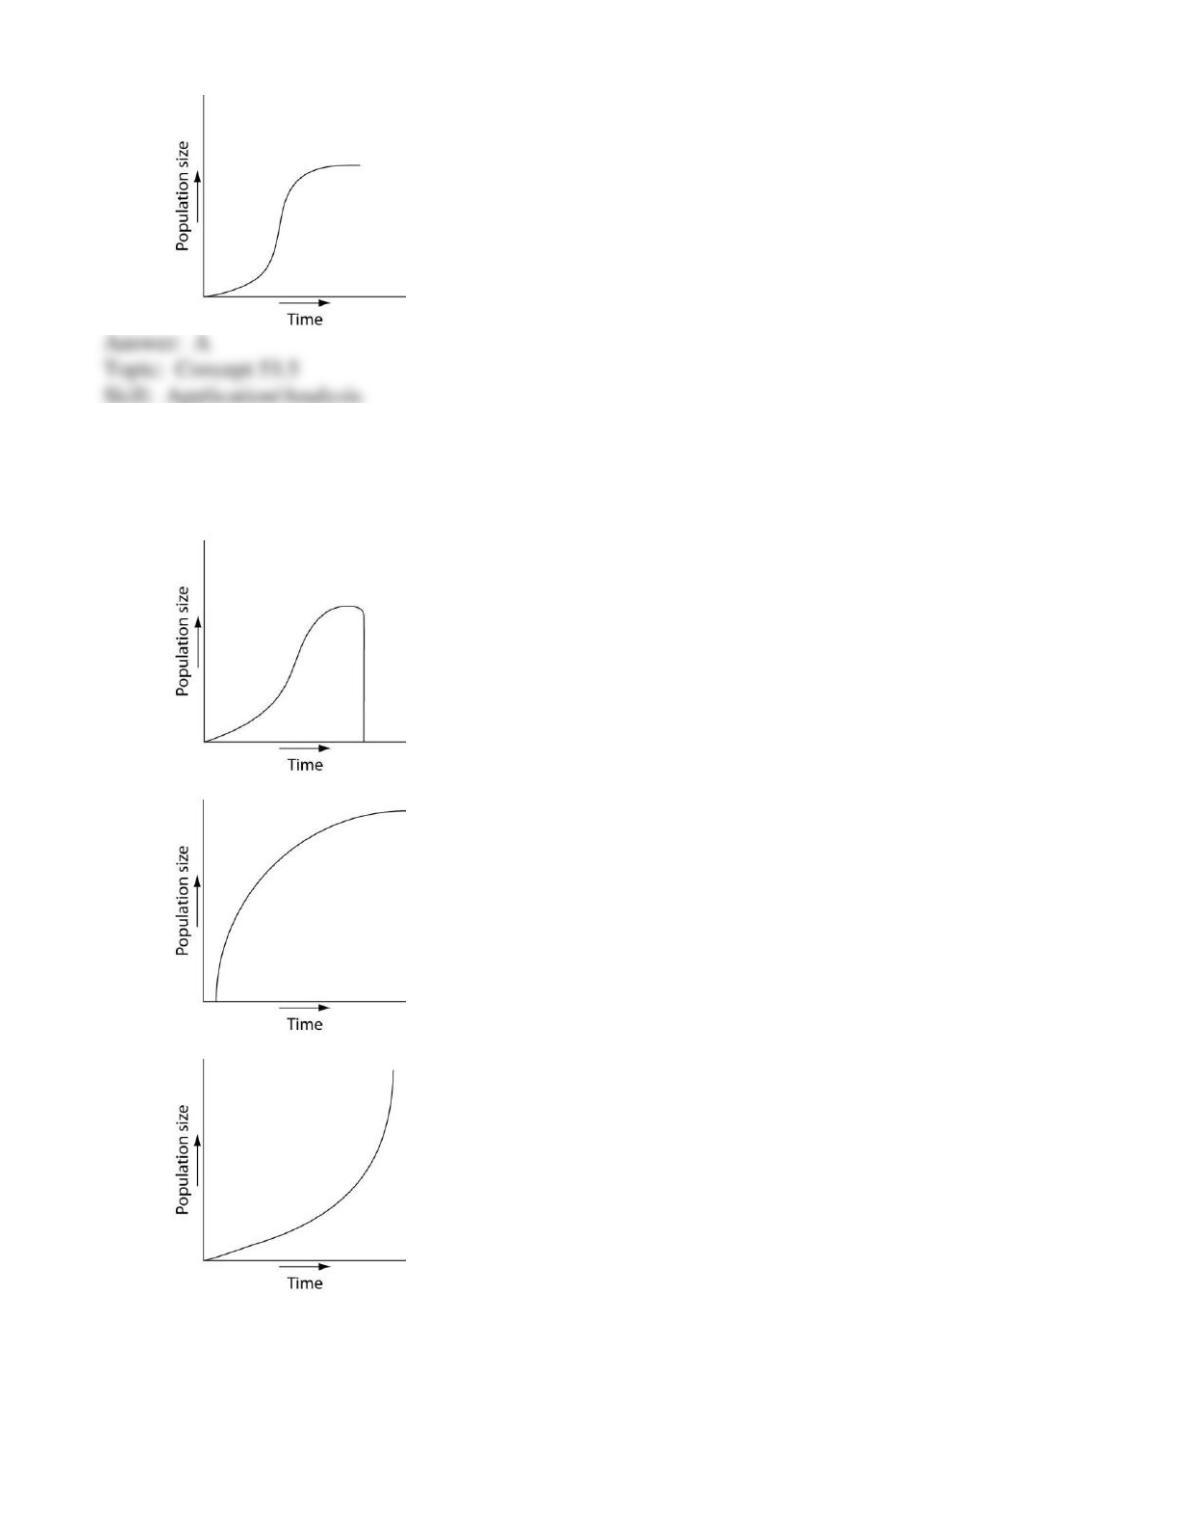
56) Which of the following graphs illustrates the population growth curve of single bacterium growing
in a flask of ideal medium at optimum temperature over a 24-hour period?
A)
B)
C)
D)
17
E)
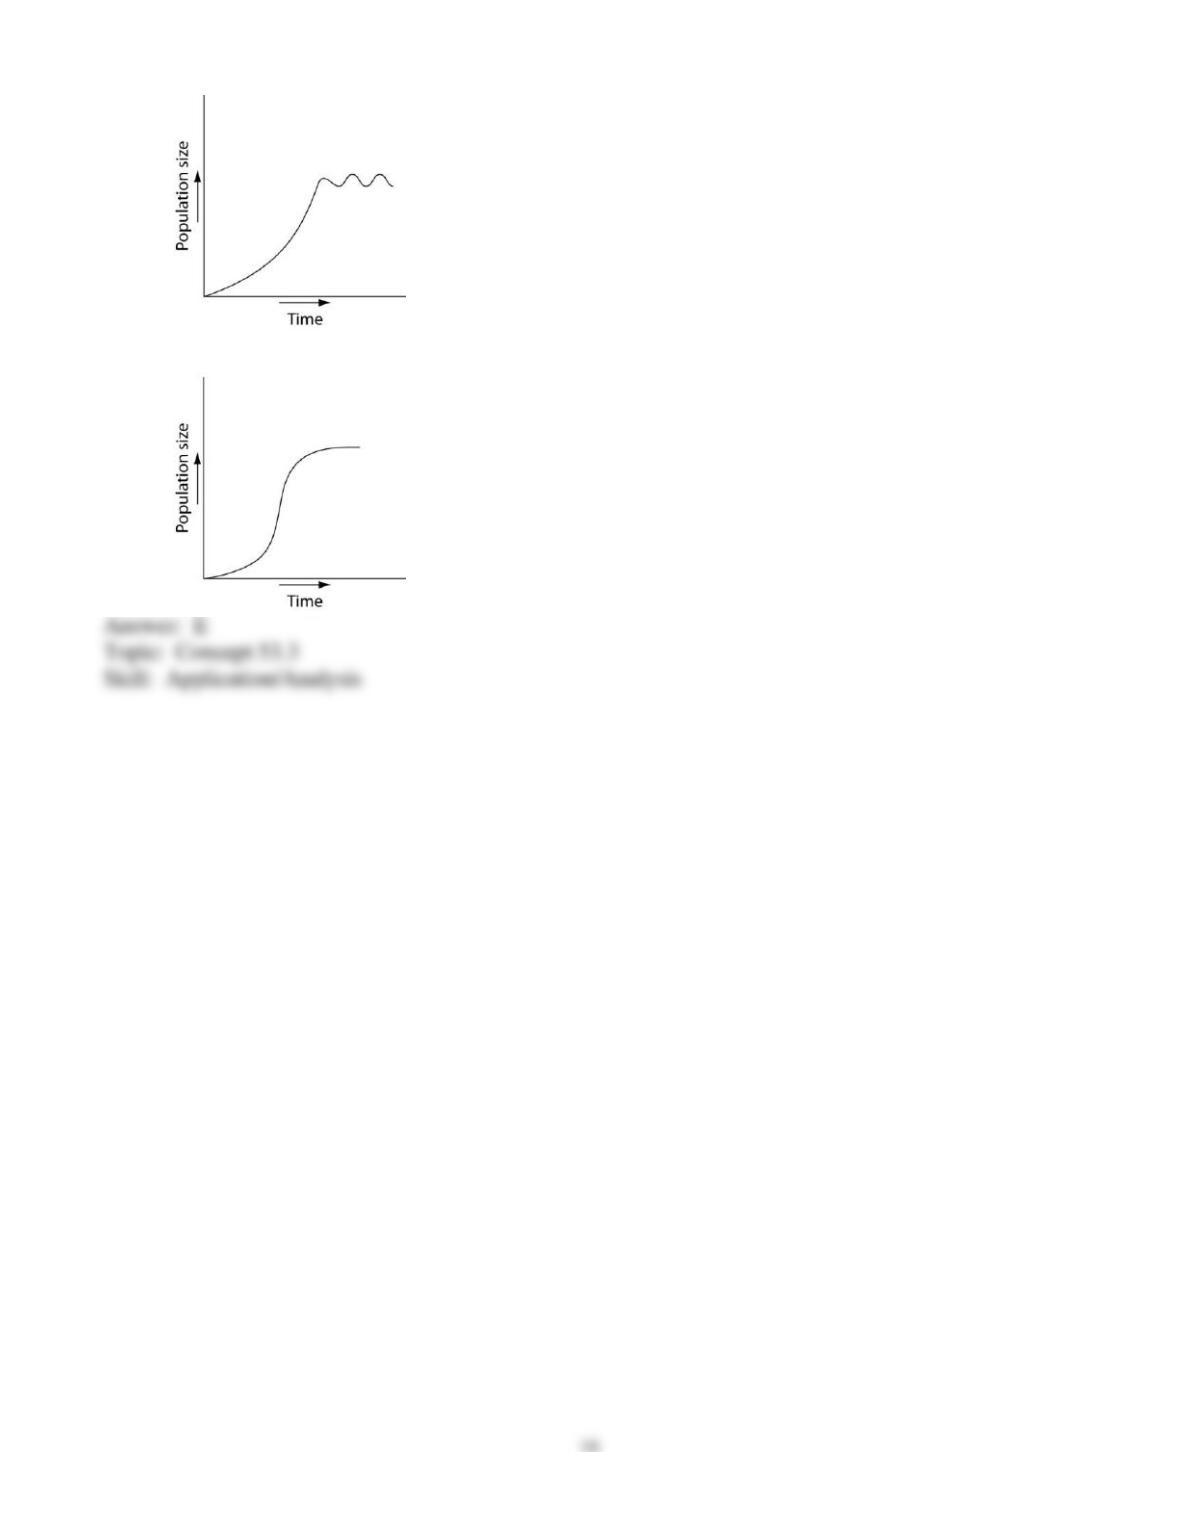
57) Which of the following graphs illustrates the growth curve of a small population of rodents that has
grown to reach a static carrying capacity?
A)
B)
C)
D)
E)
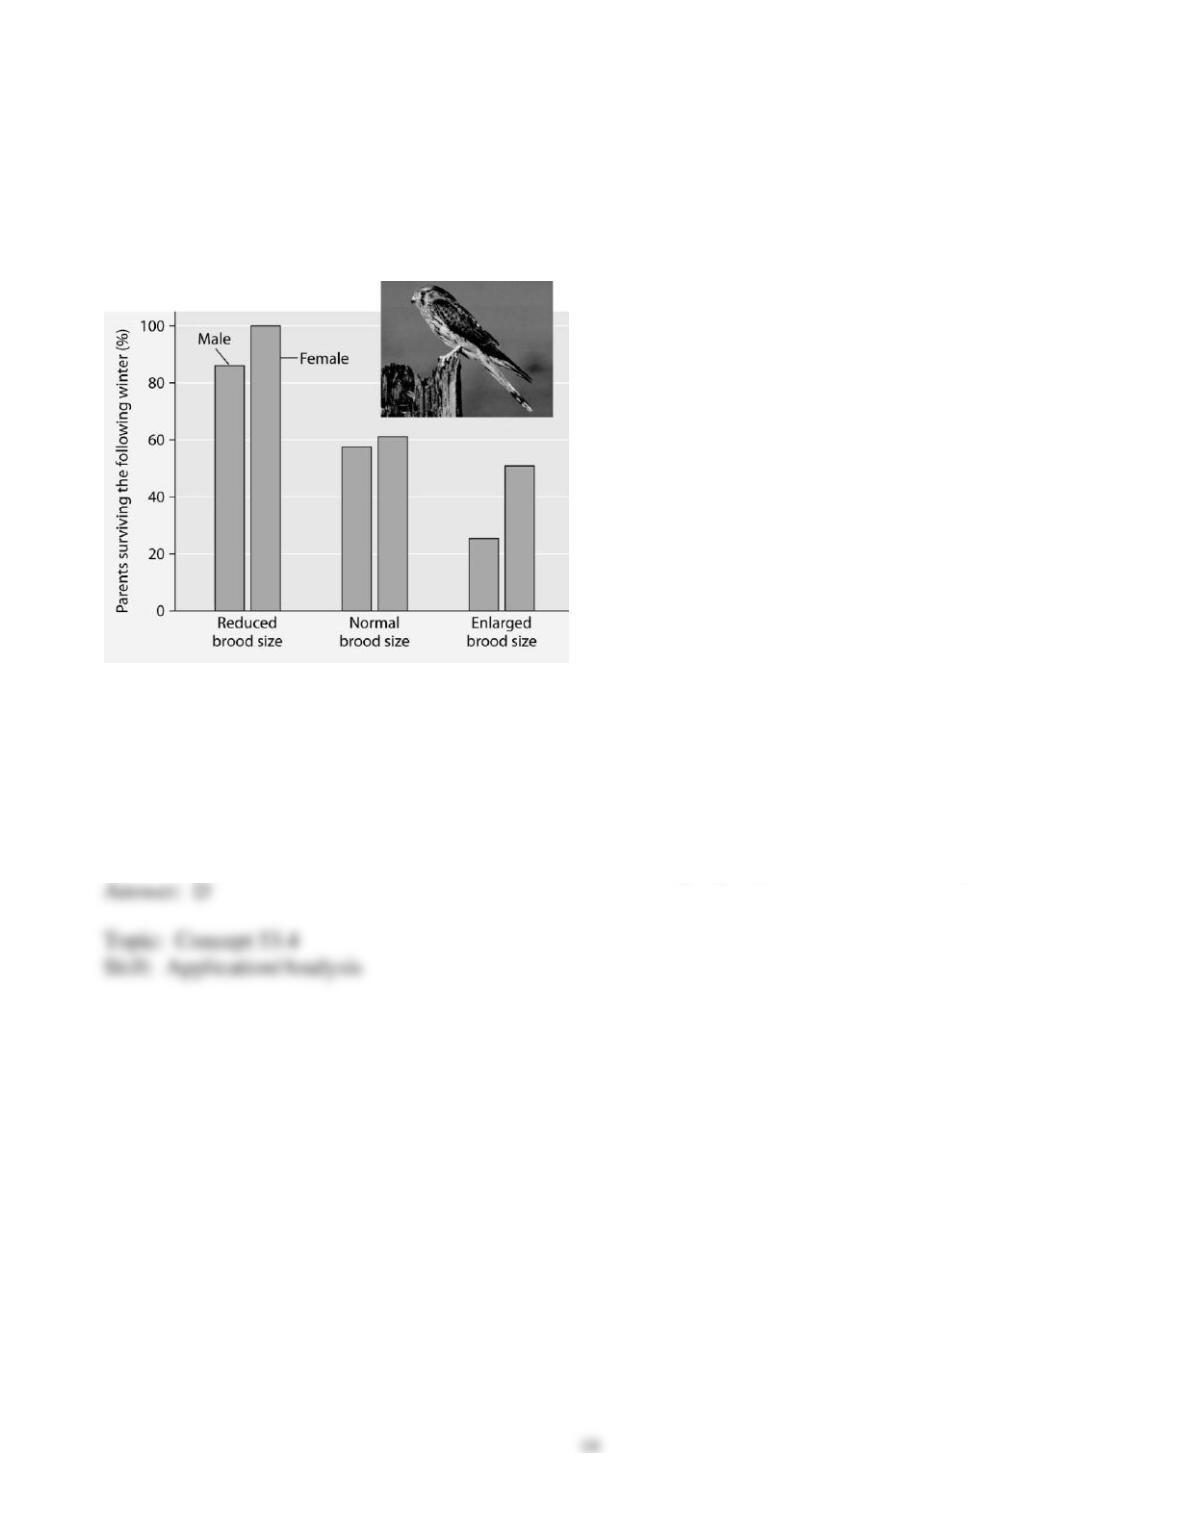
Please read the paragraph below and review Figure 53.2 to answer the following question.
Researchers in the Netherlands studied the effects of parental care given in European kestrels over five
years. The researchers transferred chicks among nests to produce reduced broods (three or four chicks),
normal broods (five or six chicks), and enlarged broods (seven or eight chicks). They then measured the
percentage of male and female parent birds that survived the following winter. (Both males and females
provide care for chicks.)
Figure 53.2: Brood size manipulations in the kestrel: Effects on offspring and parent survival.
58) Which of the following is a conclusion that can be drawn from this graph?
A) Female survivability is more negatively affected by larger brood size than is male survivability.
B) Male survivability decreased by 50% between reduced and enlarged brood treatments.
C) Both males and females had increases in daily hunting with the enlarged brood size.
D) There appears to be a negative correlation between brood enlargements and parental survival.
E) Chicks in reduced brood treatment received more food, weight gain, and reduced mortality.
20
59) Which of the following is a likely graphic outcome of a population of deer introduced to an island
with an adequate herbivory and without natural predators, parasites, or disease?
A)
B)
C)
D)
21
E)
60) Which of the following graphs illustrates the growth over several seasons of a population of
snowshoe hares that were introduced to an appropriate habitat also inhabited by predators in northern
Canada?
A)
B)
C)
D)
E)
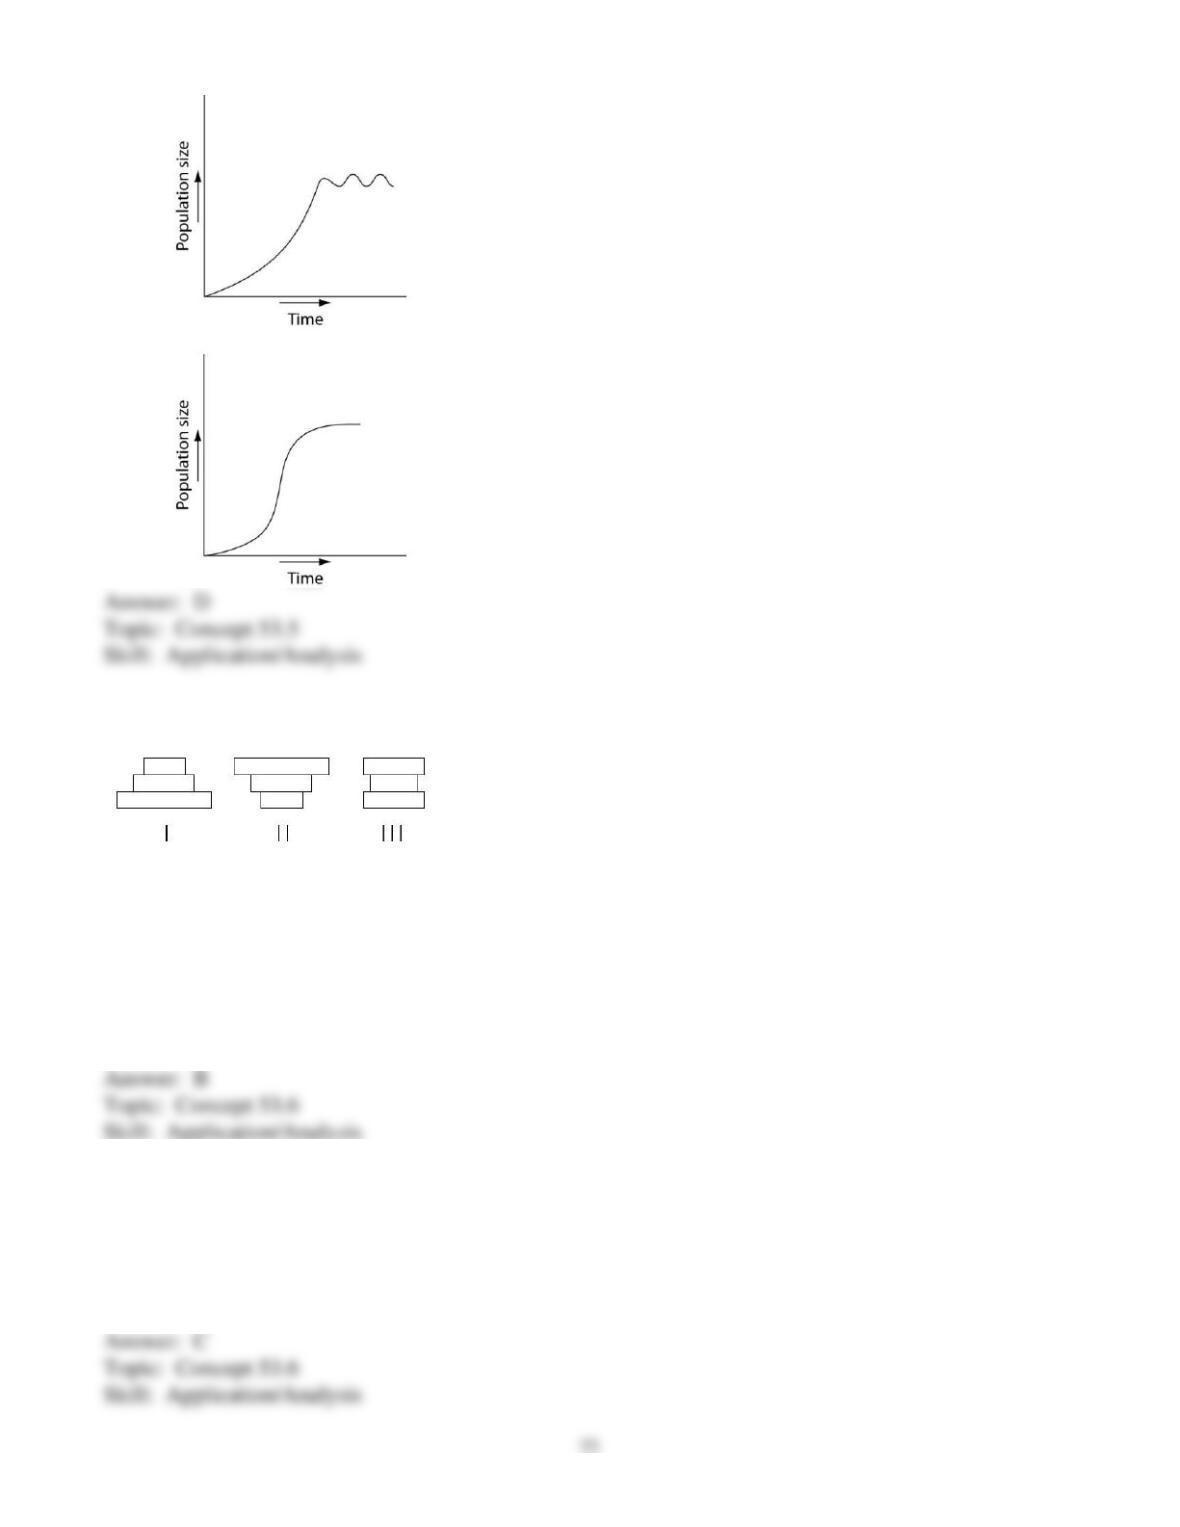
The following questions refer to Figure 53.3, which depicts the age structure of three populations.
Figure 53.3
61) Which population(s) is (are) in the process of decreasing?
A) I
B) II
C) III
D) I and II
E) II and III
62) Which population(s) appear(s) to be stable?
A) I
B) II
C) III
D) I and II
E) II and III

63) Assuming these age-structure diagrams describe human populations, in which population is
unemployment likely to be a societal issue in the future?
A) I
B) II
C) III
D) No differences in the magnitude of future unemployment would be expected among these
populations.
E) It is not possible to infer anything about future social conditions from age-structure diagrams.
64) Assuming these age-structure diagrams describe human populations, which population(s) is (are)
likely to experience zero population growth (ZPG)?
A) I
B) II
C) III
D) I and II
E) II and III
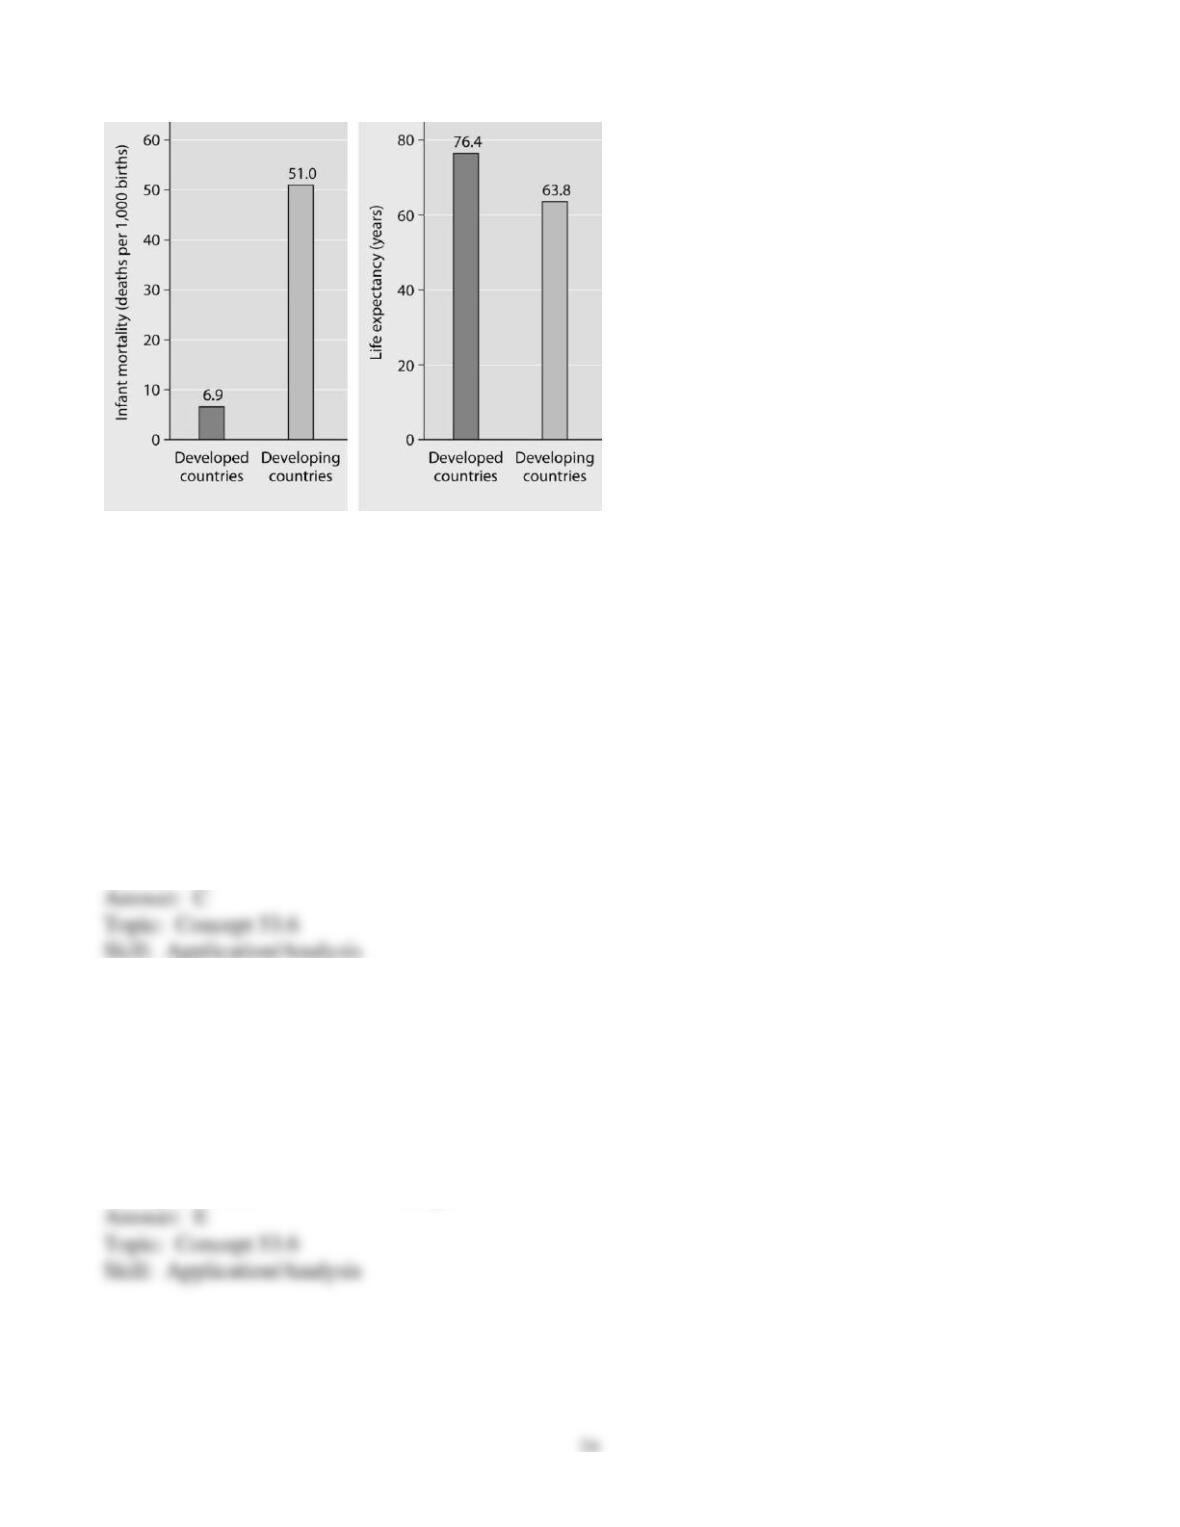
Refer to Figure 53.4 and then answer the following questions.
Figure 53.4: Infant mortality and life expectancy at birth in developed and developing countries
(data as of 2005).
65) What is a logical conclusion that can be drawn from the graphs above?
A) Developed countries have lower infant mortality rates and lower life expectancy than developing
countries.
B) Developed countries have higher infant mortality rates and lower life expectancy than developing
countries.
C) Developed countries have lower infant mortality rates and higher life expectancy than developing
countries.
D) Developed countries have higher infant mortality rates and higher life expectancy than developing
countries.
E) Developed countries have a life expectancy that is about 42 years more than life expectancy in
developing countries.
66) In terms of demographics, which country is likely to experience the greatest population growth
problem over the next ten years?
A) Mexico, because there are fewer pre-reproductive individuals in their population
B) China, whose population is more than a billion, but whose expected fertility rate is 1.8 children
C) Germany, where the growth rate of the population is 0.1% per year
D) United States (2009 population ~ 205,000,000, where 200,000 Americans are added to the population
each day)
E) Afghanistan, with a 3.85 annual growth rate

Scenario Questions
67) To measure the population of lake trout in a 250-hectare lake, 400 individual trout were netted and
marked with a fin clip, then returned to the lake. The next week, the lake was netted again, and out of
the 200 lake trout that were caught, 50 had fin clips. Using the capture-recapture estimate, the lake trout
population size could be closest to which of the following?
A) 160
B) 200
C) 400
D) 1,600
E) 80,000
68) Your friend comes to you with a problem. It seems his shrimp boats aren’t catching nearly as much
shrimp as they used to. He can’t understand why because he used to catch all the shrimp he could handle.
Each year he added a new boat, and for a long time each boat caught tons of shrimp. As he added more
boats, there came a time when each boat caught somewhat fewer shrimp, and now, each boat is catching
a lot less shrimp. Which of the following topics might help your friend understand the source of his
problem?
A) density-dependent population regulation and intrinsic characteristics of population growth
B) exponential growth curves and unlimited environmental resources
C) density-independent population regulation and chance occurrence
D) pollution effects of a natural environment and learned shrimp behavior
E) a K-selected population switching to an r-selected population
69) Imagine that you are managing a large game ranch. You know from historical accounts that a
species of deer used to live there, but they have been extirpated. You decide to reintroduce them. After
doing some research to determine what might be an appropriately sized founding population, you do so.
You then watch the population increase for several generations, and graph the number of individuals
(vertical axis) against the number of generations (horizontal axis). The graph will likely appear as
A) a diagonal line, getting higher with each generation.
B) an “S,” increasing with each generation.
C) an upside-down “U.”
D) a “J,” increasing with each generation.
E) an “S” that ends with a vertical line.

End-of-Chapter Questions
The following questions are from the end-of–chapter “Test Your Understanding” section in Chapter 53
of the textbook.
70) Population ecologists follow the fate of same-age cohorts to
A) determine a population’s carrying capacity.
B) determine the birth rate and death rate of each group in a population.
C) determine if a population is regulated by density-dependent processes.
D) determine the factors that regulate the size of a population.
E) determine if a population’s growth is cyclic.
71) A population’s carrying capacity
A) may change as environmental conditions change.
B) can be accurately calculated using the logistic growth model.
C) generally remains constant over time.
D) increases as the per capita growth rate (r) decreases.
E) can never be exceeded.
72) Scientific study of the population cycles of the snowshoe hare and its predator, the lynx, has
revealed that
A) the prey population is controlled by predators alone.
B) hares and lynx are so mutually dependent that each species cannot survive without the other.
C) multiple biotic and abiotic factors contribute to the cycling of the hare and lynx populations.
D) both hare and lynx populations are regulated mainly by abiotic factors.
E) the hare population is r-selected and the lynx population is K-selected.
73) Based on current growth rates, Earth’s human population in 2012 will be closest to
A) 2 million.
B) 3 billion.
C) 4 billion.
D) 7 billion.
E) 10 billion.

74) A recent study of ecological footprints concluded that
A) Earth’s carrying capacity for humans is about 10 billion.
B) Earth’s carrying capacity would increase if per capita meat consumption increased.
C) current demand by industrialized countries for resources is much smaller than the ecological footprint
of those countries.
D) it is not possible for technological improvements to increase Earth’s carrying capacity for humans.
E) the ecological footprint of the United States is large because per capita resource use is high.
75) The observation that members of a population are uniformly distributed suggests that
A) the size of the area occupied by the population is increasing.
B) resources are distributed unevenly.
C) the members of the population are competing for access to a resource.
D) the members of the population are neither attracted to nor repelled by one another.
E) the density of the population is low.
76) According to the logistic growth equation
dN
dt
= rmaxN
()KN
K
−
A) the number of individuals added per unit time is greatest when N is close to zero.
B) the per capita growth rate (r) increases as N approaches K.
C) population growth is zero when N equals K.
D) the population grows exponentially when K is small.
E) the birth rate (b) approaches zero as N approaches K.
77) Which pair of terms most accurately describes life history traits for a stable population of wolves?
A) semelparous; r-selected
B) semelparous; K-selected
C) iteroparous; r-selected
D) iteroparous; K-selected
E) iteroparous; N-selected

78) During exponential growth, a population always
A) grows by thousands of individuals.
B) grows at its maximum per capita rate.
C) quickly reaches its carrying capacity.
D) cycles through time.
E) loses some individuals to emigration.
79) Which of the following statements about human population in industrialized countries is incorrect?
A) Life history is r-selected.
B) Average family size is relatively small.
C) The population has undergone the demographic transition.
D) The survivorship curve is Type I.
E) Age distribution is relatively uniform.