Chapter 5
True-False
1. The first step in a financial statement analysis is to calculate ratios.
2. Before beginning the analysis of a firm’s financial statements, it is necessary to
specify the objectives of the analysis.
3. A creditor is ultimately concerned with the ability of the borrower to make
interest and principal payments on borrowed funds.
4. The investor attempts to arrive at an estimation of a company’s future earnings
stream in order to attach a value to the securities being considered for purchase or
liquidation.
5. Financial statement analysis from the standpoint of management does not relate
to the same questions raised by investors and creditors.
6. Sources of information outside the company’s annual report should not be relied
upon in a financial statement analysis.
7. Sources of information for analysts include the Form 10-K, proxy statement,
auditor’s report, and management discussion and analysis.
8. Using comparative statistical ratios to help determine a company’s relative
position within its industry is misleading due to the many accounting choices and
techniques firms choose to report information.
9. Tools and techniques used to evaluate a firm’s financial condition should
include common size financial statements, financial ratios, trend and structural
analysis and industry comparisons.
10. Financial ratios do not provide answers in and of themselves, and they are not
predictive.
11. Liquidity ratios measure the extent of a firm’s financing with debt relative to
equity.
12. The current and quick ratios measure the short-run solvency of a firm.
13. The current and quick ratio may contradict the cash flow liquidity ratio,
requiring the analyst to explore the underlying components of each ratio.
14. An increasing average collection period implies the firm has tightened its credit
policies.
15. A low number of days inventory held is usually a sign of efficient
management; however, too low a number could indicate understocking and lost
orders.
16. To improve the cash conversion cycle a firm would want to decrease the
average collection period, decrease days inventory held and increase days payable
outstanding.
17. The smaller the fixed asset turnover ratio is the lower the investment in
property, plant and equipment.
18. In order for a firm to benefit from debt financing, the fixed interest payments
must be greater than the operating earnings.
19. The cash interest coverage ratio can be misleading if a company generates high
profits, but no cash flow from operations.
20. Cash flow ratios add to a financial statement analysis by ensuring that profits
are being translated into cash flows.
21. The accounting and finance scandals, including Lehman Brothers, Enron, and
WorldCom, illustrated the importance to investors of earnings numbers and market
ratios based on those earnings numbers.
22. Short-term liquidity focuses on assessment of the key components of the
income statement.
23. An upward trend in asset turnover ratios indicates improved operating
efficiency.
24. When the financial leverage index is less than one, this indicates the firm is
employing debt beneficially.
25. The Du Pont System helps the analyst see how a firm’s decisions and activities
over an accounting period interact to produce an overall return to the firm’s
shareholders, the return on equity.
Multiple Choice
1. Which of the following items is an outside source of information from the
corporate annual report?
a. Auditor’s report.
b. Supplementary schedule of segment information.
c. Comparative statistical ratios from Annual Statement Studies.
d. Management’s discussion and analysis.
2. Which of the following tools and techniques are the least useful to the financial
statement analyst?
a. Financial ratios.
b. Public relations material and pro forma statements prepared by the firm.
c. Trend and structural analysis.
d. Common size financial statements.
3. What type of ratios measure the firm’s ability to meet cash needs as they arise?
a. Activity ratios.
b. Liquidity ratios.
c. Leverage ratios.
d. Profitability ratios.
4. What type of ratios measure the liquidity of specific assets and the efficiency of
managing those assets?
a. Activity ratios.
b. Liquidity ratios.
c. Leverage ratios.
d. Profitability ratios.
5. What type of ratios measure the extent of a firm’s financing with debt relative
to equity and its ability to cover interest and fixed charges?
a. Activity ratios.
b. Liquidity ratios.
c. Market ratios.
d. Leverage ratios.
6. Which of the following statements is false?
a. Financial ratios can indicate areas of potential strength and weakness.
b. Financial ratios can serve as screening devices.
c. Financial ratios are predictive.
d. No rules of thumb apply to the interpretation of financial ratios.
7. Which of the following ratios would be useful in assessing short-term liquidity?
a. Current ratio, inventory turnover, fixed asset turnover.
b. Quick ratio, average collection period, cash conversion cycle.
c. Average collection period, debt ratio, return on assets.
d. Current ratio, cash interest coverage, cash-flow liquidity ratio.
8. What relationship exists between the average collection period and accounts
receivable turnover?
a. There is a direct and proportional relationship.
b. Both ratios are expressed in number of times receivables are collected per
year.
c. Both ratios are expressed in number of days.
d. As average collection period increases (decreases) the accounts receivable
turnover decreases (increases).
9. What is the cash conversion or net trade cycle?
a. The amount of time needed to complete the normal operating cycle of a
firm.
b. The amount of time it takes to manufacture or buy inventory.
c. The amount of time it takes to sell inventory.
d. The amount of time it takes to be profitable.
10. If a firm is using financial leverage successfully what would be the impact of
doubling operating earnings?
a. The return on equity will double.
b. The return on equity will increase, but not double.
c. The return on equity will more than double.
d. The return on equity will decline by half.
Use the following data to answer questions 11-15.
Lazy O Corporation
Selected Financial Data
Current assets $85,000
Current liabilities 70,000
Accounts receivable 35,000
Inventories 40,000
Accounts payable 25,000
Net sales 425,000
Cost of goods sold 258,000
11. Lazy O’s current ratio is:
a. 2.1 to 1
b. 0.1 to 1
c. 0.8 to 1
d. 1.2 to 1
12. Lazy O’s quick ratio is:
a. 0.88 to 1
b. 0.64 to 1
c. 1.2 to 1
d. 0.71 to 1
13. Lazy O’s average collection period is:
a. 30 days
b. 24 days
c. 12 days
d. 4 days
14. Lazy O’s days inventory held is:
a. 34 times
b. 9 times
c. 57 times
d. 18 times
15. Lazy O’s net trade cycle is:
a. 122 days
b. 52 days
c. 35 days
d. 72 days
Use the following selected financial data for Crazy A Corporation to answer
questions 16-20.
Net sales $500,000
Cost of goods sold 300,000
Operating expenses 100,000
Net income 30,000
Total assets 180,000
Total liabilities 120,000
Cash flow from operating activities 10,000
16. Crazy A’s debt ratio is:
a. 8%
b. 60%
c. 67%
d. 150%
17. Crazy A’s cash flow margin is:
a. 2.0%
b. 16.7%
c, 5.5%
d. 33.0%
18. Crazy A’s operating profit margin is:
a. 33%
b. 20%
c. 40%
d. 55%
19. Crazy A’s return on equity is:
a. 25%
b. 40%
c. 50%
d. 33%

20. Crazy A’s net profit margin is:
a. 2.5%
b. 5.5%
c. 2.0%
d. 6.0%
Use the following selected financial information for Cascabel Corporation to
answer questions 21-30. Cascabel Corporation
Balance Sheet
December 31, 2012
Assets Liabilities and stockholders’ equity
Current assets Current liabilities
Cash 2 Accounts payable 36
Short-term investments 10 Accrued liabilities 25
Accounts receivable 52 Total current liabilities 61
Inventory 57 Deferred income taxes 20
Other current assets 8 Long-term debt 82
Total current assets 129 Total liabilities 163
Long-term assets Stockholders’ equity
Net PPE 65 Common stock and PIC 110
Goodwill 130 Retained earnings 51
Total stockholders’ equity 161
Total assets 324 Total liabilities and equity 324
Cascabel Corporation
Income Statement
For the Year Ended December 31, 2012
Net sales $345
Cost of goods sold 248
Gross profit $ 97
Operating expenses 74
Operating profit $ 23
Interest expense 8
Earnings before taxes $ 15
Income tax expense 4
Net profit $ 11
Cascabel Corporation
Statement of Cash Flow Information
For the Year Ended December 31, 2012
Cash from operating activities $20
Investing activities:
Capital expenditures $25
Acquisitions $ 9
Financing activities:
Proceeds from long-term borrowing $12
Payments on long-term borrowing $31
Payments of cash dividends $ 6
Cash paid for interest $ 9
Cash paid for income taxes $ 5
21. Cascabel’s current ratio is:
a. .47
b. 2.11
c. 1.18
d. 1.79
22. Cascabel’s cash flow liquidity ratio is:
a. .52
b. .36
c. 1.91
d. .33
23. Cascabel’s cash conversion cycle is:
a. 82 days
b. 24 days
c. 192 days
d. 86 days
24. Cascabel’s fixed asset turnover ratio is:
a. 5.31
b. .19
c. 5.91
d. .17
25. Cascabel’s cash interest coverage ratio is:
a. 2.50
b. 3.50
c. 3.78
d. 4.50
26. Cascabel’s cash flow adequacy ratio is:
a. 3.10
b. .32
c. .28
d. .21
27. Cascabel’s operating profit margin is:
a. 5.80%
b. 4.35%
c. 3.19%
d. 6.67%
28. Cascabel’s effective tax rate is:
a. 26.67%
b. 36.36%
c. 35.00%
d. 33.33%
29. Cascabel’s cash flow margin is:
a. 1.81%
b. .58%
c. 5.80%
d. 3.48%
30. Cascabel’s cash return on assets is:
a. 0.62%
b. 15.5%
c. 6.17%
d. 10.49%
Short Answer/Problem
1. a. What is the objective of financial statement analysis from the standpoint of a
creditor?
b. What sources of information are available to creditors when analyzing a firm?
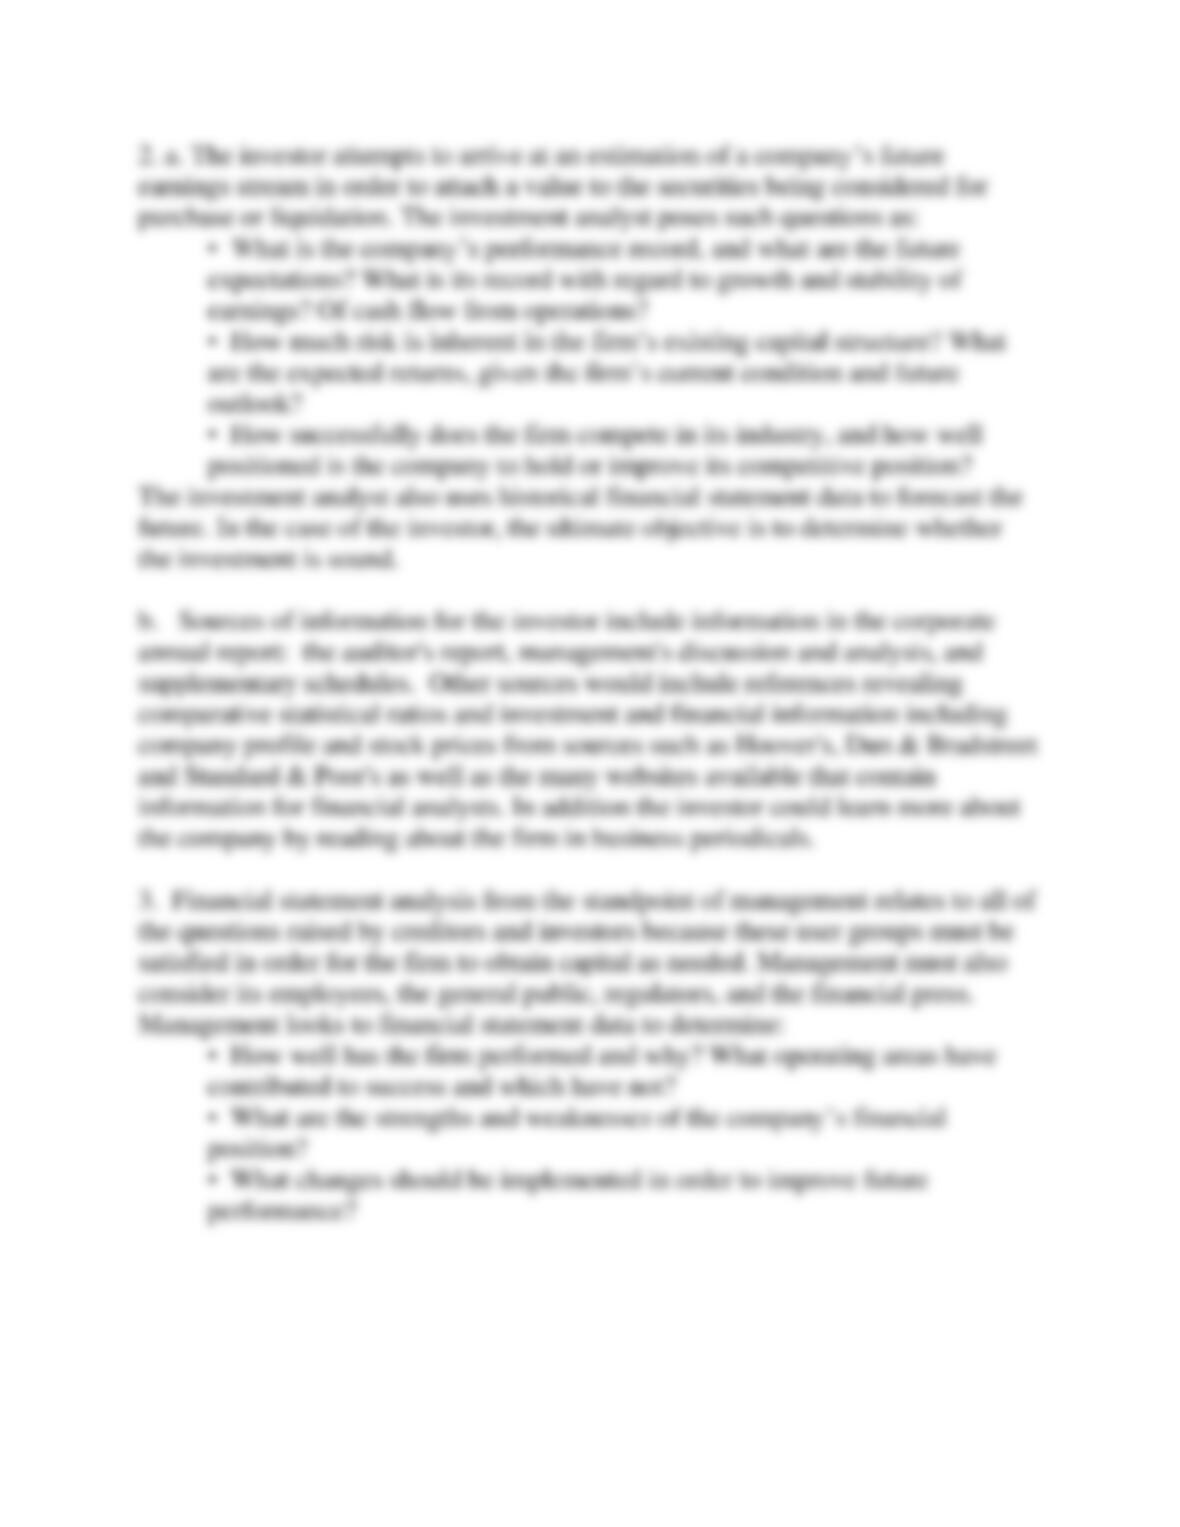
2. a. What is the objective of financial statement analysis from the standpoint of
an investor?
b. What sources of information are available to investors when analyzing a firm?
3. How does the objective of a financial statement analysis for management differ
from an analysis done by creditors and investors?
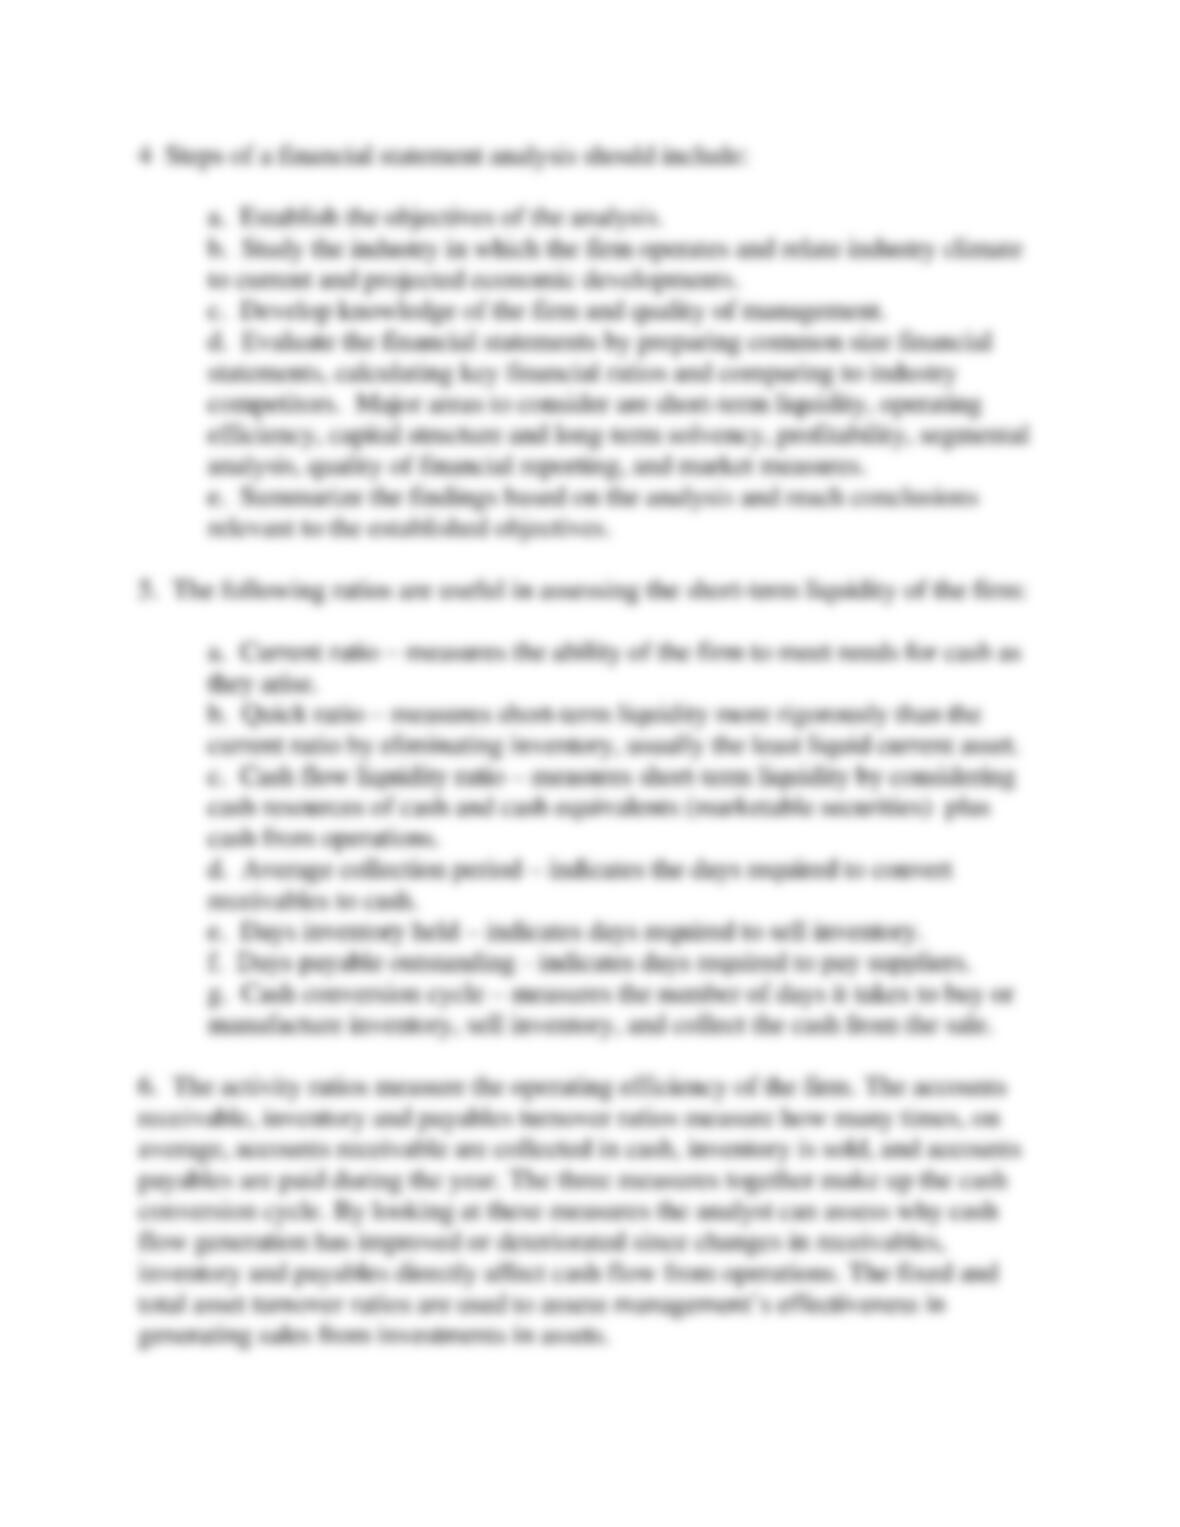
4. Describe the steps of conducting a financial statement analysis.
5. List and describe the ratios which should be assessed when looking at the short-
term liquidity of a firm.
6. Explain the importance of analyzing the activity ratios.
7. What should the analyst assess when analyzing capital structure and long-term
solvency?
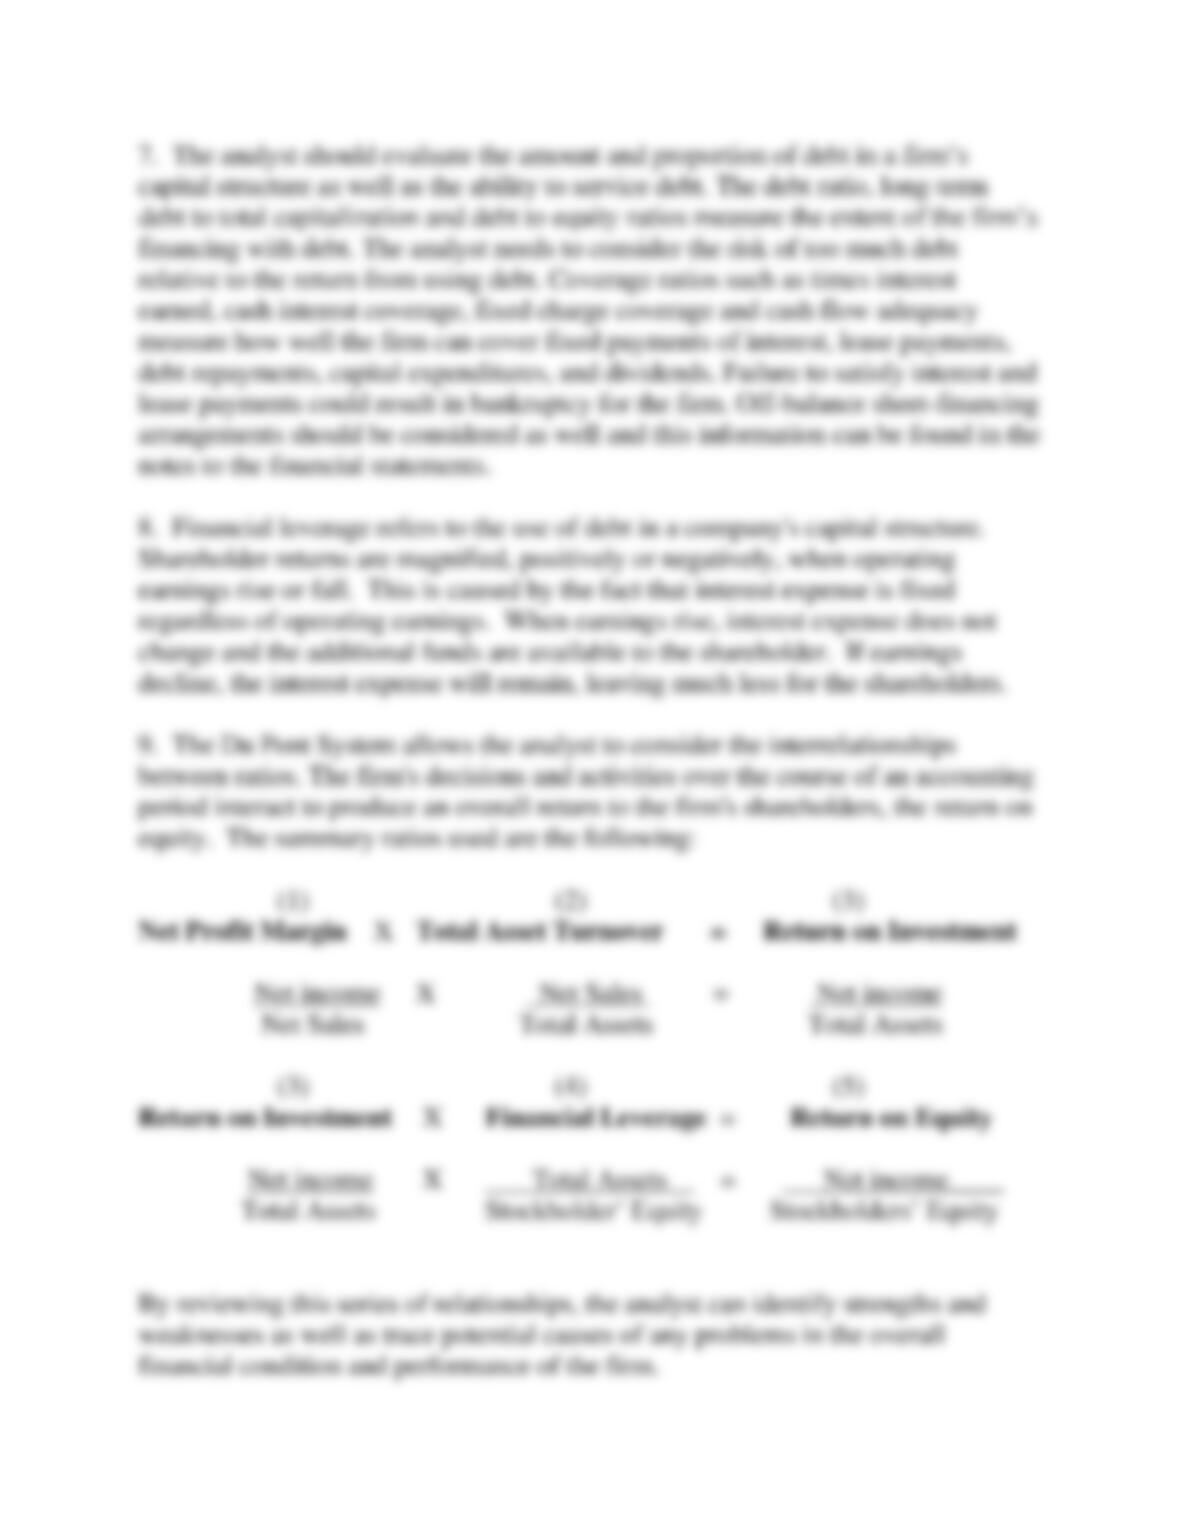
8. Explain why shareholder returns are magnified when financial leverage is used
and operating earnings rise or fall.
9. Explain how the Du Pont System can help the analyst.

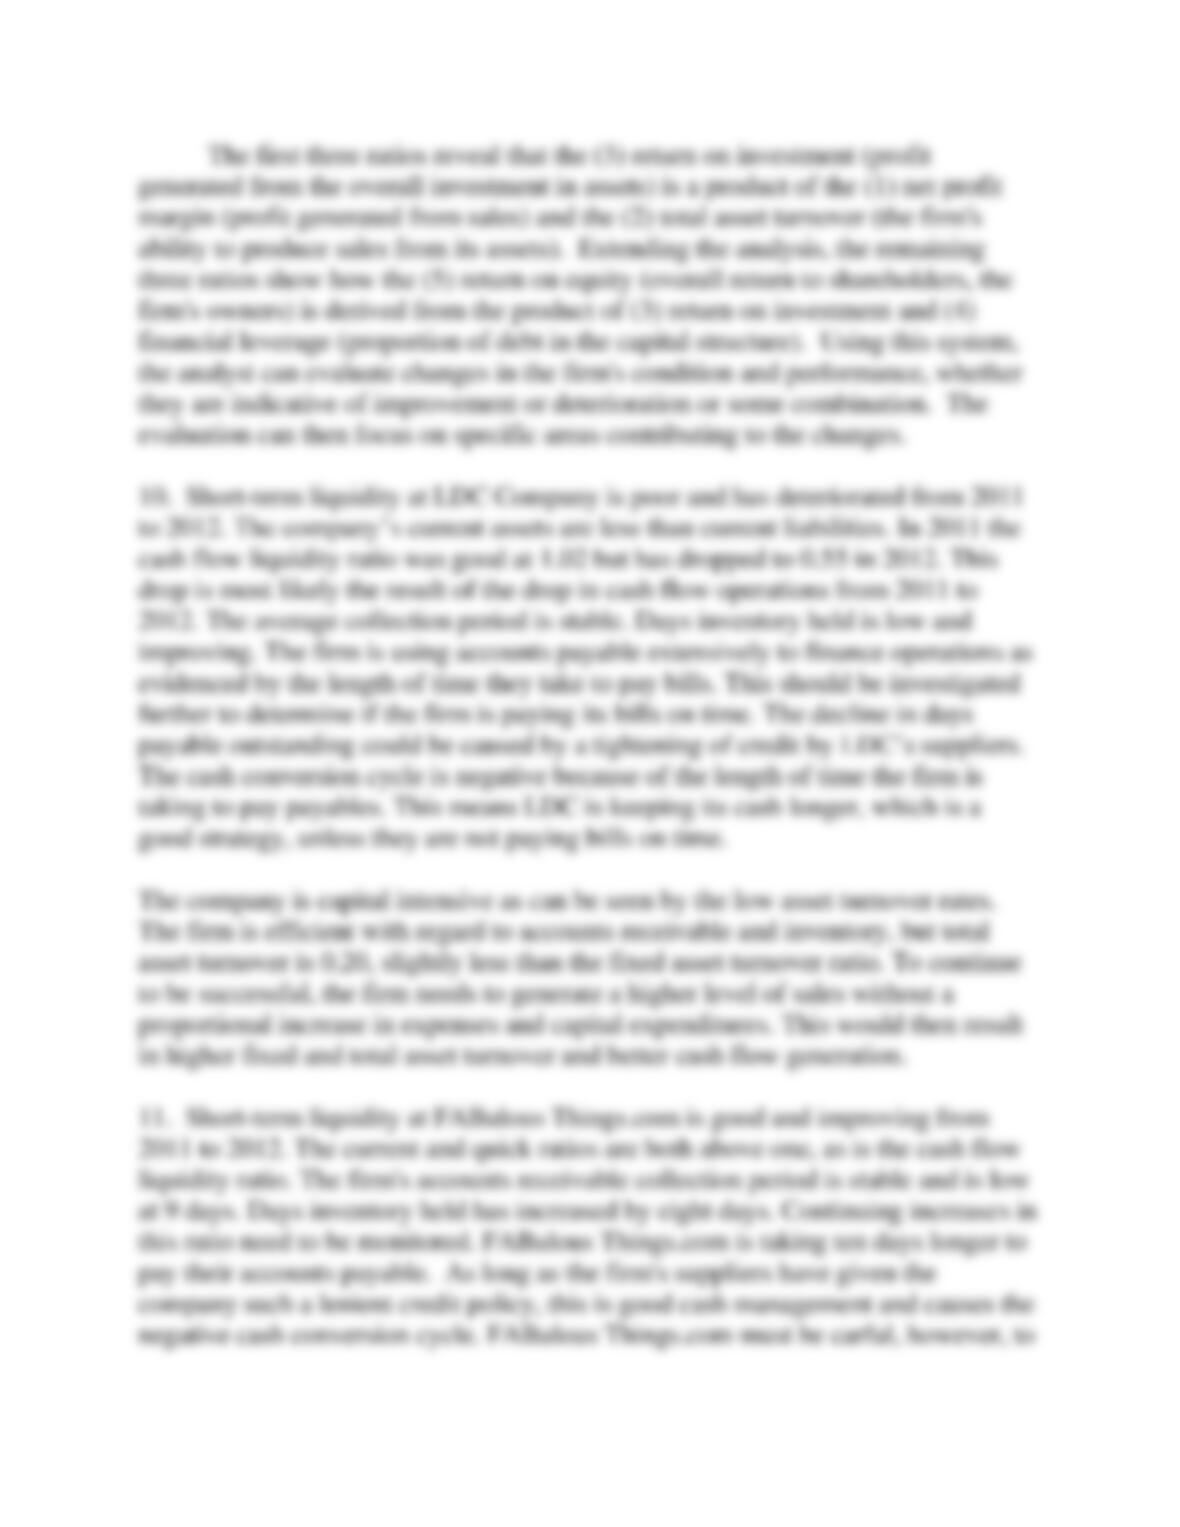
10. Using the ratios and information given below for LDC Company, analyze the
short-term liquidity and operating efficiency of the firm.
2012 2011
Current ratio .70 .80
Quick ratio .62 .71
Cash flow liquidity ratio .55 1.02
Average collection period 30 days 30 days
Days inventory held 10 days 12 days
Days payable outstanding 91days 98 days
Cash conversion cycle (51 days) (56 days)
Fixed asset turnover .29 times .27 times
Total asset turnover .20 times .21 times
Cash flow from operations (in millions) $613 $1,254
Net sales (in millions) $9,144 $8,611
11. Using the ratios and information given for FABulous Things.com, an Internet
retailer, analyze the short-term liquidity and operating efficiency of the firm as of
2012.
Financial ratios
2012
2011
Liquidity
Current (times)
1.48
1.35
Quick (times)
1.07
1.02
Cash flow liquidity (times)
1.32
1.23
Average collection period
9 days
9 days
Days inventory held
35 days
27 days
Days payable outstanding
85 days
75 days
Cash conversion cycle
(41 days)
(39 days)
Activity
Fixed asset turnover (times)
30.45
28.25
Total asset turnover (times)
2.42
2.63
Other information
Cash flow from operations
(millions of $)
602
412
Revenues (millions of $)
7,158
5,369

12. The following ratios have been calculated for Western Airlines. Analyze the
capital structure, long-term solvency, and profitability of Western Airlines.
Financial ratios
2012
2011
Leverage
Debt ratio (%)
80.3
79.2
Long-term debt to total capital (%)
70.1
69.8
Debt to equity (times)
4.2
4.1
Times interest earned (times)
1.6
0.8
Cash interest coverage (times)
3.9
2.7
Fixed charge coverage (times)
1.0
0.7
Cash flow adequacy (times)
0.4
1.1
Profitability
Gross profit margin (%)
13.5
12.3
Operating profit margin (%)
1.4
0.9
Net profit margin (%)
(1.3)
(2.8)
Cash flow margin (%)
8.4
5.2
Return on assets (%)
(0.6)
(1.9)
Return on equity (%)
(4.1)
(9.9)
Cash return on assets (%)
9.8
7.6
13. Sally Gordon, owner of dance studios, is wondering why her bookkeeper
keeps complaining that it is difficult to pay the bills on time. Sally has looked at
her income statement and can’t figure out what the problem is. Looking at the
following ratios for the company, write an explanation that will help Sally
understand the challenges her firm is facing.
2012 2011
Debt ratio 72% 58%
Long-term debt to total capitalization 49% 24%
Times interest earned 6.9 times 3.4 times
Cash interest coverage (2.6 times) 1.5 times
Fixed charge coverage 6.0 times 3.2 times
Cash flow adequacy (5.1 times) .4 times

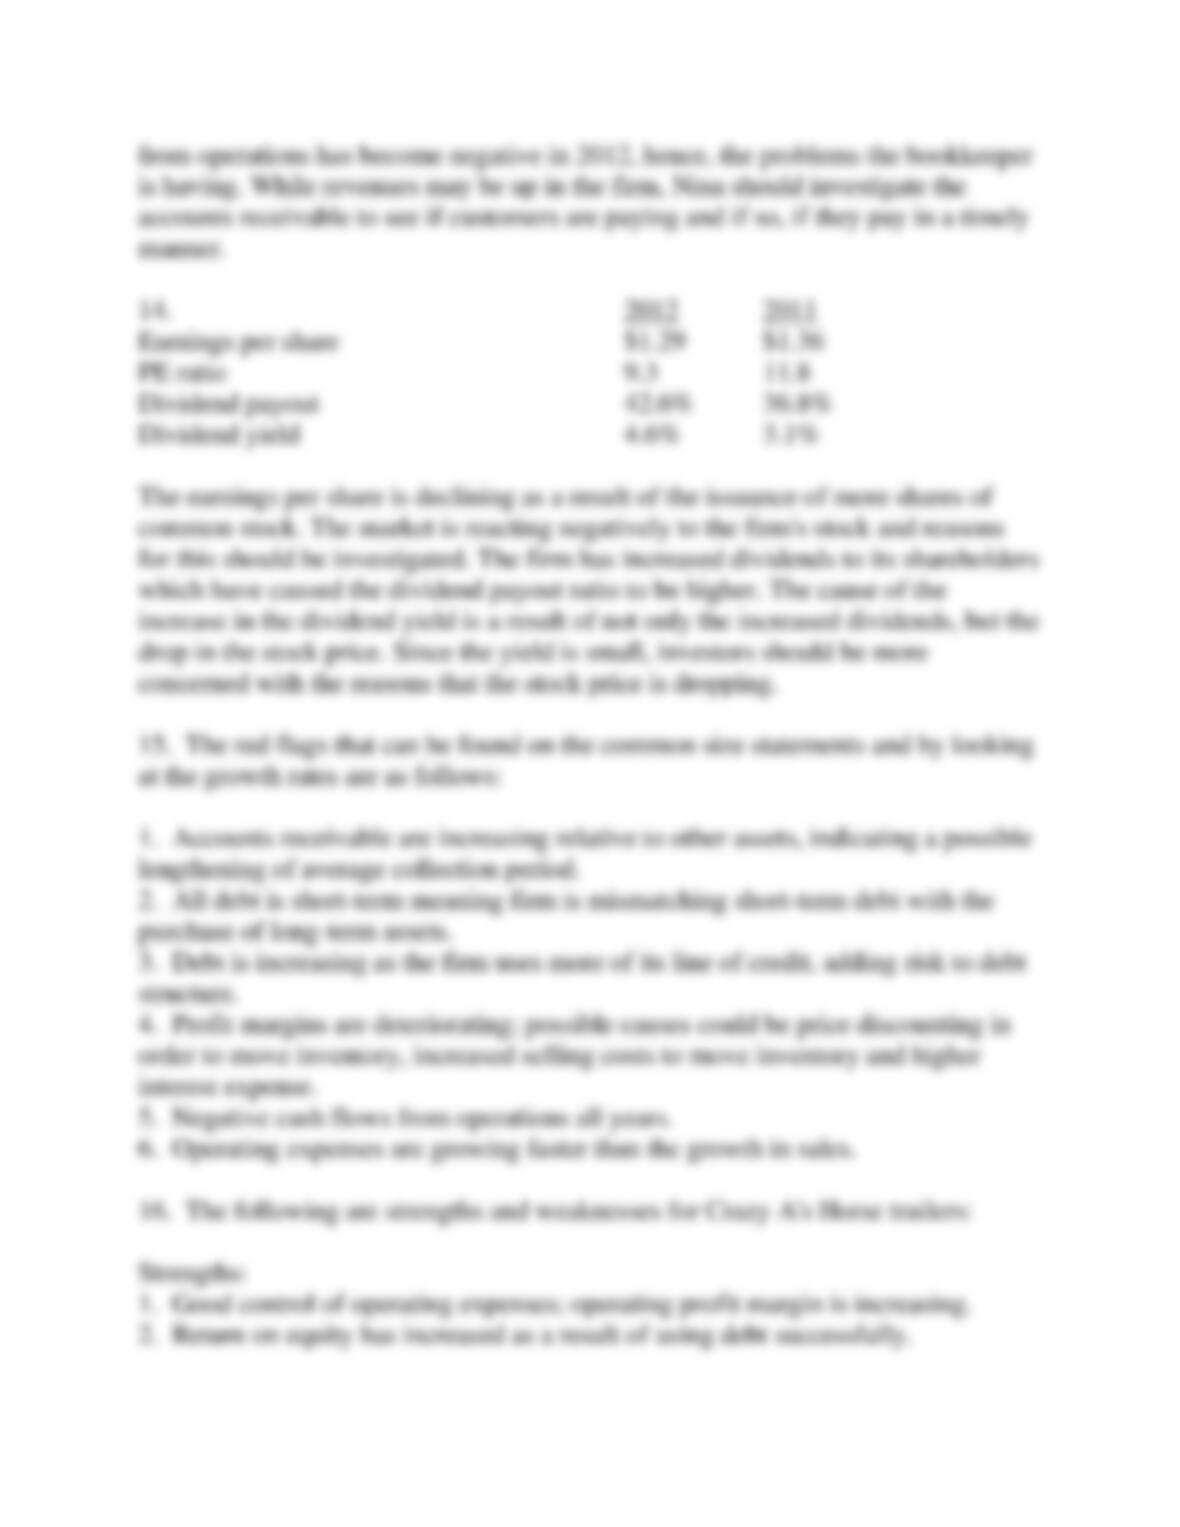
14. Using the following information for Cedric Inc. calculate earnings per share,
the price-to earnings ratio, dividend payout and dividend yield for the firm.
Analyze these market ratios.
2012 2011
Net income $31 million $30 million
Shares of common stock outstanding 24 million 22 million
Dividends per share $ 0.55 $ 0.50
Market price per share $12 $16
15. L.A. Gear, a designer and marketer of athletic and casual footwear, filed for
bankruptcy in 1998; however red flags existed long before the firm went bankrupt.
Using the information from the common size financial statements and growth rates
given, discuss the red flags that existed as early as 1990.
Balance Sheet
1990
1989
%
%
Cash
.9
.1
A/R
43.0
37.6
Inventory
44.1
52.3
Ppd. exp., def. taxes, other
4.9
6.5
Total current assets
92.9
96.5
Net property and equipment
6.5
3.0
Other assets
.6
.5
Total assets
100.0
100.0
Line of credit
25.8
14.0
A/P
6.1
9.6
Accrued expenses
11.5
13.0
Taxes payable
—
.3
Total current liabilities
43.4
36.9
Common stock
25.1
31.8
Retained earnings
31.5
31.3
Total liabilities and shareholders’ equity
100.0
100.0

Income Statement
1990
1989
1988
%
%
%
Net sales
100.0
100.0
100.0
Cost of sales
65.6
58.1
57.7
Gross profit
34.4
41.9
42.3
Selling, general and admin. exp.
26.7
25.0
23.8
Interest expense
2.0
2.0
1.8
Earnings before income taxes
5.7
14.9
16.7
Income taxes
2.2
6.0
6.9
Net earnings
3.5
8.9
9.8
Statement of Cash Flows
1990
1989
1988
Inflows:
$
$
$
Exercise of stock options and
related tax benefits
6,316
2,681
495
Issuance of common stock
—
68,616
—
Borrowings
56,600
—
50,104
Total
62,916
71,297
50,599
Outflows:
Operations
40,332
48,905
46,687
Capital expenditures
18,939
6,168
2,546
Other assets
707
246
406
Repayments of debt
—
19,830
—
Total
59,978
75,149
49,639
Net cash flow
2,938
(3,852)
960

Statement of Cash Flows
1990
1989
1988
%
%
%
Inflows:
Exercise of stock options and
related tax benefits
10.0
3.8
1.0
Issuance of common stock
—
96.2
—
Borrowings
90.0
—
99.0
Total
100.0
100.0
100.0
Outflows:
Operations
67.2
65.1
94.1
Capital expenditures
31.6
8.2
5.1
Other assets
1.2
.3
.8
Repayments of debt
—
26.4
—
Total
100.0
100.0
100.0
89–90
88–89
Sales growth
46%
176%
Operating expense growth
56%
190%

16. Financial ratio data is listed below for Crazy A’s Horse Trailers. Construct a
list of strengths and weaknesses for the firm after analyzing the ratios.
Crazy A’s Horse Trailers
Ratios
Ratio
Industry
2012
2011
2010
Current
1.20x
1.18x
1.20x
1.35x
Quick
0.20x
0.18x
0.21x
0.26x
Cash Flow Liquidity
0.50x
(0.11x)
(0.09x)
(0.05x)
Average Collection Period
4 days
9 days
8 days
6 days
Days Inventory Held
75 days
106 days
99 days
90 days
Days payable outstanding
10 days
11 days
12 days
8 days
Fixed Asset Turnover
11.30x
8.84x
8.89x
8.95x
Total Asset Turnover
2.50x
2.20x
2.27x
2.42x
Debt Ratio
75.10%
78.47%
76.04%
70.17%
Long Term Debt to
Total Capitalization
29.30%
41.09%
36.91%
35.33%
Debt to Equity
3.50x
3.65x
3.17x
2.35x
Times Interest Earned
2.40x
1.72x
2.00x
2.23x
Fixed Charge Coverage
1.50x
1.59x
1.77x
1.85x
Gross Profit Margin
23.10%
21.21%
22.39%
23.52%
Operating Profit Margin
2.00%
3.05%
2.86%
2.52%
Net Profit Margin
1.10%
0.89%
1.00%
0.97%
Cash Flow Margin
4.30%
(5.31%)
(5.15%)
(4.48%)
Return on Investment
2.75%
1.97%
2.28%
2.35%
Return on Equity
11.04%
9.14%
9.51%
7.88%
17. Using the financial ratios calculated from the 2012 annual report of Maggie’s
Crafts, assess the short-term liquidity, operating efficiency, capital structure and
long-term solvency and profitability of the firm.

Liquidity Ratios:
Current ratio 7.47 times 5.19 times
Quick ratio 2.84 times 1.99 times
Cash flow liquidity 2.48 times 1.98 times
Average collection period 17 days 18 days
Days inventory held 270 days 266 days
Days payable outstanding 24 days 28 days
Cash conversion cycle 263 days 256 days
Activity Ratios:
Accounts receivable turnover 21.79 times 21.24 times
Inventory turnover 1.35 times 1.37 times
Payables turnover 15.79 times 13.26 times
Fixed asset turnover 7.90 times 29.41 times
Total asset turnover 1.47 times 1.73 times
Leverage Ratios:
Debt ratio 20.81 % 17.53 %
Long–term debt to total capitalization 11.61 % 0.00 0
Debt to equity 0.26 times 0.21 times
Financial leverage (FL) 1.26 times 1.21 times
Times interest earned 36.91 times 0.00 0 1748.25 times
Cash interest coverage 36.81 times 0.00 0 1095.70 times
Fixed charge coverage 2.56 times 3.83 times 3.50 times
Cash flow adequacy 1.49 times 8.29 times 5.63 times
Profitability Ratios:
Gross profit margin 57.26 % 57.31 % 56.69 %
Operating profit margin 8.15 % 12.80 % 10.99 %
Net profit margin 5.58 % 8.65 % 7.32 %
Cash flow margin 4.60 % 7.09 % 3.03 %
Return on assets (ROA)
or Return on investment (ROI)
8.20 % 14.97 %
Return on equity (ROE) 10.36 % 18.15 %
Cash return on assets 6.76 % 12.26 %
Market Ratios:
Earnings per share 0.28$ 0.44$ 0.35$
Price-to-earnings 11.68 018.34 019.57 0
Dividend payout 0.00 0 0.00 0 0.00 0
Dividend yield 0.00 0 0.00 0 0.00 0
NOTES: If a ratio’s numerator and/or denominator equals zero, no ratio is displayed.
“N/M” indicates a calculated ratio is not meaningful for analysis
Maggie‘s Crafts (TLF / AMEX)
Summary of Financial Statement Ratios
Results for the Years Ending December 31
2012
2011
2010
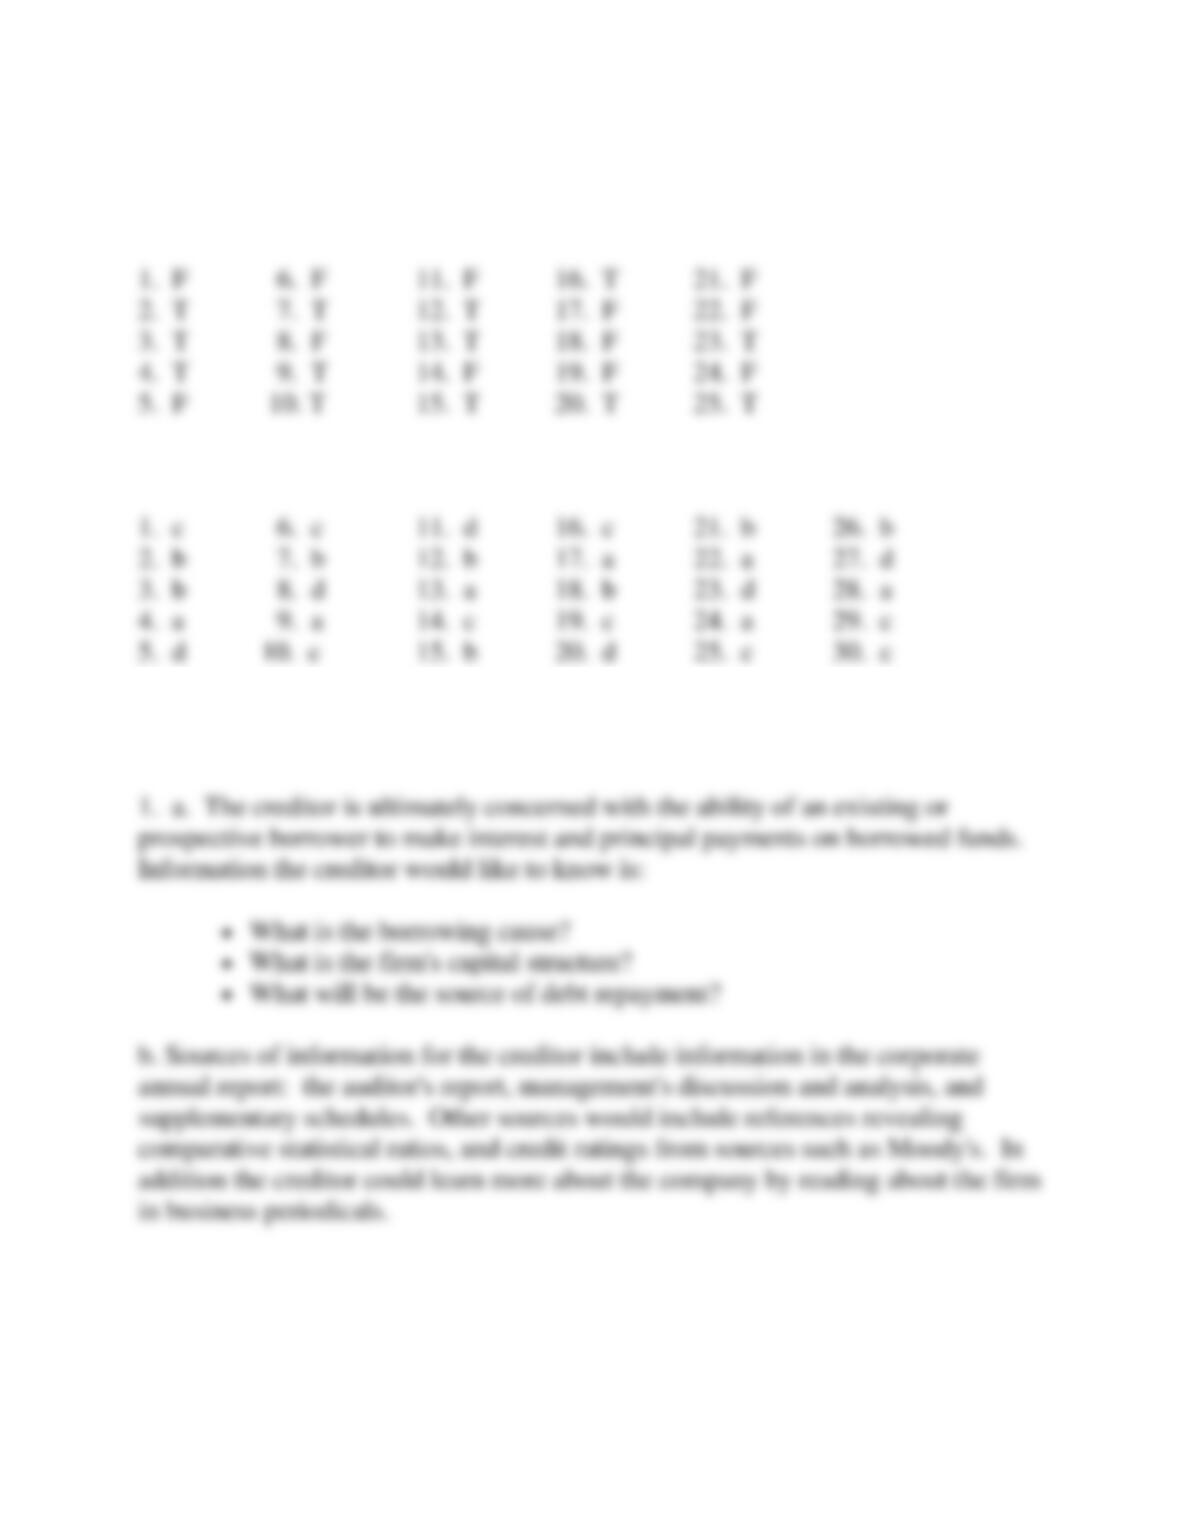
Solutions – Chapter 5
True-False
Multiple Choice
Short Answer/Problem