Chapter 05 – Cost-Volume-Profit Relationships
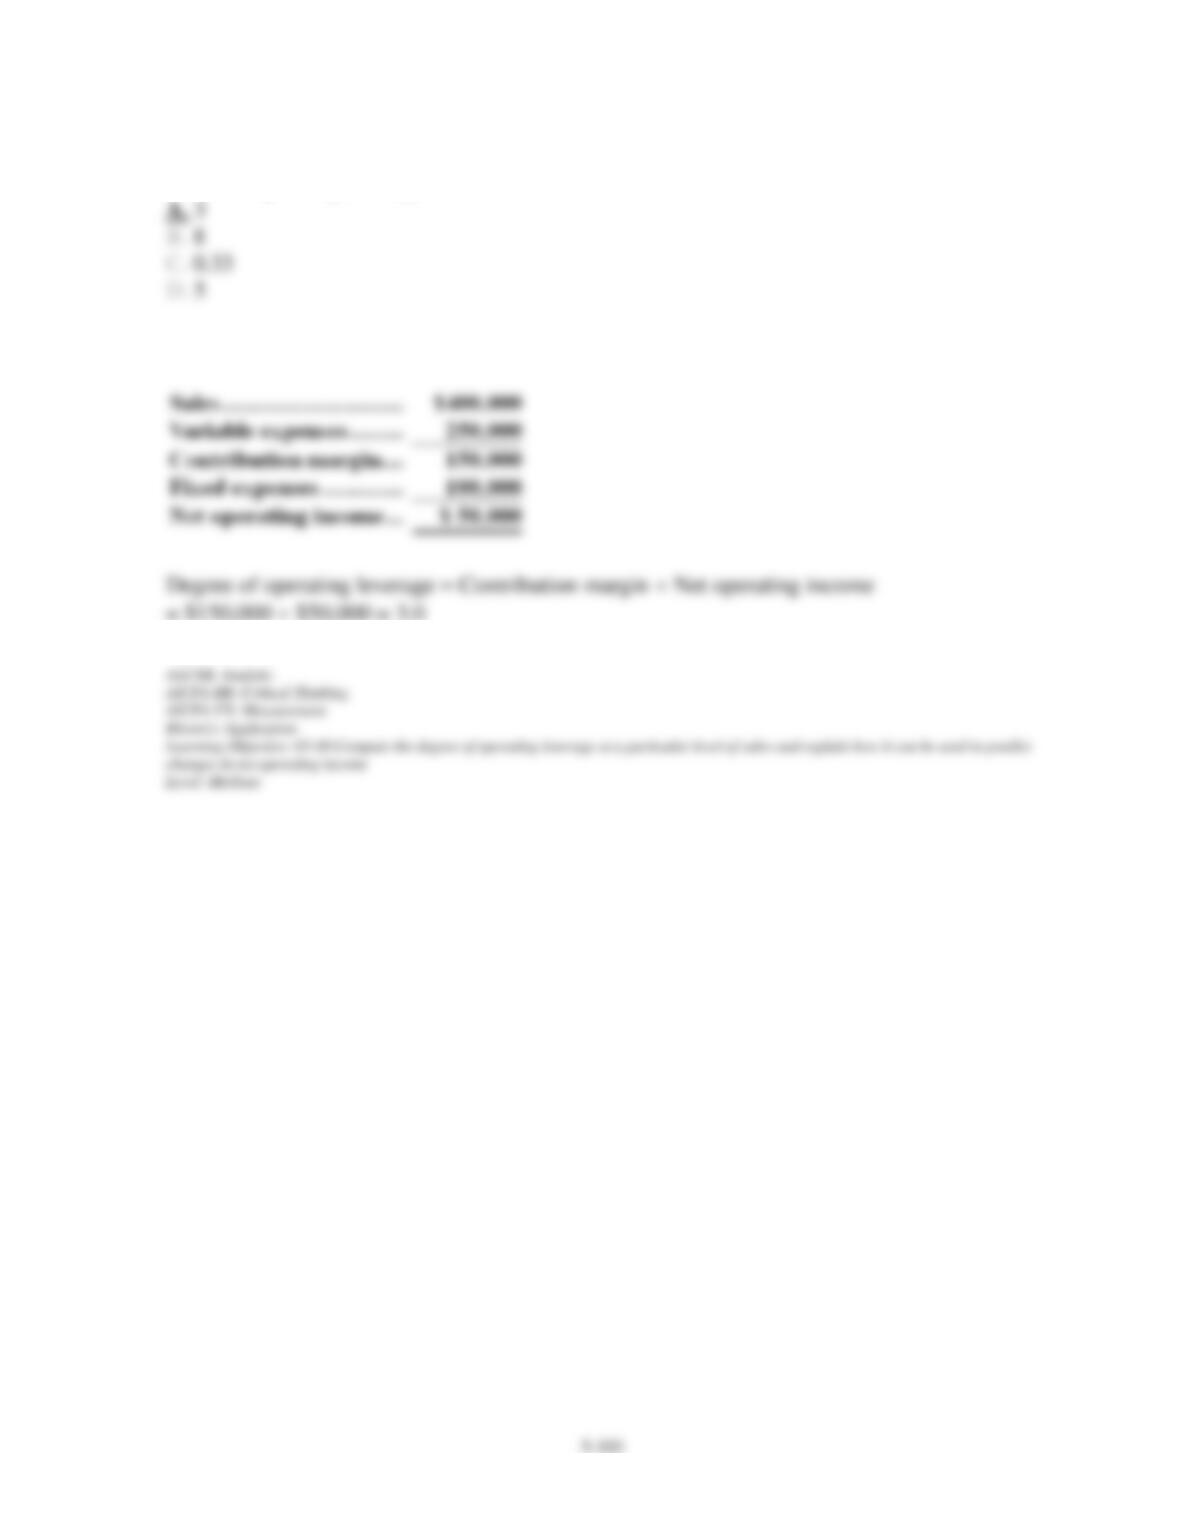
137. The operating leverage is:
Chapter 05 – Cost-Volume-Profit Relationships
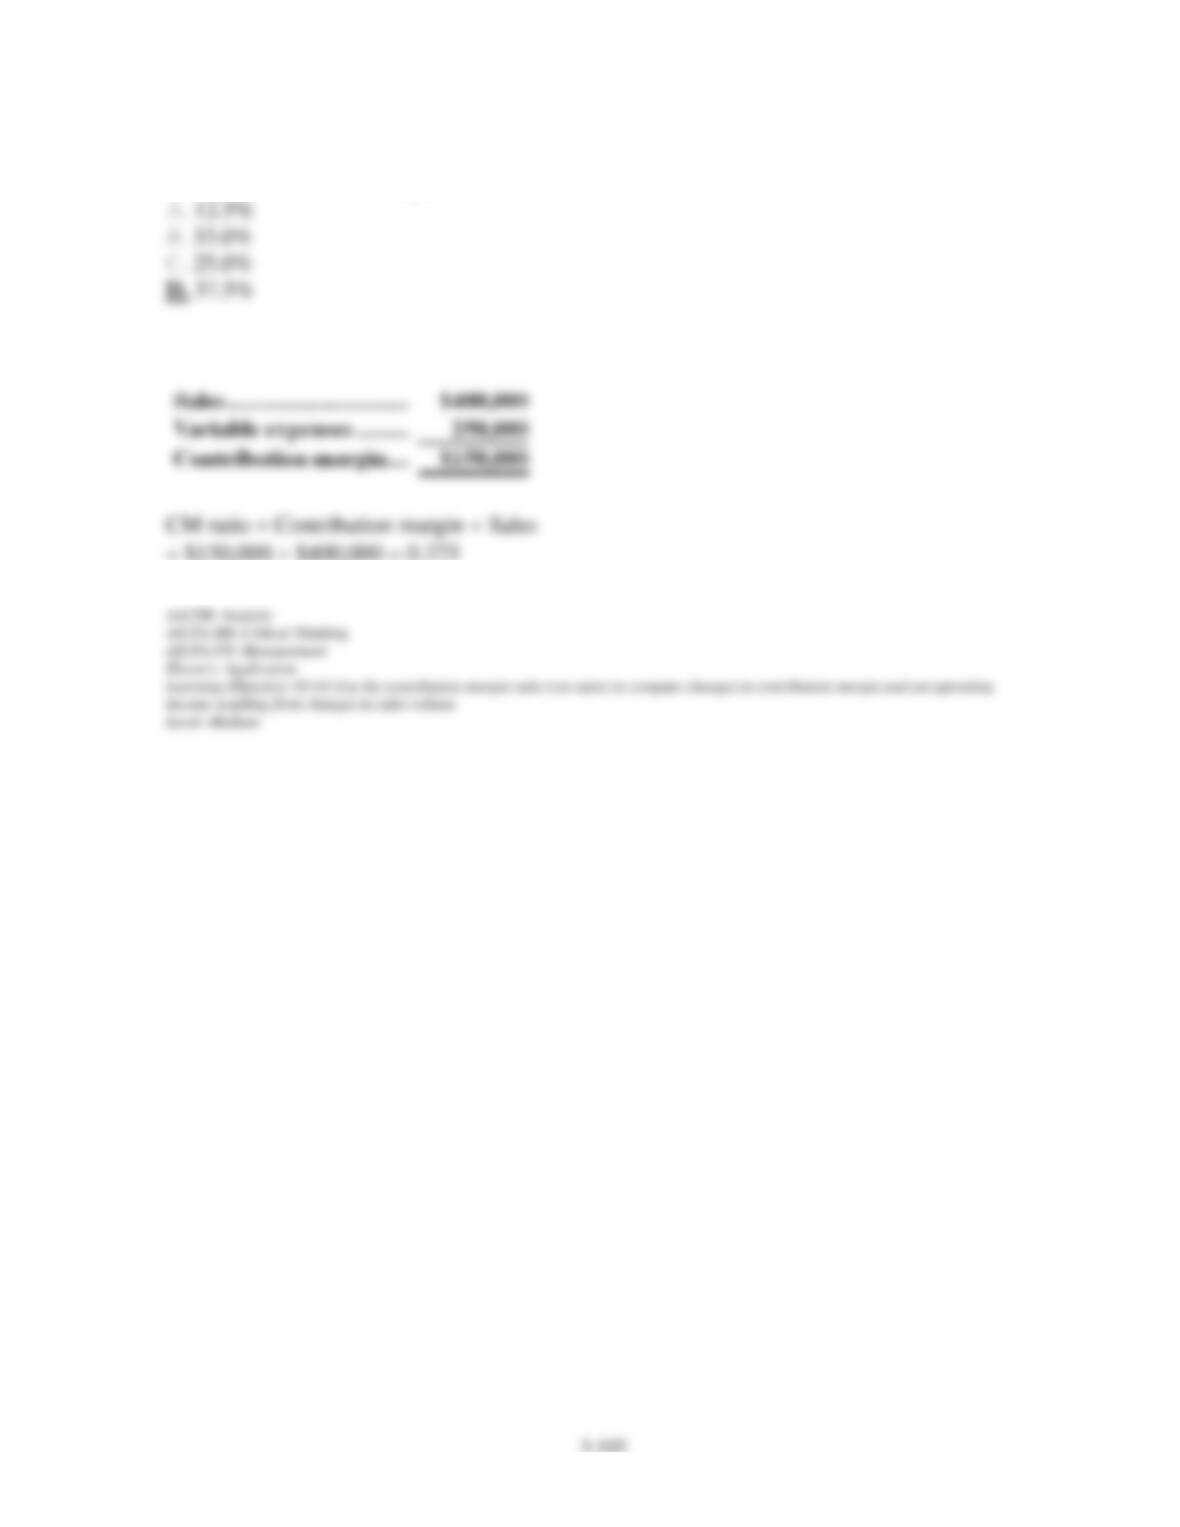
138. The contribution margin ratio is:
Chapter 05 – Cost-Volume-Profit Relationships
5-103
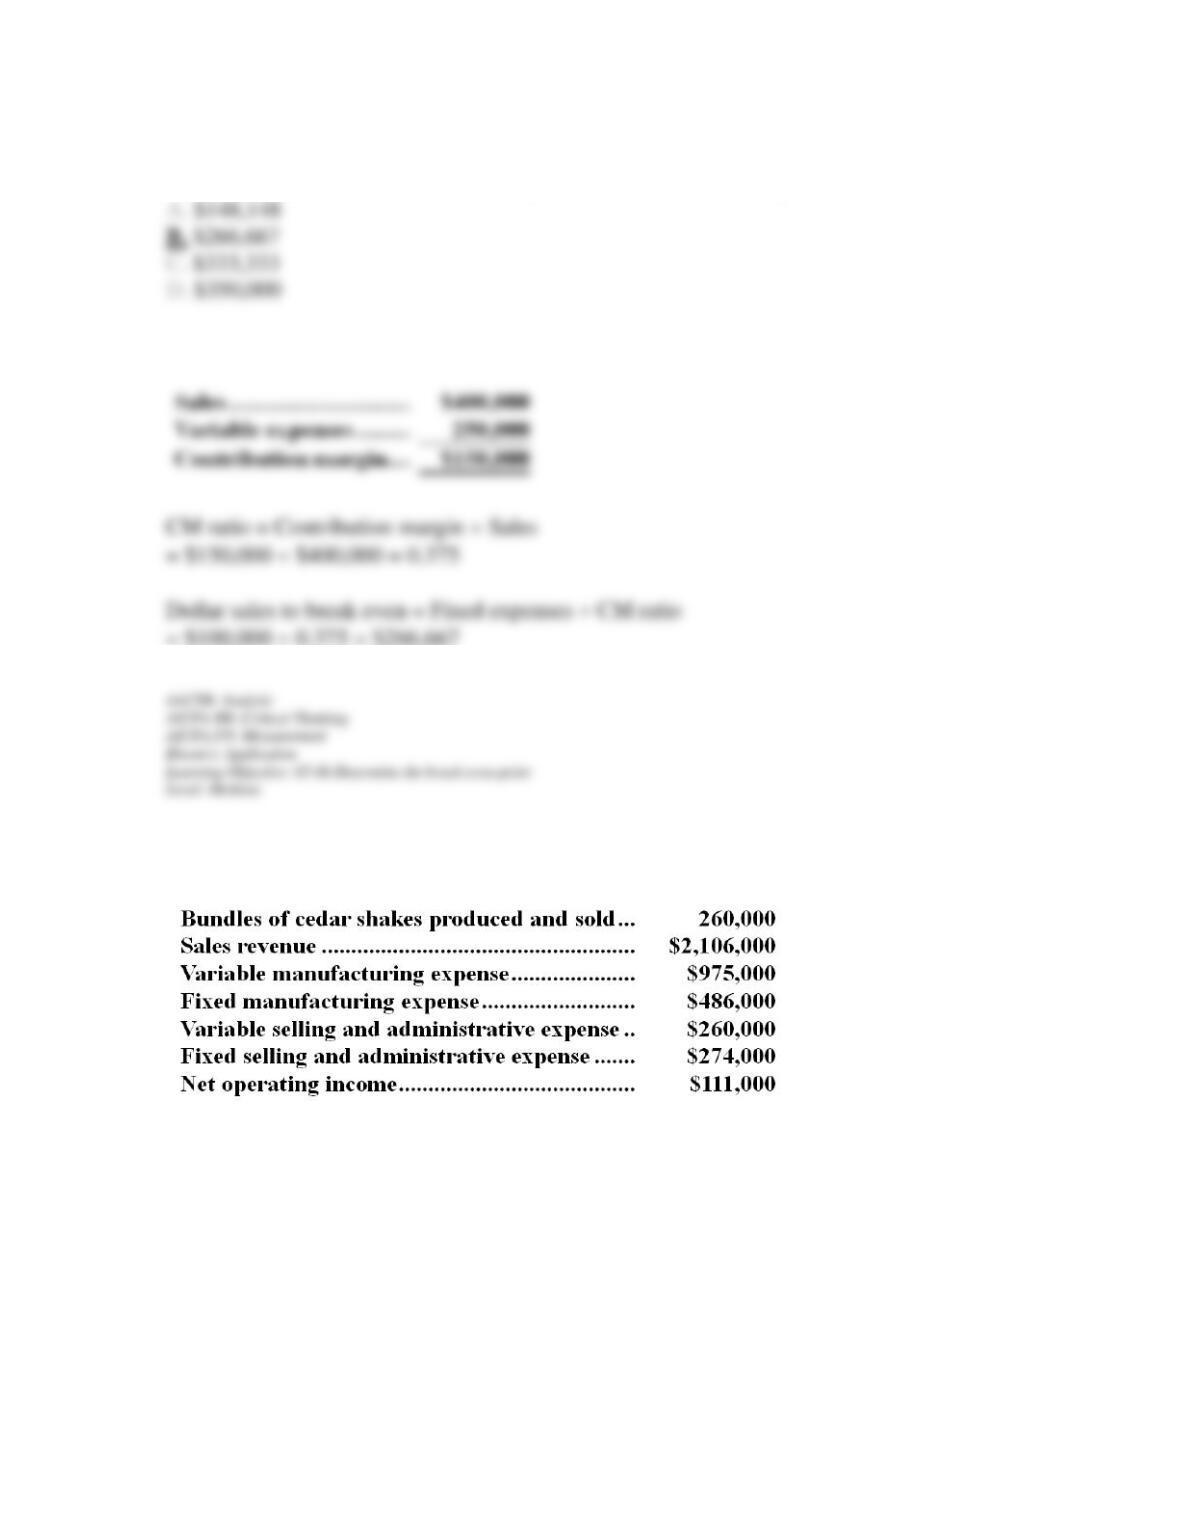
139. The break-even sales in dollars is (round to the nearest dollar):
A manufacturer of cedar shingles has supplied the following data:
Chapter 05 – Cost-Volume-Profit Relationships
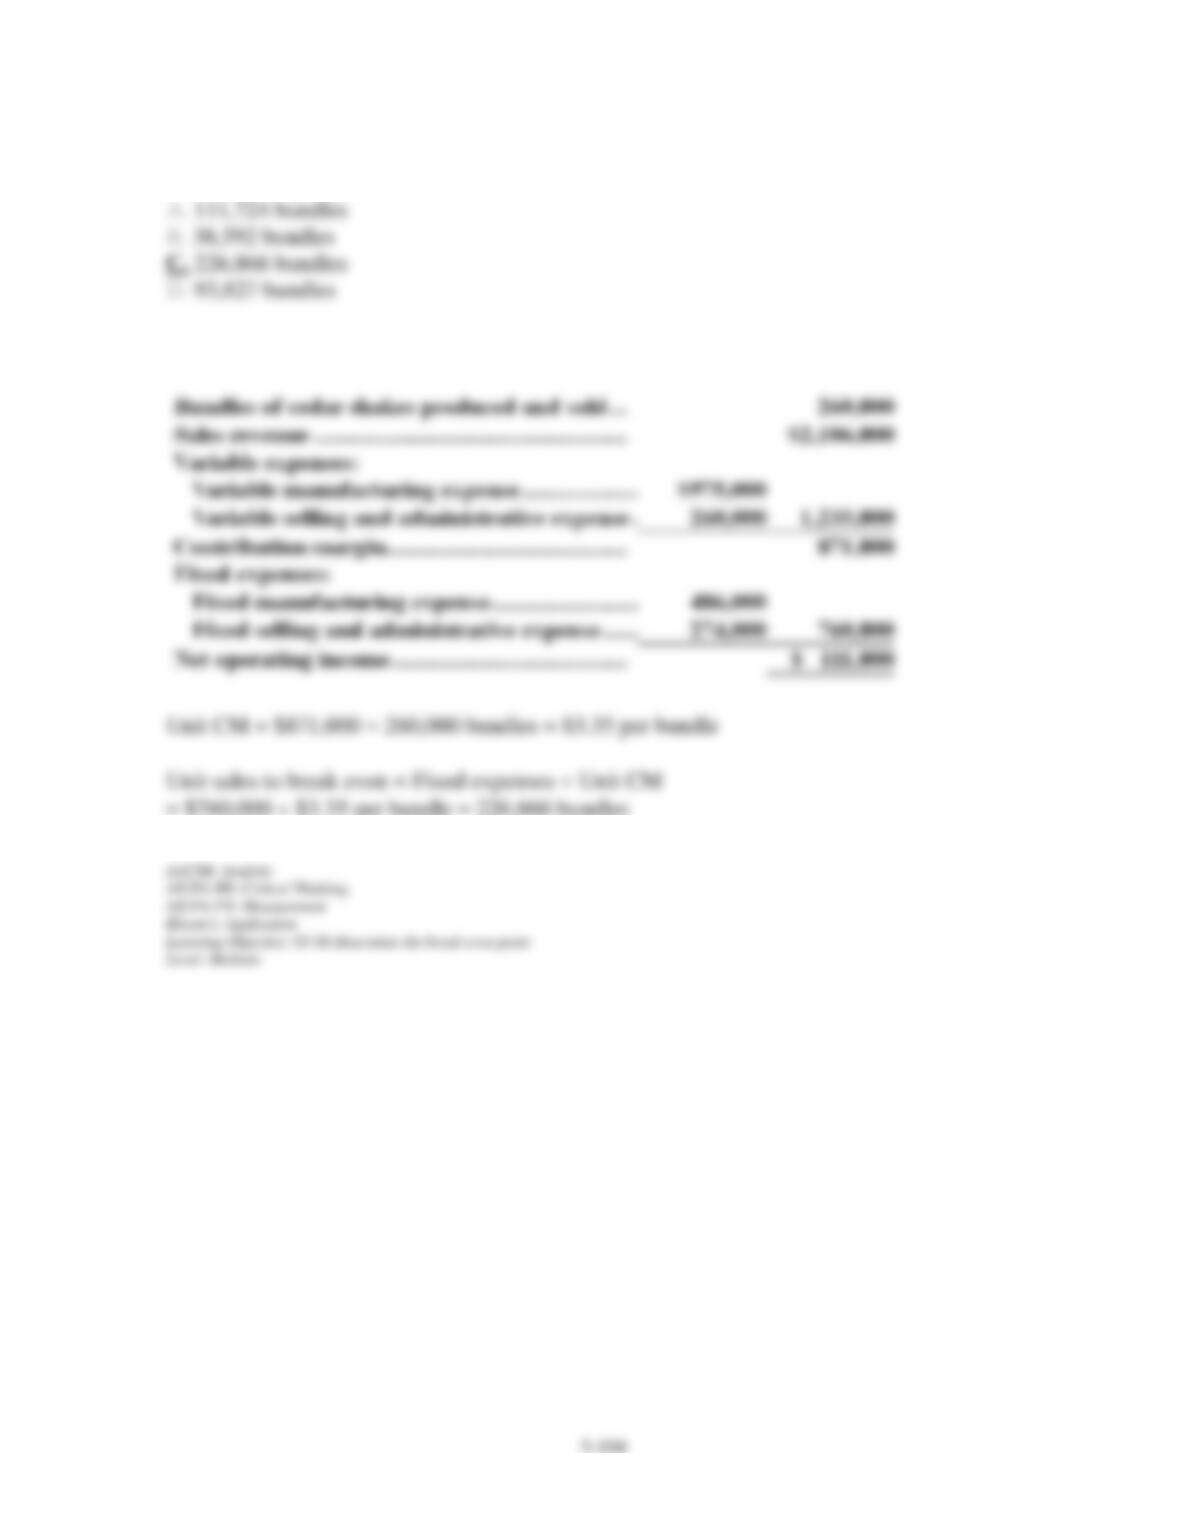
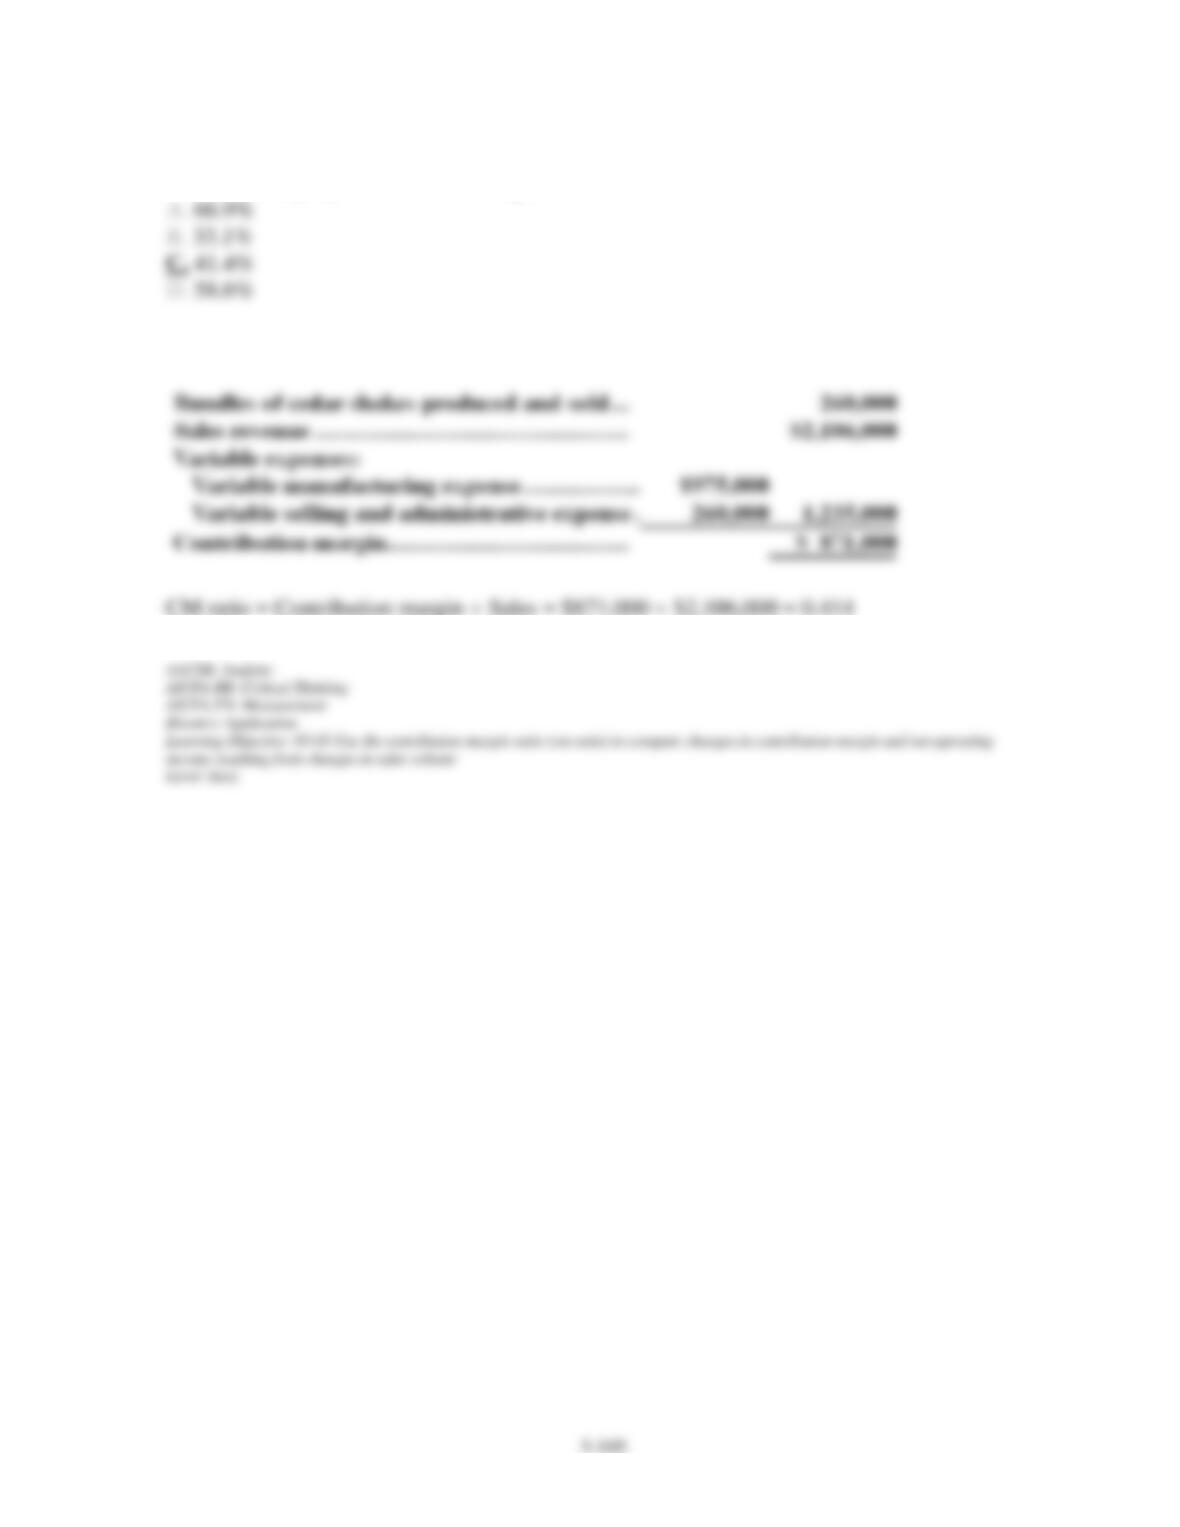
140. The company’s break-even in bundles is closest to:
Chapter 05 – Cost-Volume-Profit Relationships
141. The company’s contribution margin ratio is closest to:
Chapter 05 – Cost-Volume-Profit Relationships
5-106
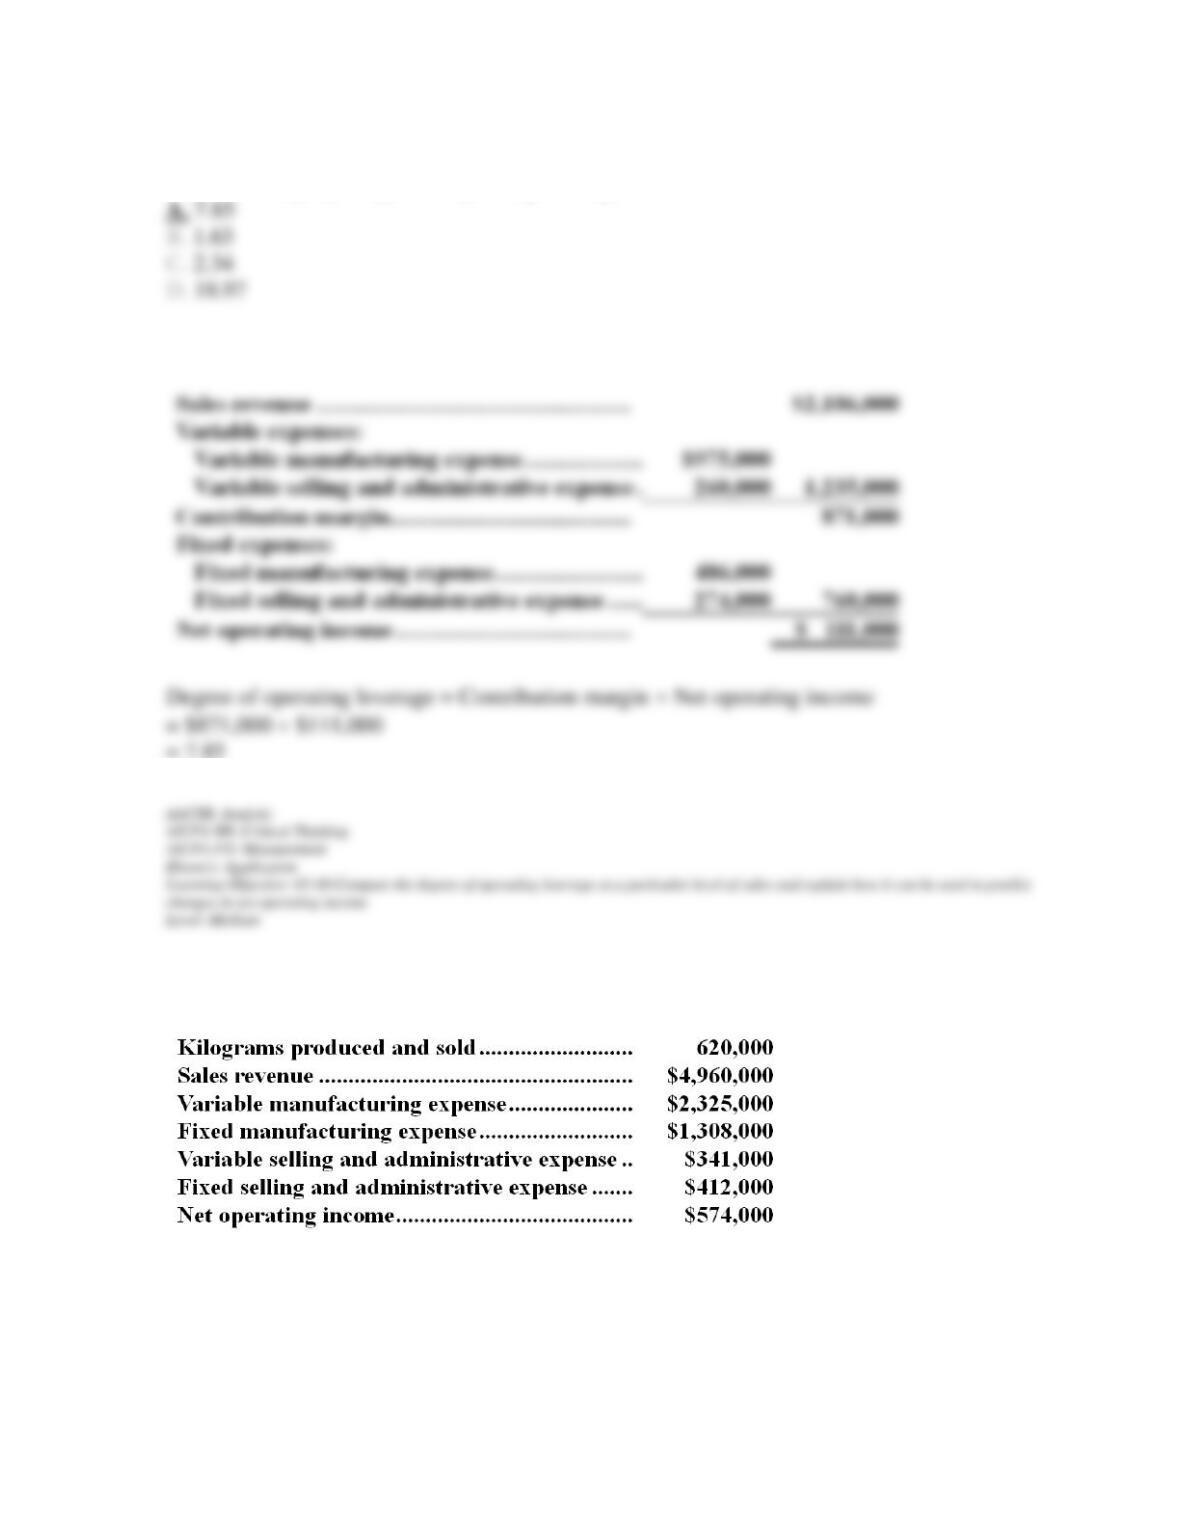
142. The company’s degree of operating leverage is closest to:
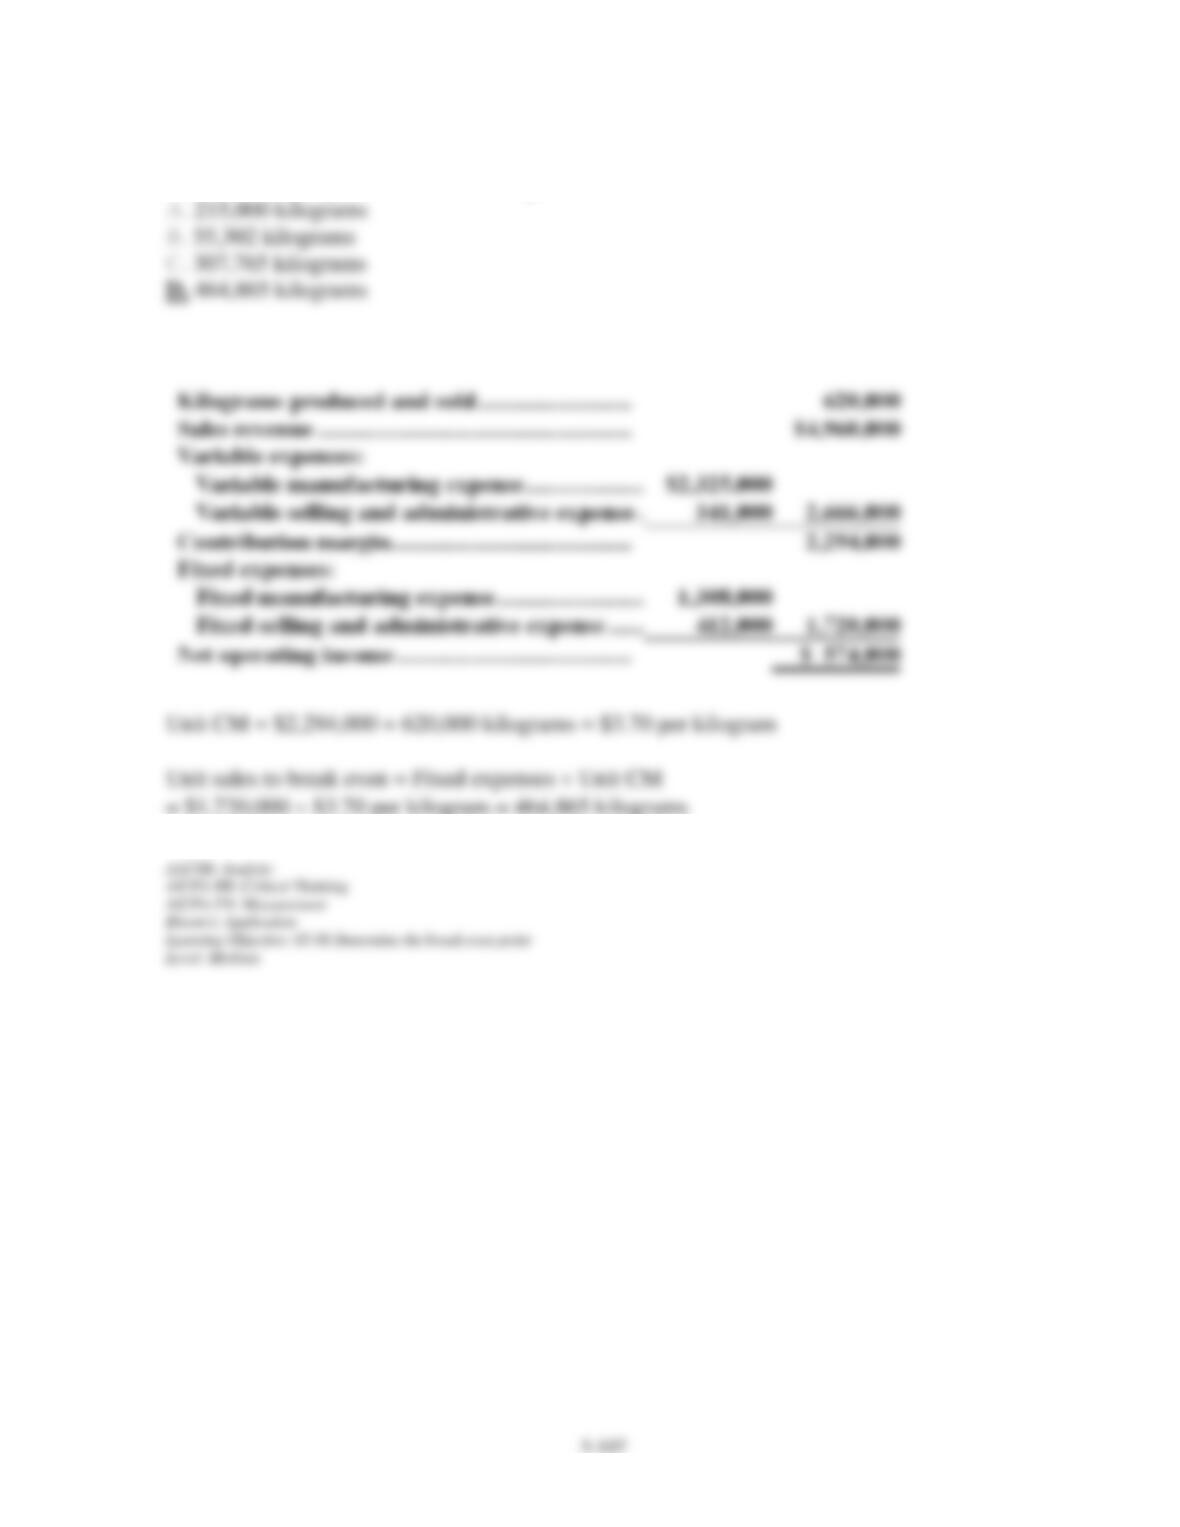
A manufacturer of tiling grout has supplied the following data:
Chapter 05 – Cost-Volume-Profit Relationships
143. The company’s break-even in kilograms is closest to:
Chapter 05 – Cost-Volume-Profit Relationships
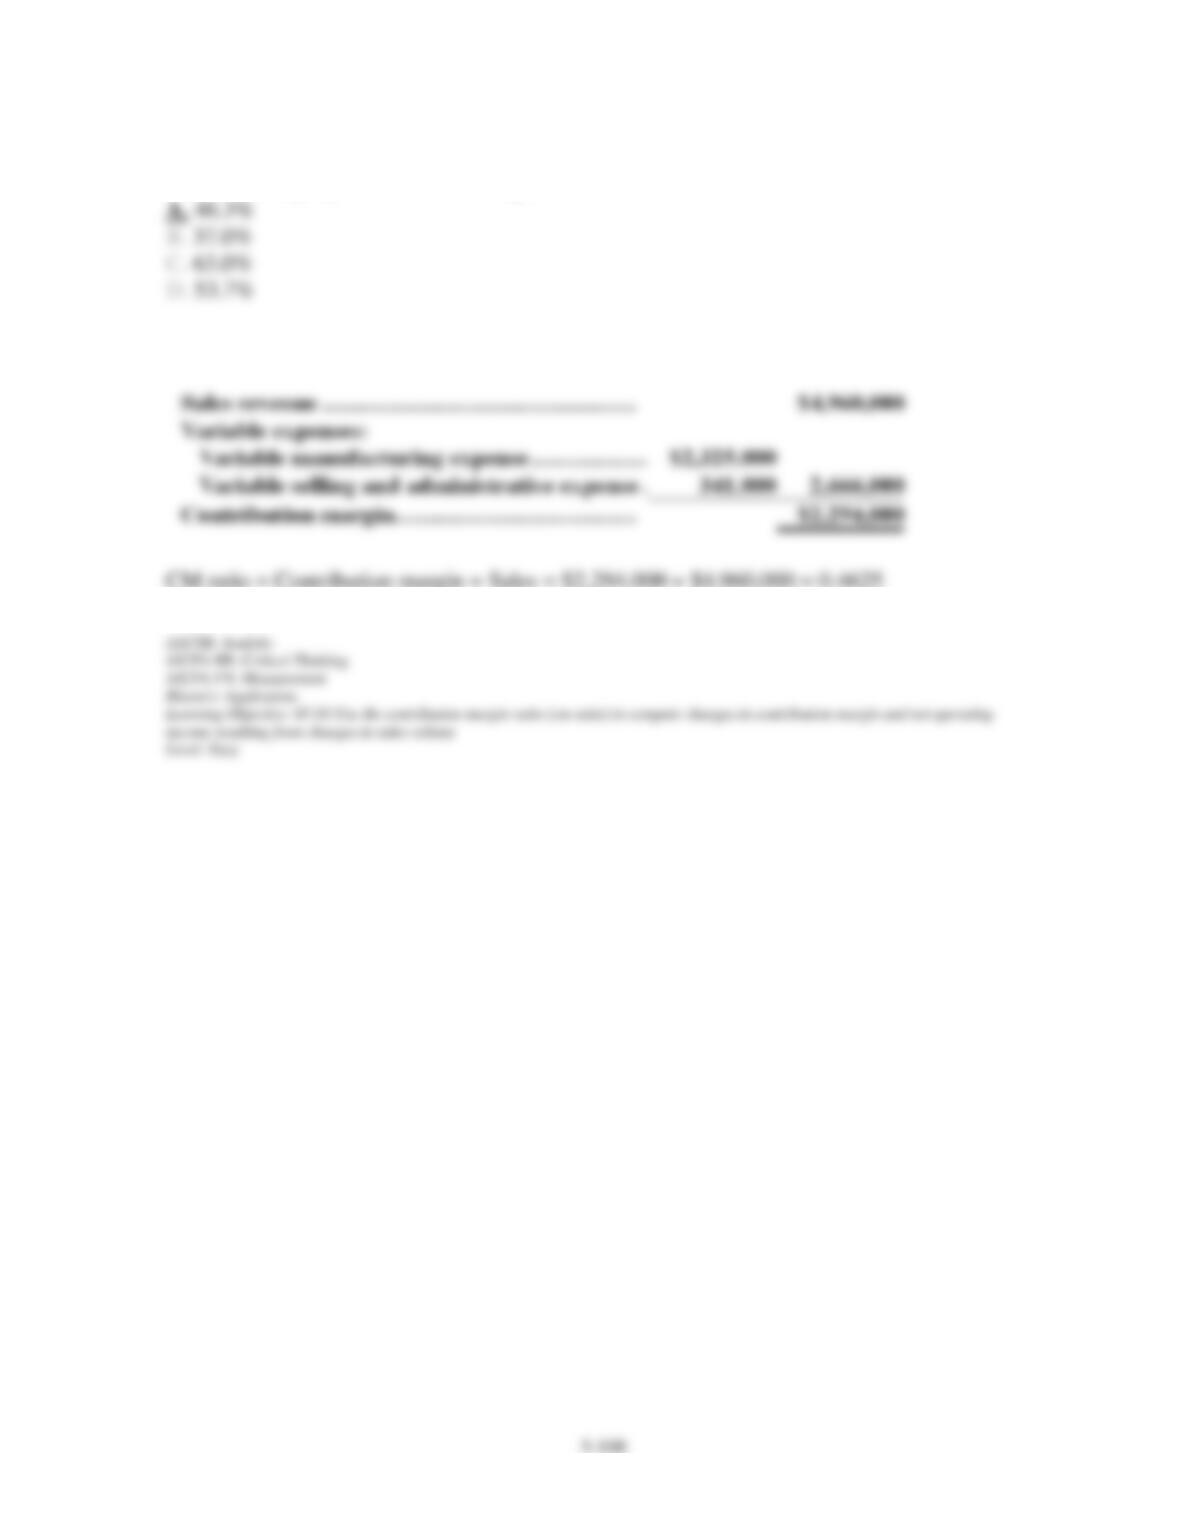
144. The company’s contribution margin ratio is closest to:
Chapter 05 – Cost-Volume-Profit Relationships
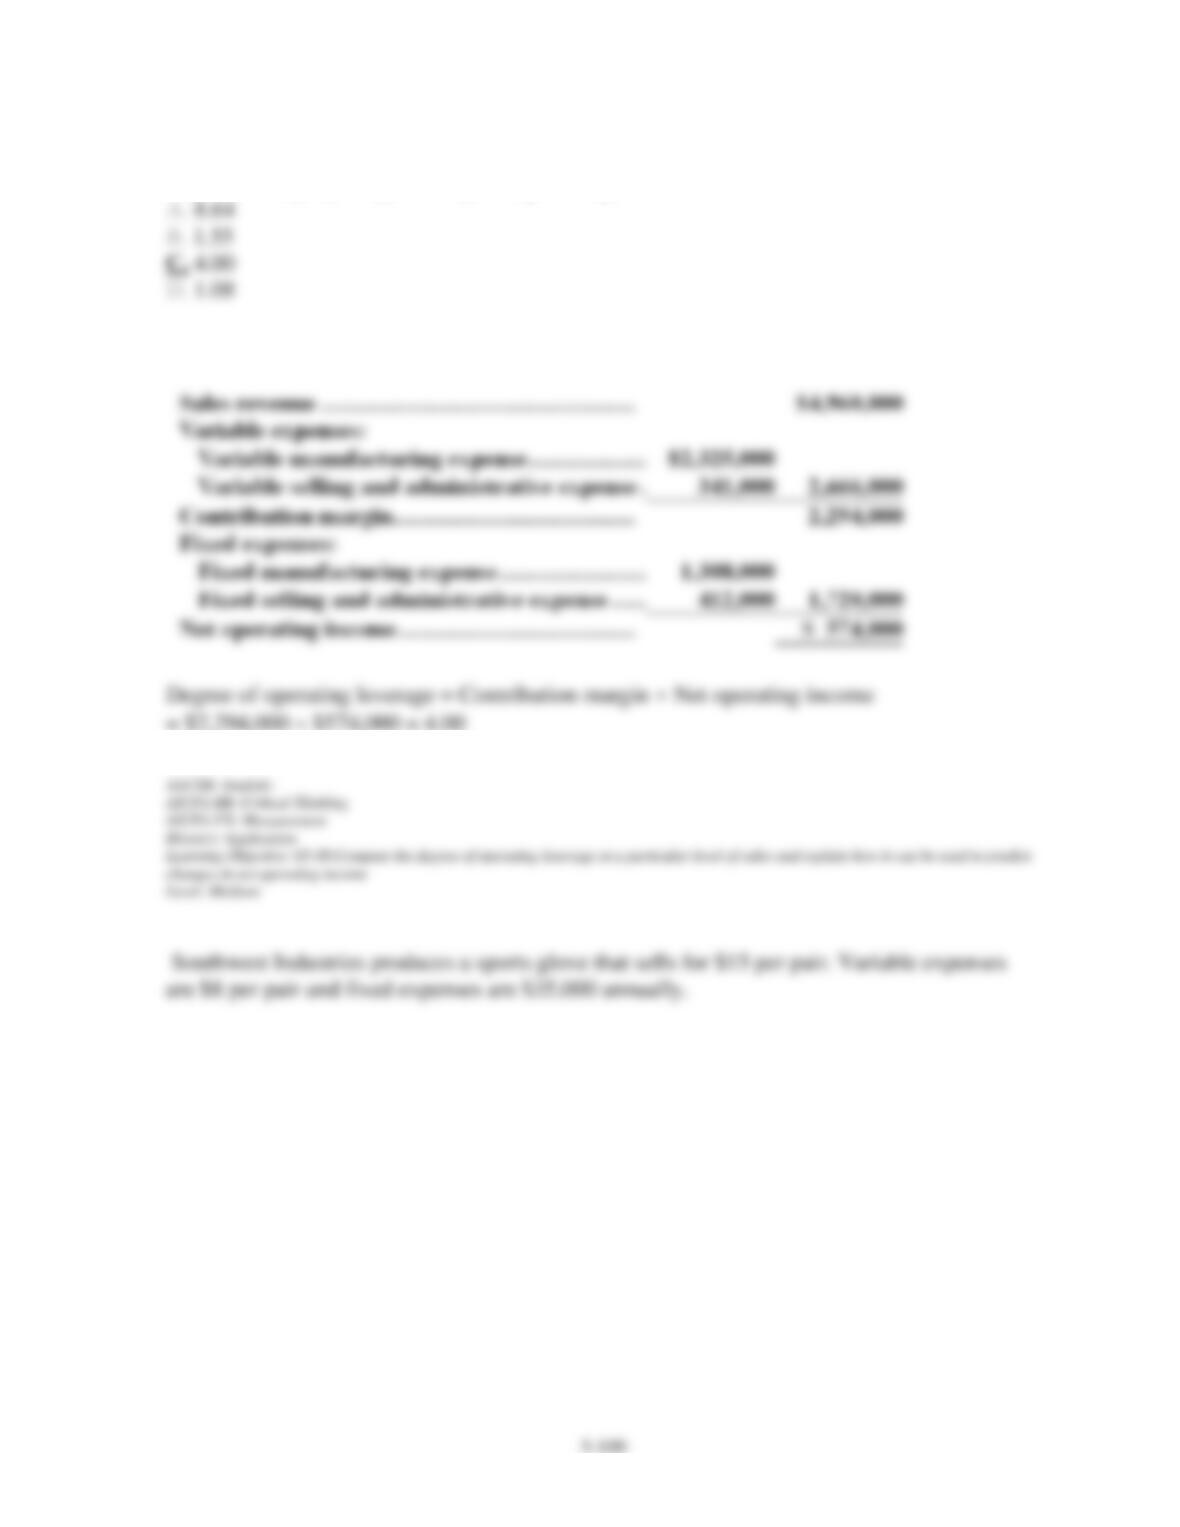
145. The company’s degree of operating leverage is closest to:
Chapter 05 – Cost-Volume-Profit Relationships
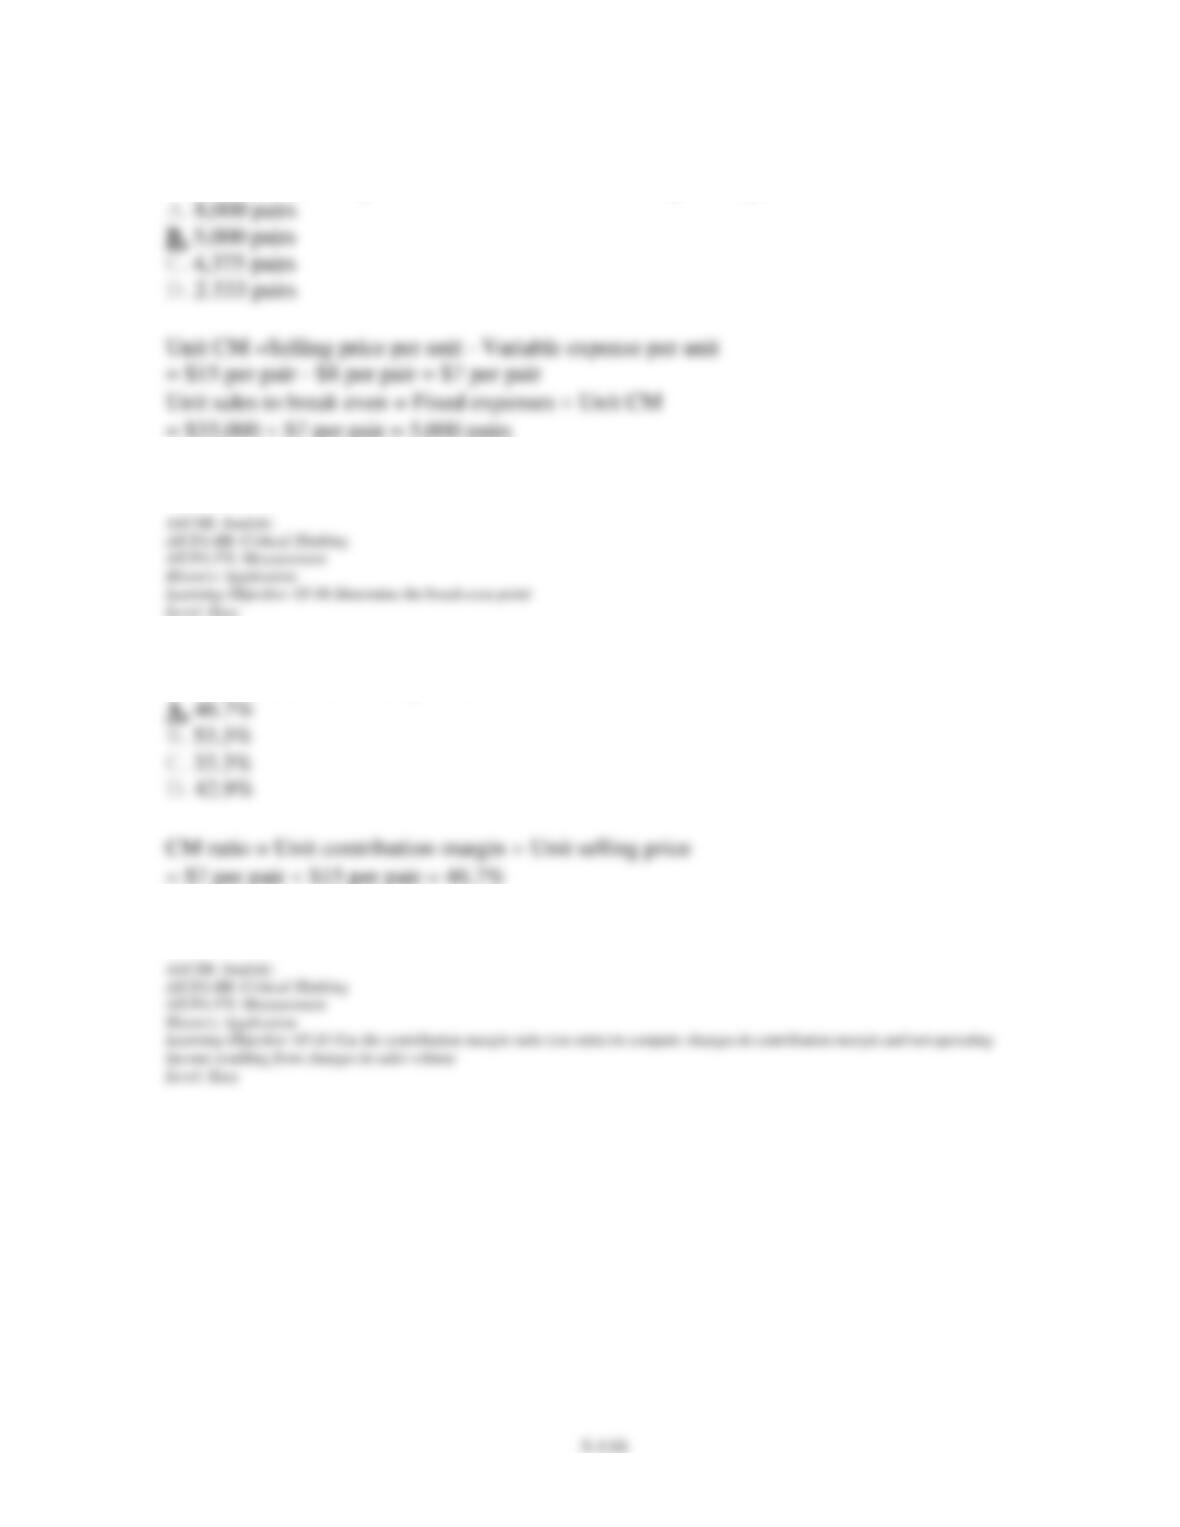
146. The break-even point for Southwest Industries in pairs of gloves is:
147. The contribution margin ratio is closest to:
Chapter 05 – Cost-Volume-Profit Relationships
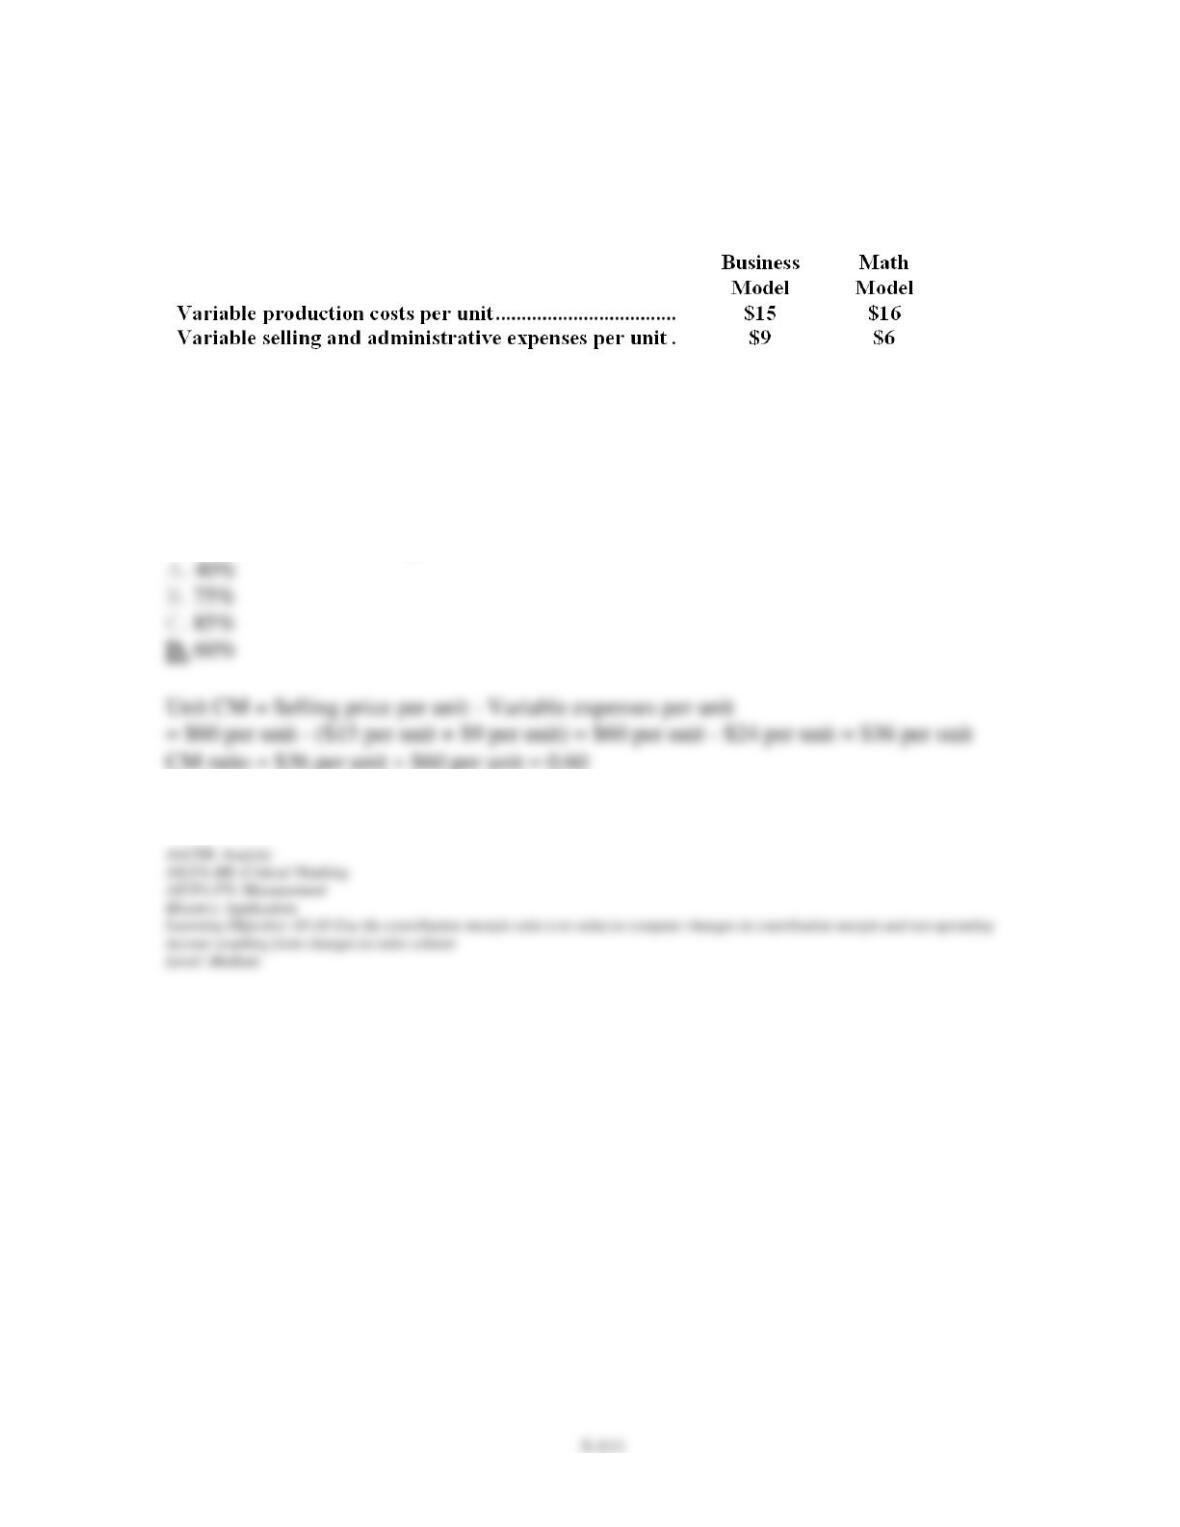
Mark Corporation produces two models of calculators. The Business model sells for $60, and
the Math model sells for $40. The variable expenses are given below:
The fixed expenses are $75,000 per month. The expected monthly sales of each model are:
Business, 1,000 units; Math, 500 units.
148. The contribution margin ratio for the Business model is:
Chapter 05 – Cost-Volume-Profit Relationships
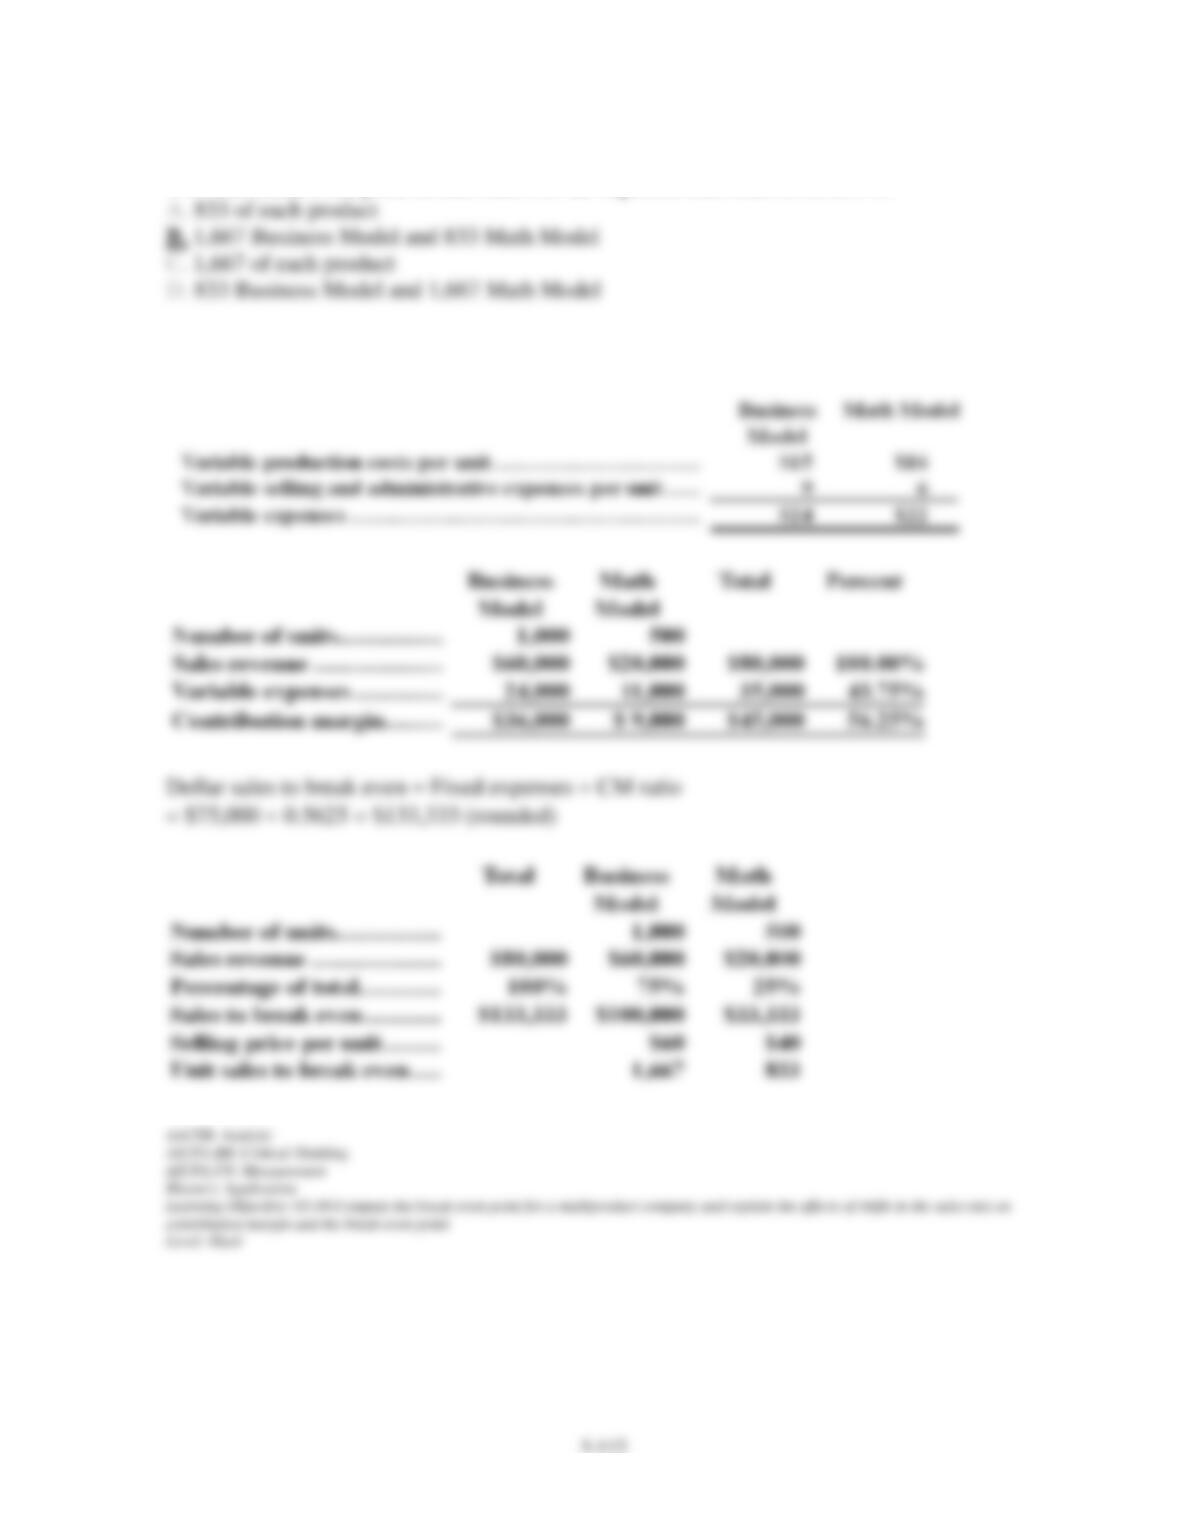
149. The break-even point in unit sales for the expected sales mix is closest to:
Chapter 05 – Cost-Volume-Profit Relationships
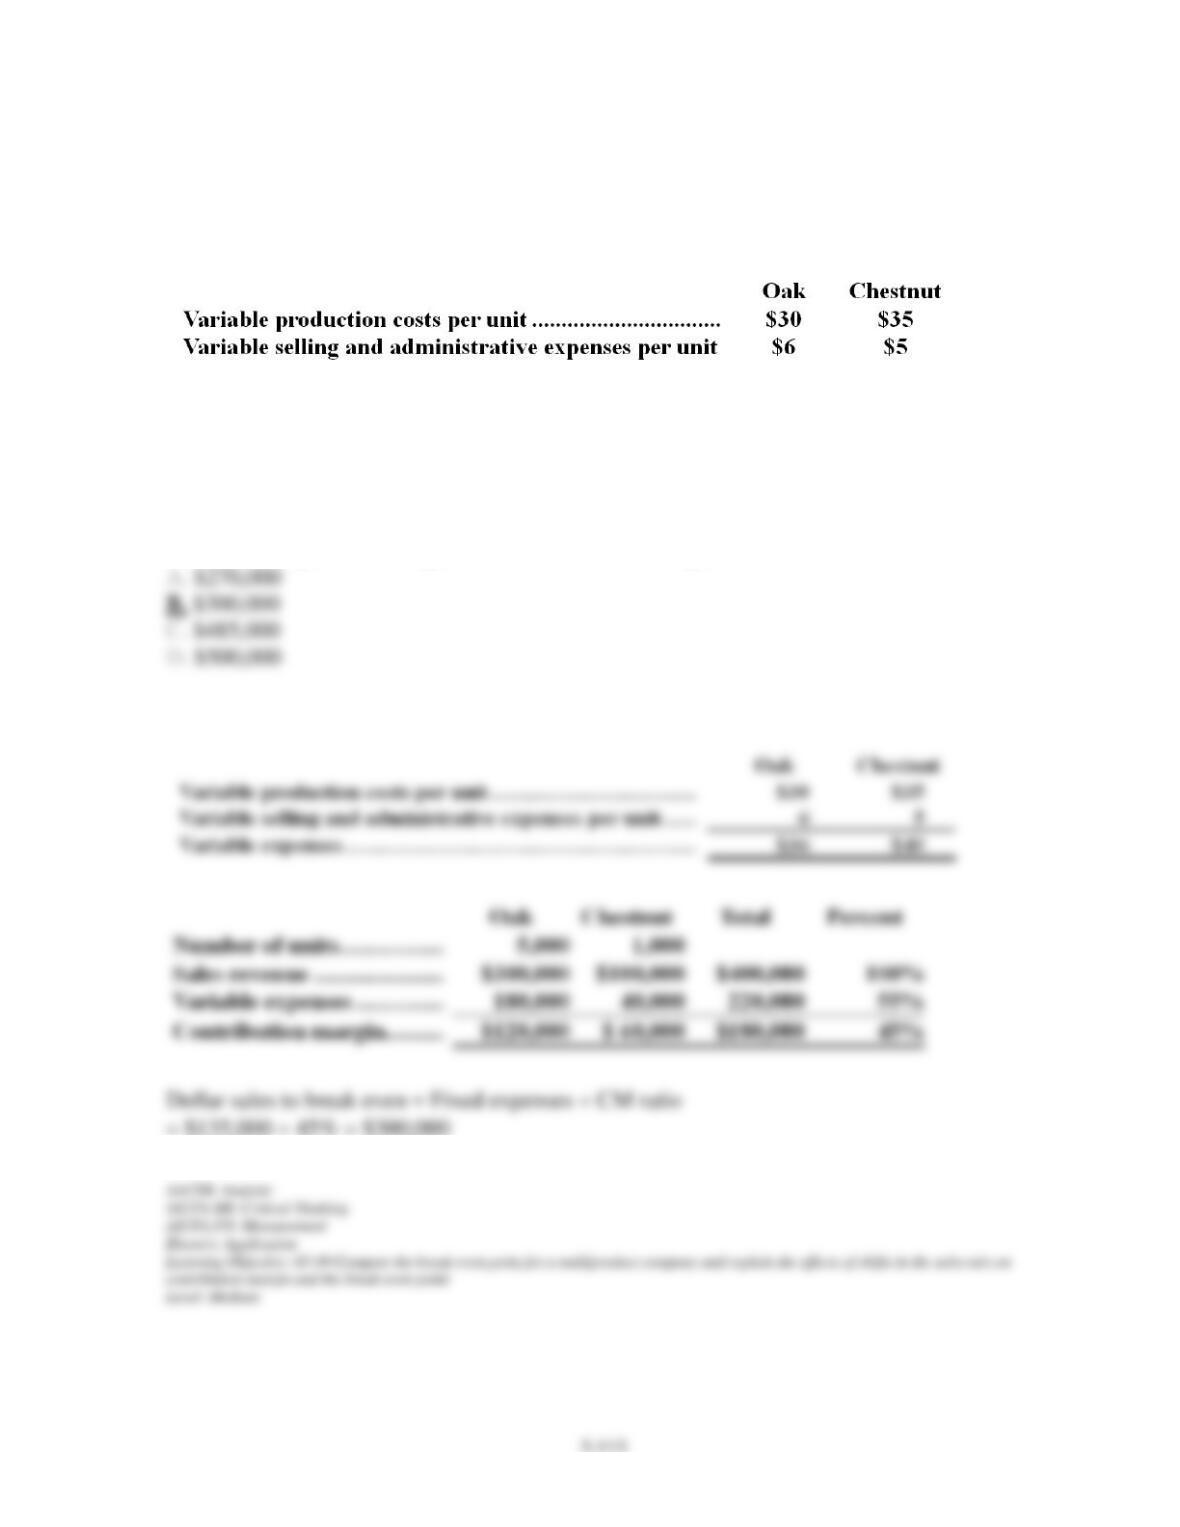
Gardner Furniture Company produces two kinds of chairs: an oak model and a chestnut wood
model. The oak model sells for $60 and the chestnut wood model sells for $100. The variable
expenses are as follows:
Expected sales in units next year are: 5,000 oak chairs and 1,000 chestnut chairs. Fixed
expenses are budgeted at $135,000 per year.
150. The yearly break-even point in total sales for the expected sales mix is:
Chapter 05 – Cost-Volume-Profit Relationships
5-114
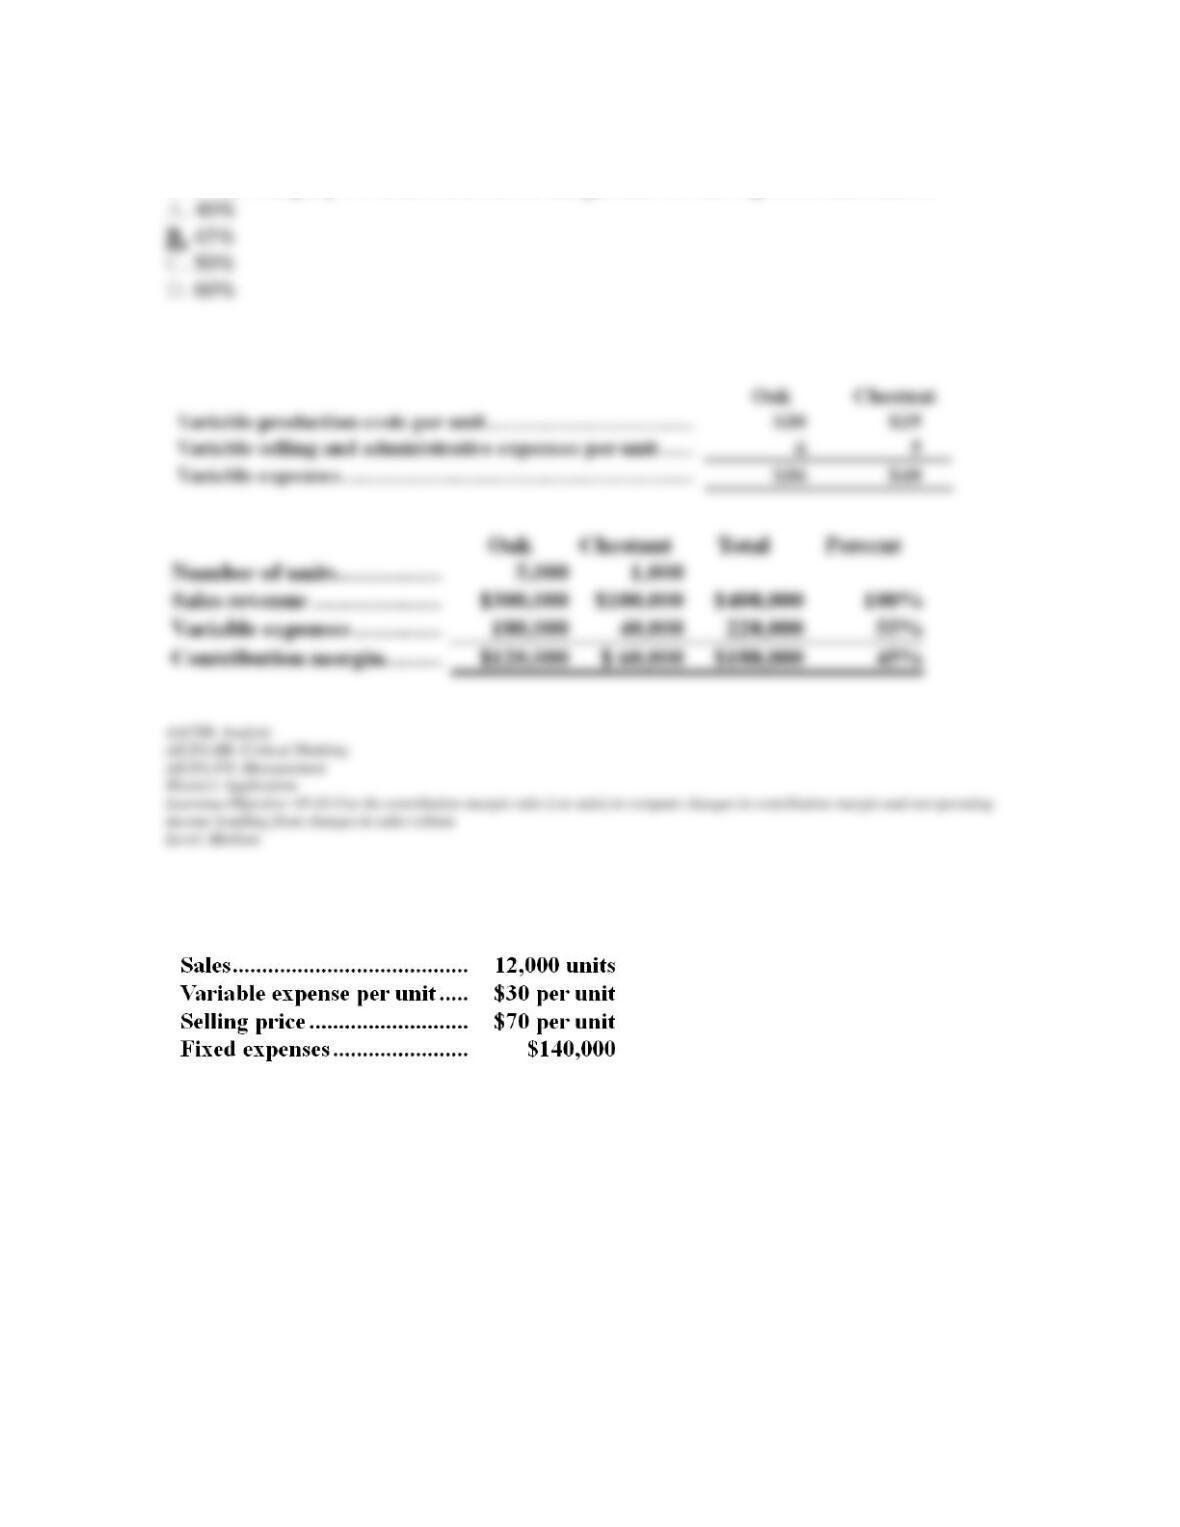
151. The company’s overall contribution margin ratio for the expected sales mix is:
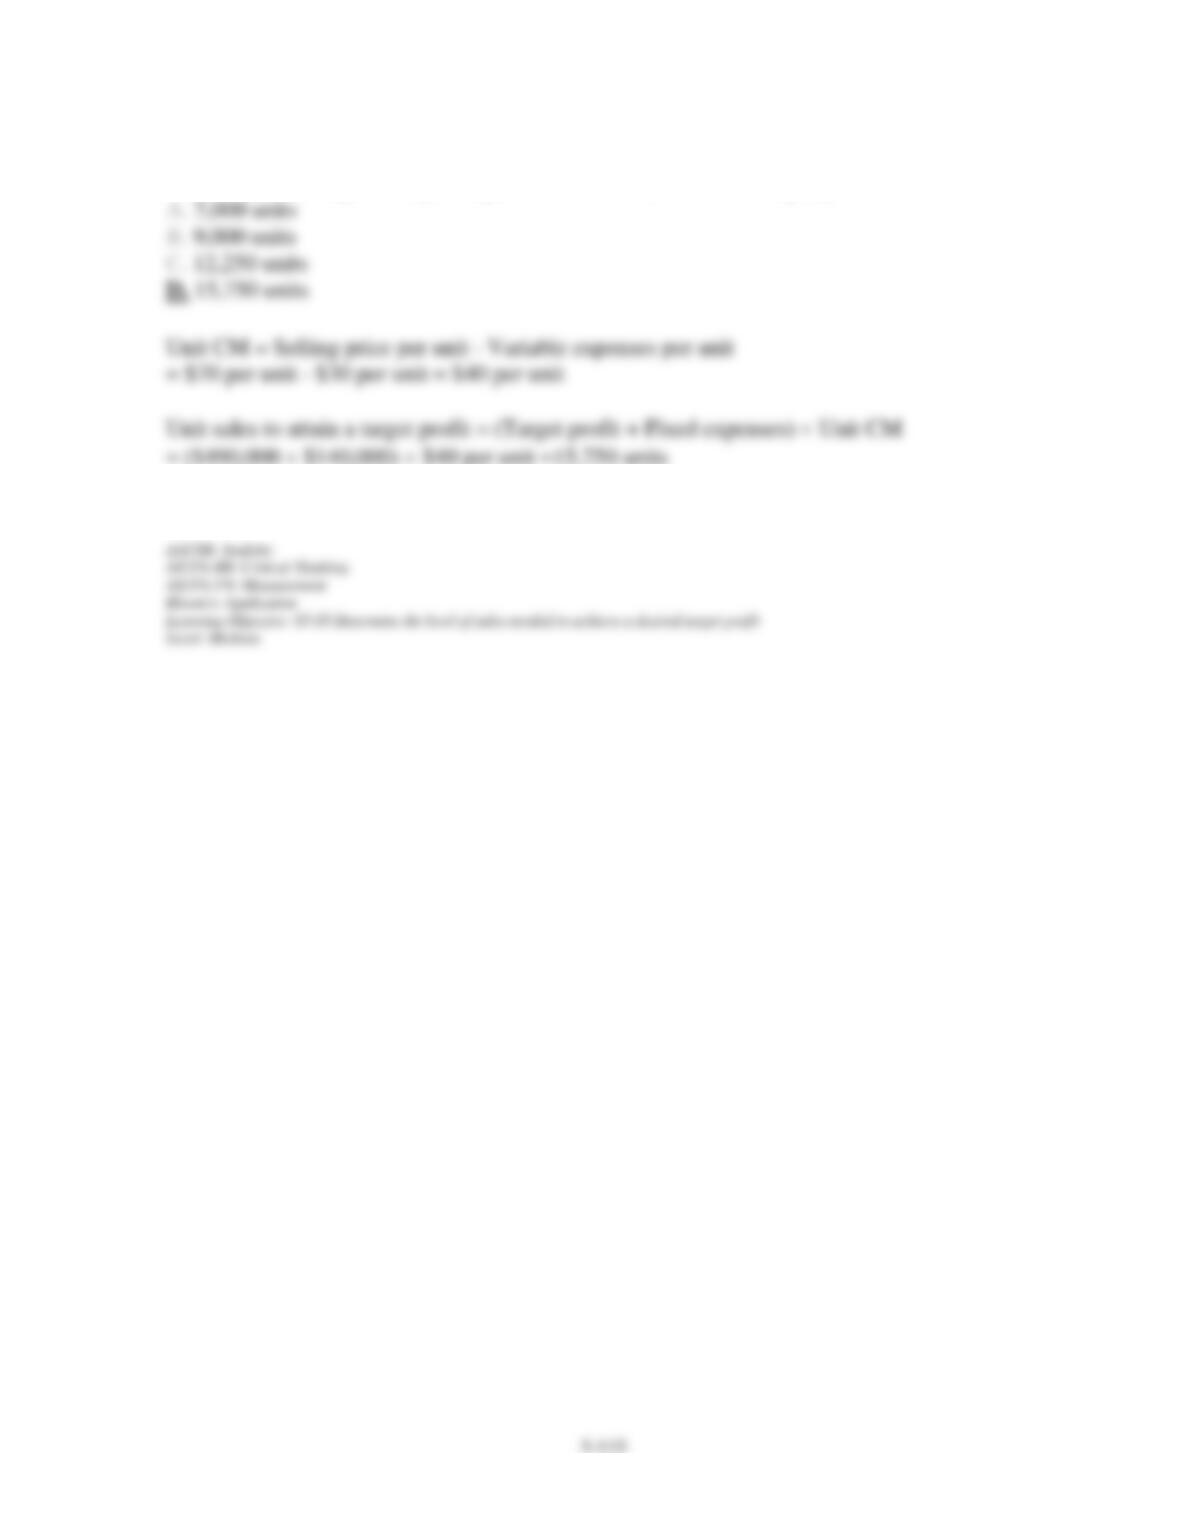
East Company has the following budgeted cost and revenue data:
Chapter 05 – Cost-Volume-Profit Relationships
152. To reach a target net operating income of $490,000, East Company must sell:
Chapter 05 – Cost-Volume-Profit Relationships
5-116
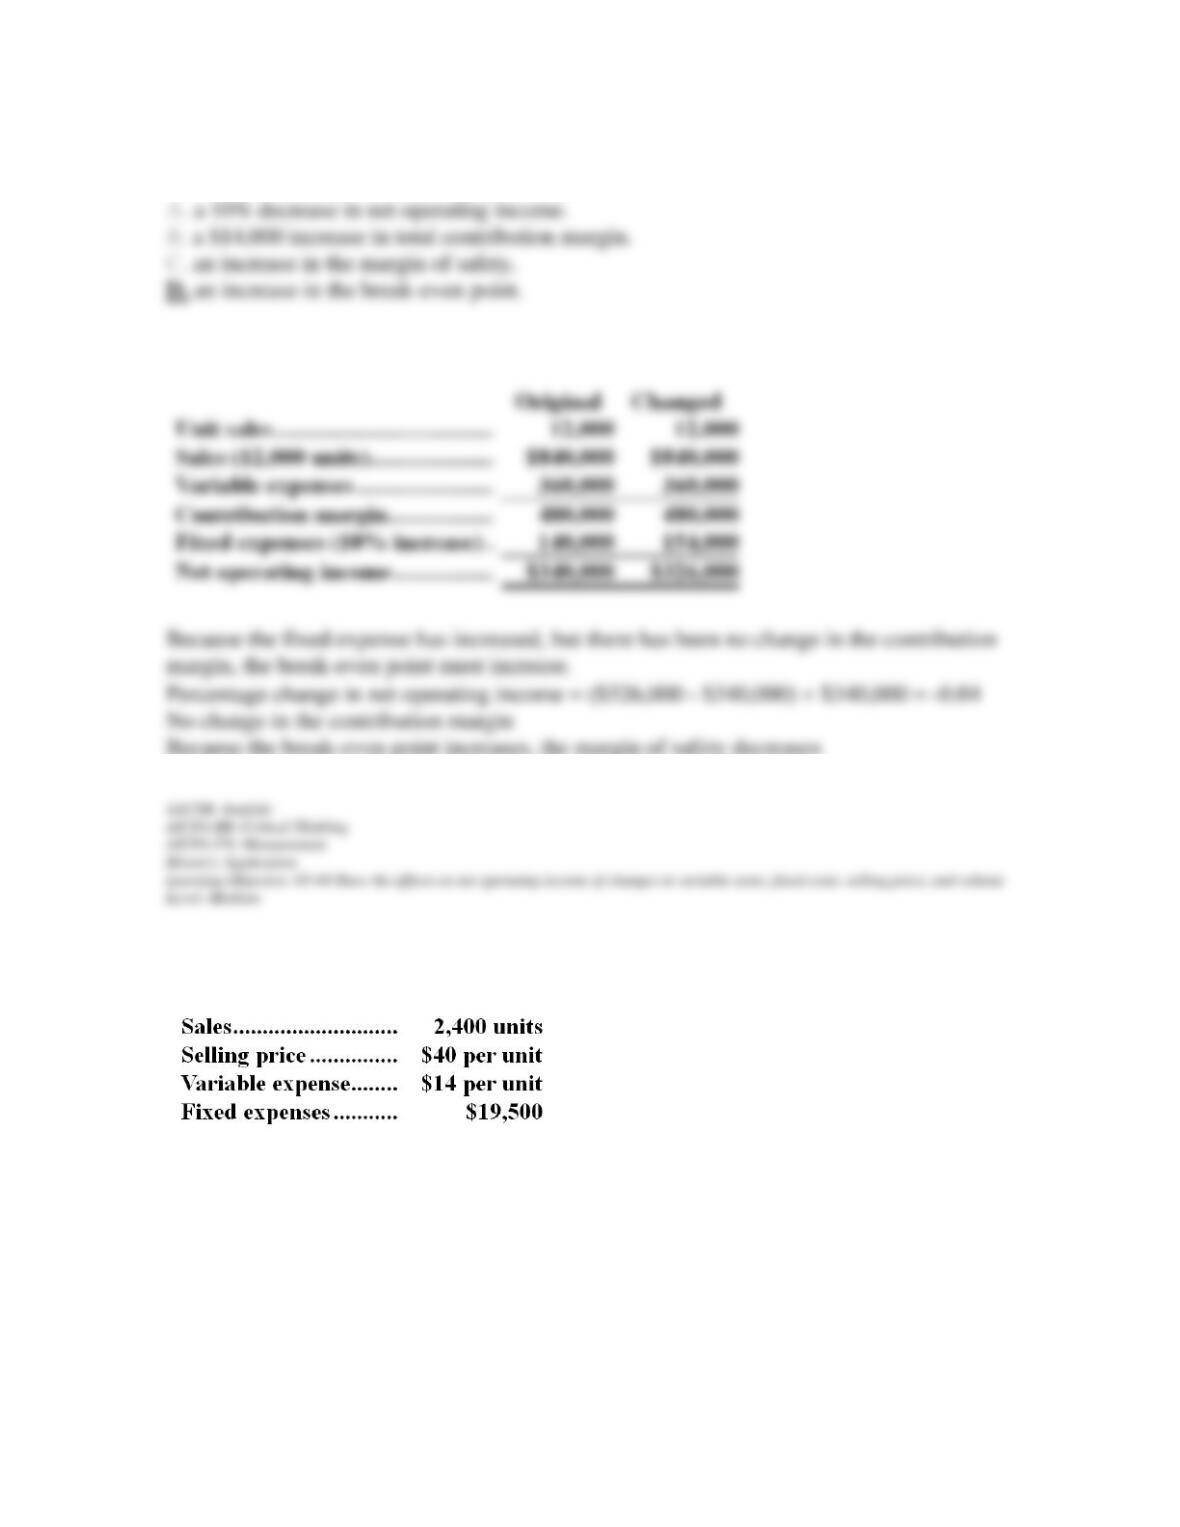
153. A 10% increase in fixed expense would result in:
Jackson Company’s operating results for last year are given below:
154. If the company wants to increase its total contribution margin by 40% over last year, it
will need to increase its sales by:
Chapter 05 – Cost-Volume-Profit Relationships
5-118
155. If the company’s fixed expenses decrease by 20% next year, the break-even point will
change from its previous level by:
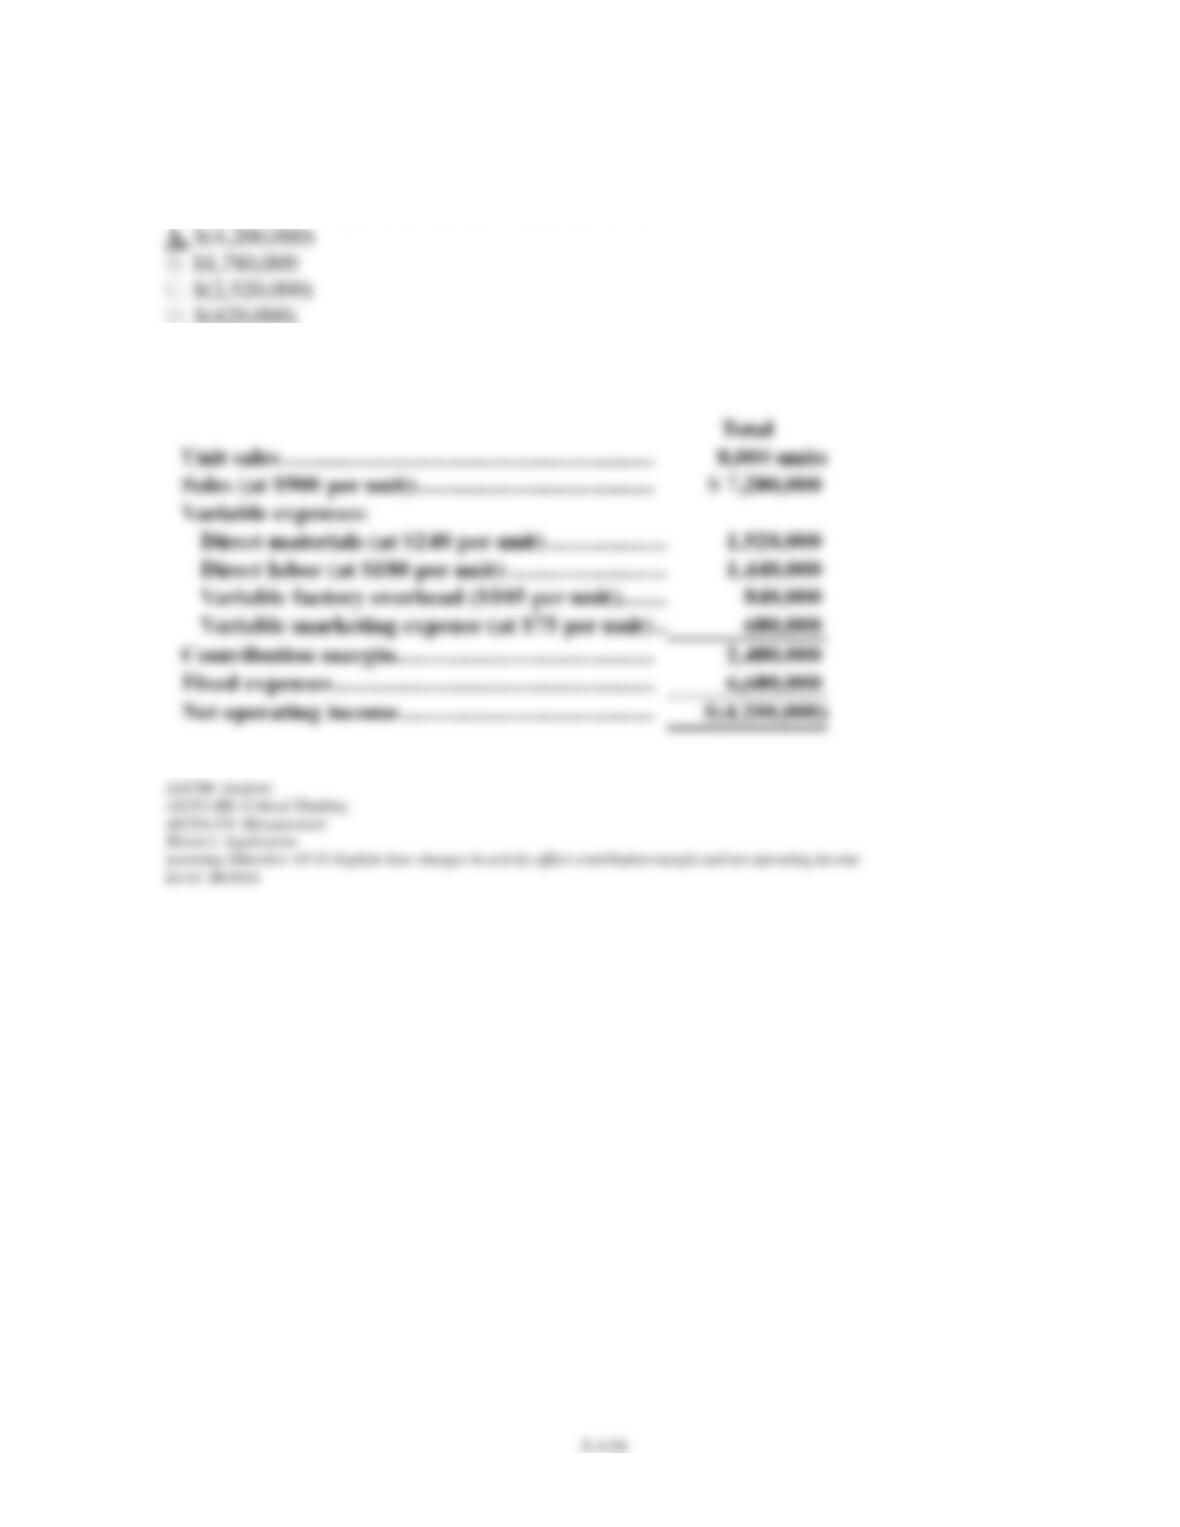
Madengrad Company manufactures a single product called a densimeter. This product is a
density monitoring device attached to large industrial mixing machines used in flour, rubber,
petroleum, and chemical manufacturing. A densimeter sells for $900 per unit. The following
variable expenses are incurred to produce and sell each densimeter:
Madengrad’s annual fixed expenses are $6,600,000.
Chapter 05 – Cost-Volume-Profit Relationships
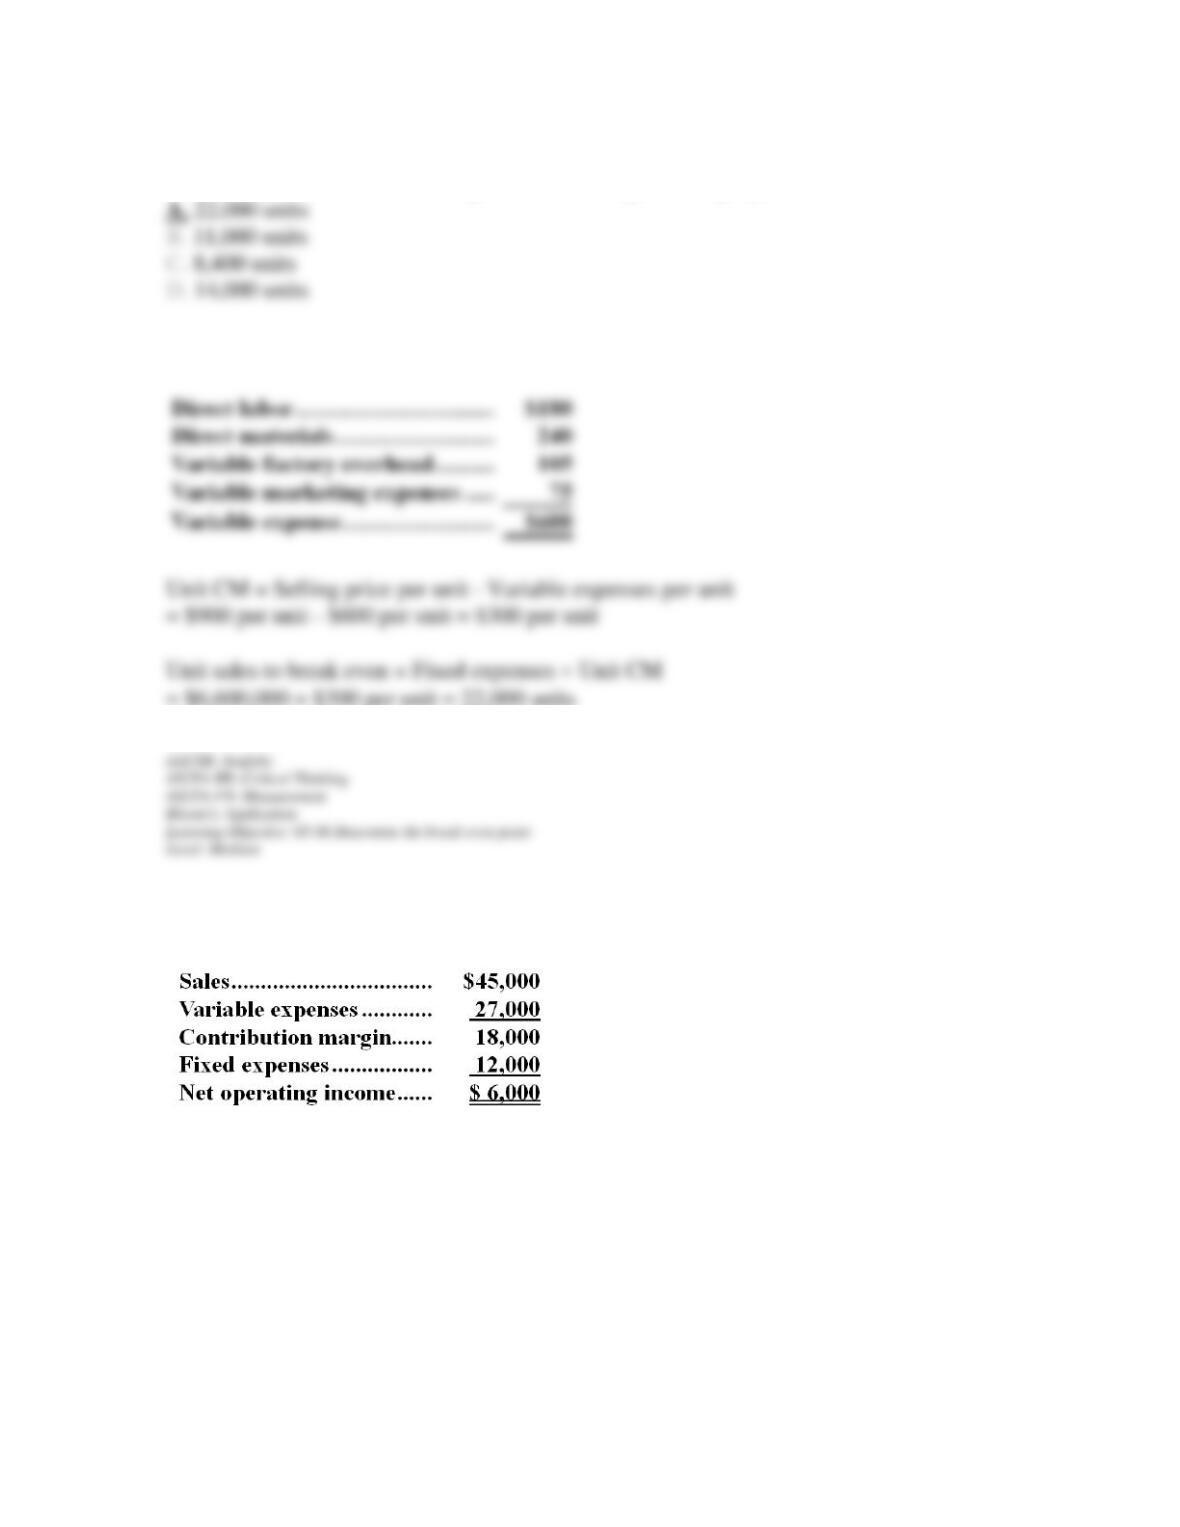
156. If Madengrad Company achieves a sales and production volume of 8,000 units, the
annual net operating income (loss) is expected to be:
Chapter 05 – Cost-Volume-Profit Relationships
5-120
157. The annual sales volume required for Madengrad Company to break-even is:
Wright Corporation’s contribution format income statement for last month appears below.
There were no beginning or ending inventories. The company produced and sold 3,000 units
during the month.