Chapter 05 – Cost-Volume-Profit Relationships
5-1
Chapter 05 Cost-Volume-Profit Relationships Answer Key
True / False Questions
1. Reynold Enterprises sells a single product for $25. The variable expense per unit is $15 and
the fixed expense per unit is $5 at the current level of sales. The company’s net operating
income will increase by $5 if one more unit is sold.
2. Incremental analysis is an analytical approach that focuses only on those revenues and costs
that will change as a result of a decision.
3. To facilitate decision-making, fixed expenses should be expressed on a per-unit basis.
Chapter 05 – Cost-Volume-Profit Relationships
5-2
4. On a CVP graph for a profitable company, the total revenue line will be steeper than the
total expense line.
5. On a CVP graph for a profitable company, the total expense line will be steeper than the
line representing fixed costs.
6. For a given level of sales, a low contribution margin ratio will produce less net operating
income than a high contribution margin ratio.
Chapter 05 – Cost-Volume-Profit Relationships
5-3
7. The impact on net operating income of a given dollar change in sales can be computed by
applying the contribution margin ratio to the dollar change in sales.
8. The variable expense per unit is $12 and the selling price per unit is $40. Then the
contribution margin ratio is 70%.
9. Mark Company currently sells a video recorder with a selling price of $300 per unit. The
variable expense per unit is $175 and fixed expenses are $100,000. If the company reduces
variable expenses by $20 per unit and increases the fixed expenses by $10,000, the break-
even point will increase.
Chapter 05 – Cost-Volume-Profit Relationships
5-4
10. The total volume in sales dollars that would be required to attain a given target profit is
determined by dividing the sum of the fixed expenses and the target profit by the contribution
margin ratio.
11. The break-even point in units can be obtained by dividing total fixed expenses by the
contribution margin ratio.
12. At the break-even point: Sales – Variable expenses = Fixed expenses.
13. If fixed expenses increase by $10,000 per year, then the level of sales needed to break
even will also increase by $10,000.
Chapter 05 – Cost-Volume-Profit Relationships
5-5
14. If the fixed expenses increase in a company, and all other factors remain unchanged, then
one would expect the margin of safety to decrease.
15. The margin of safety percentage is equal to the margin of safety in dollars divided by total
sales in dollars.
16. If two companies produce the same product and have the same total sales and same total
expenses, operating leverage will be lower in the company with a higher proportion of fixed
expenses in its cost structure.
Chapter 05 – Cost-Volume-Profit Relationships
5-6
17. A company with a degree of operating leverage of 4 would expect net operating income to
increase by 200% if sales increased from $100,000 to $150,000.
18. If two companies have the same total sales and total expenses and make the same product,
the volatility of net operating income with changes in sales will tend to be greater in the
company with a higher proportion of fixed expenses in its cost structure.
19. A shift in the sales mix from products with a low contribution margin ratio toward
products with a high contribution margin ratio will lower the break-even point in the company
as a whole.
Chapter 05 – Cost-Volume-Profit Relationships
5-7
Multiple Choice Questions
20. The difference between total sales in dollars and total variable expenses is called:
21. With regard to the CVP graph, which of the following statements is not correct?
Chapter 05 – Cost-Volume-Profit Relationships
5-8
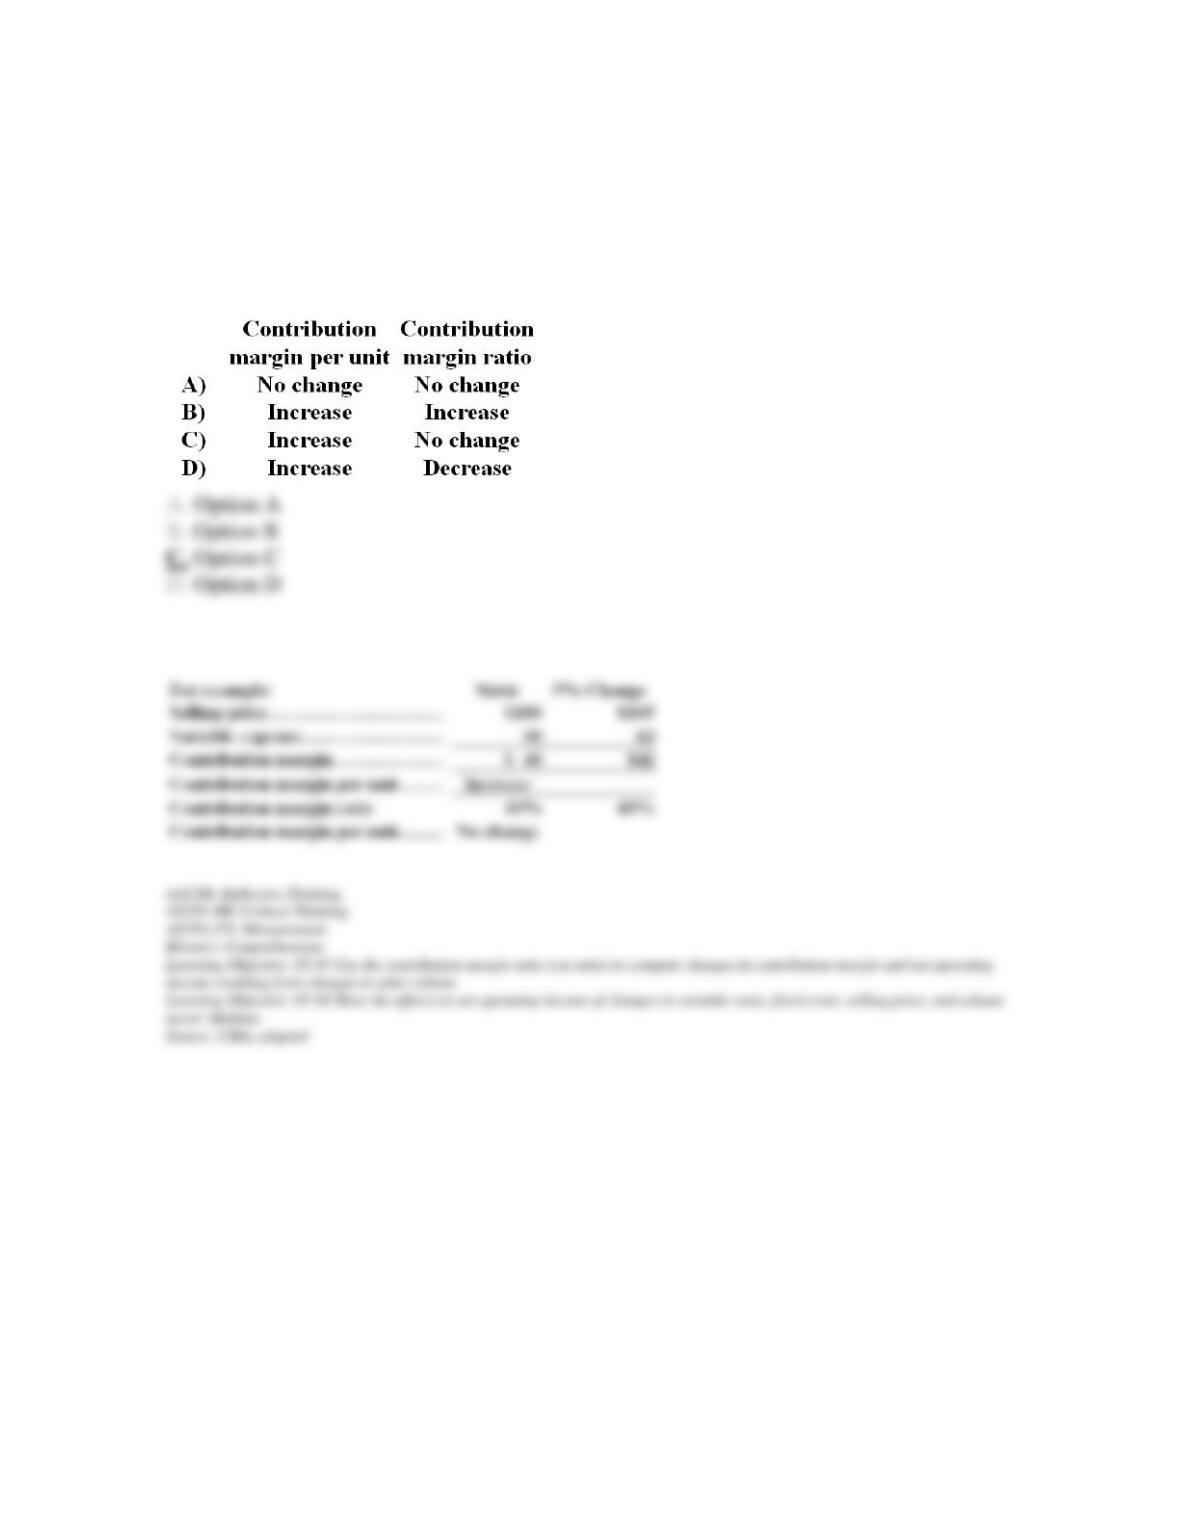
22. East Company manufactures and sells a single product with a positive contribution
margin. If the selling price and the variable expense per unit both increase 5% and fixed
expenses do not change, what is the effect on the contribution margin per unit and the
contribution margin ratio?
Chapter 05 – Cost-Volume-Profit Relationships
5-9
23. Which of the following formulas is used to calculate the contribution margin ratio?
Chapter 05 – Cost-Volume-Profit Relationships
5-10
24. Brasher Company manufactures and sells a single product that has a positive contribution
margin. If the selling price and variable expenses both decrease by 5% and fixed expenses do
not change, then what would be the effect on the contribution margin per unit and the
contribution margin ratio?
Chapter 05 – Cost-Volume-Profit Relationships
5-11
25. The break-even point in unit sales is found by dividing total fixed expenses by:
26. Break-even analysis assumes that:
27. If Q equals the level of output, P is the selling price per unit, V is the variable expense per
unit, and F is the fixed expense, then the break-even point in units is:
Chapter 05 – Cost-Volume-Profit Relationships
5-12
28. The break-even point in unit sales increases when variable expenses:
29. The margin of safety percentage is computed as:
30. The amount by which a company’s sales can decline before losses are incurred is called
the:
Chapter 05 – Cost-Volume-Profit Relationships
5-13
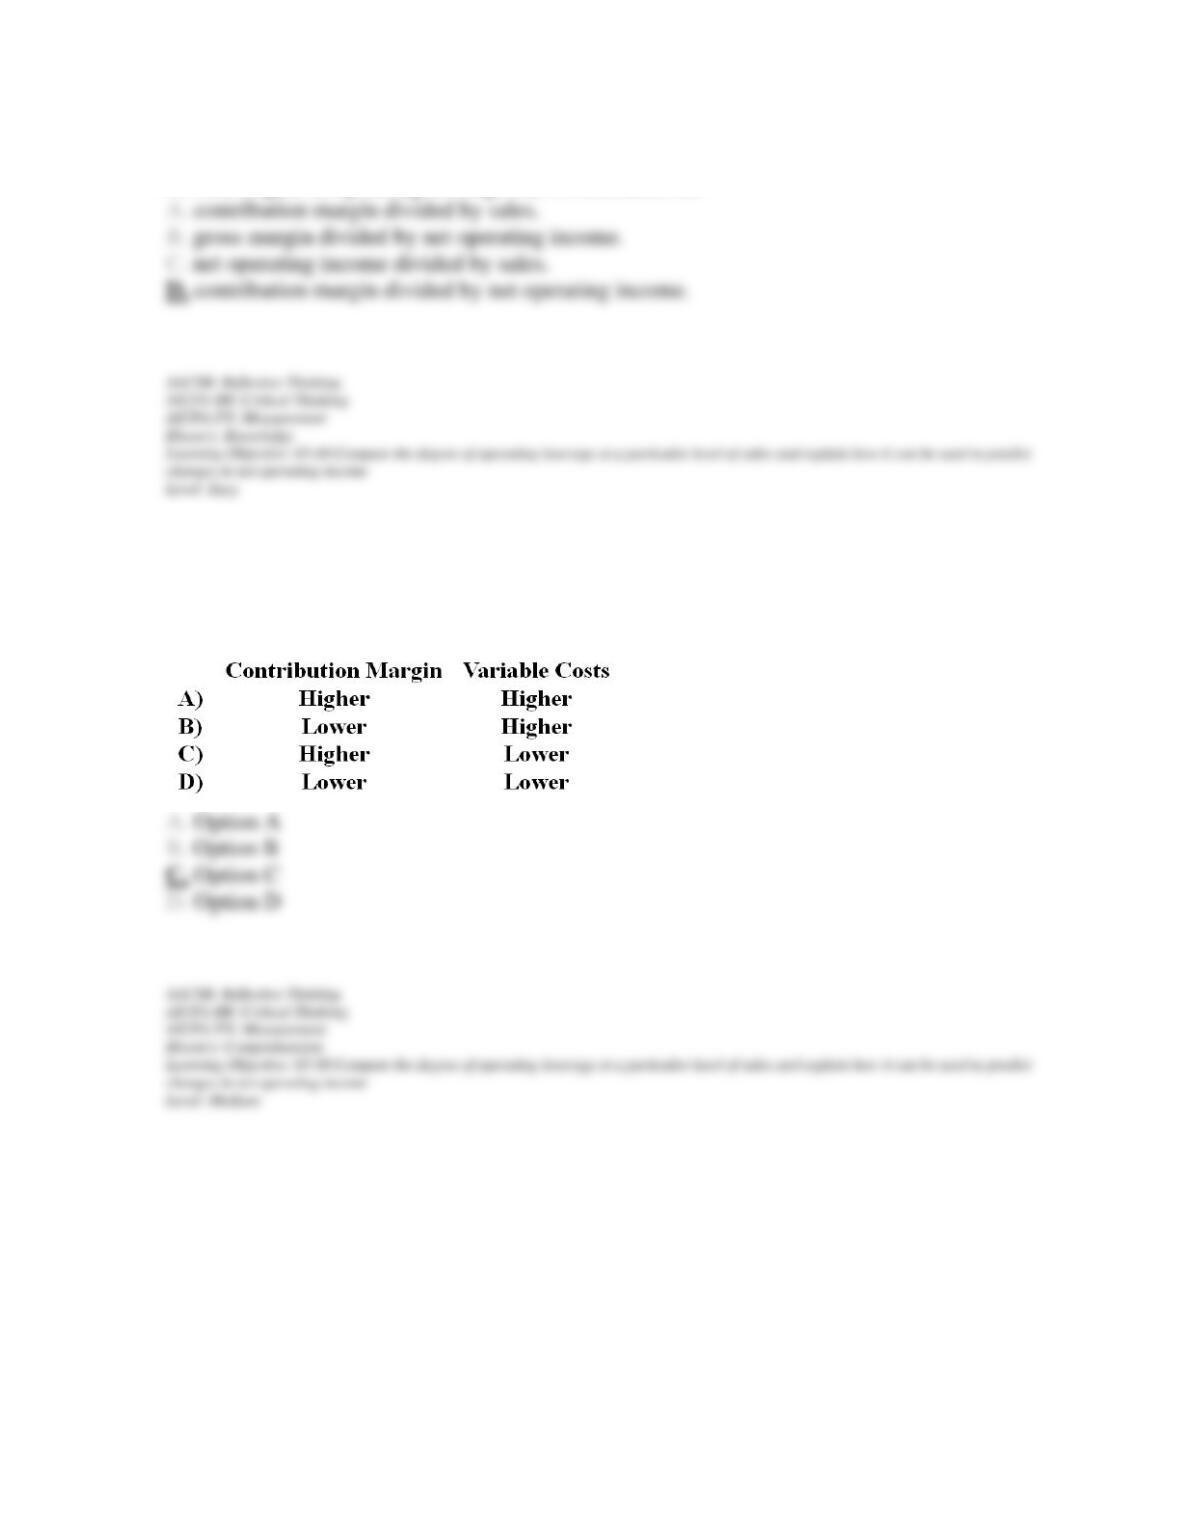
31. The degree of operating leverage can be calculated as:
32. All other things the same, which of the following would be true of the contribution margin
and variable expenses of a company with high fixed costs and low variable costs as compared
to a company with low fixed costs and high variable costs?
Chapter 05 – Cost-Volume-Profit Relationships
5-14
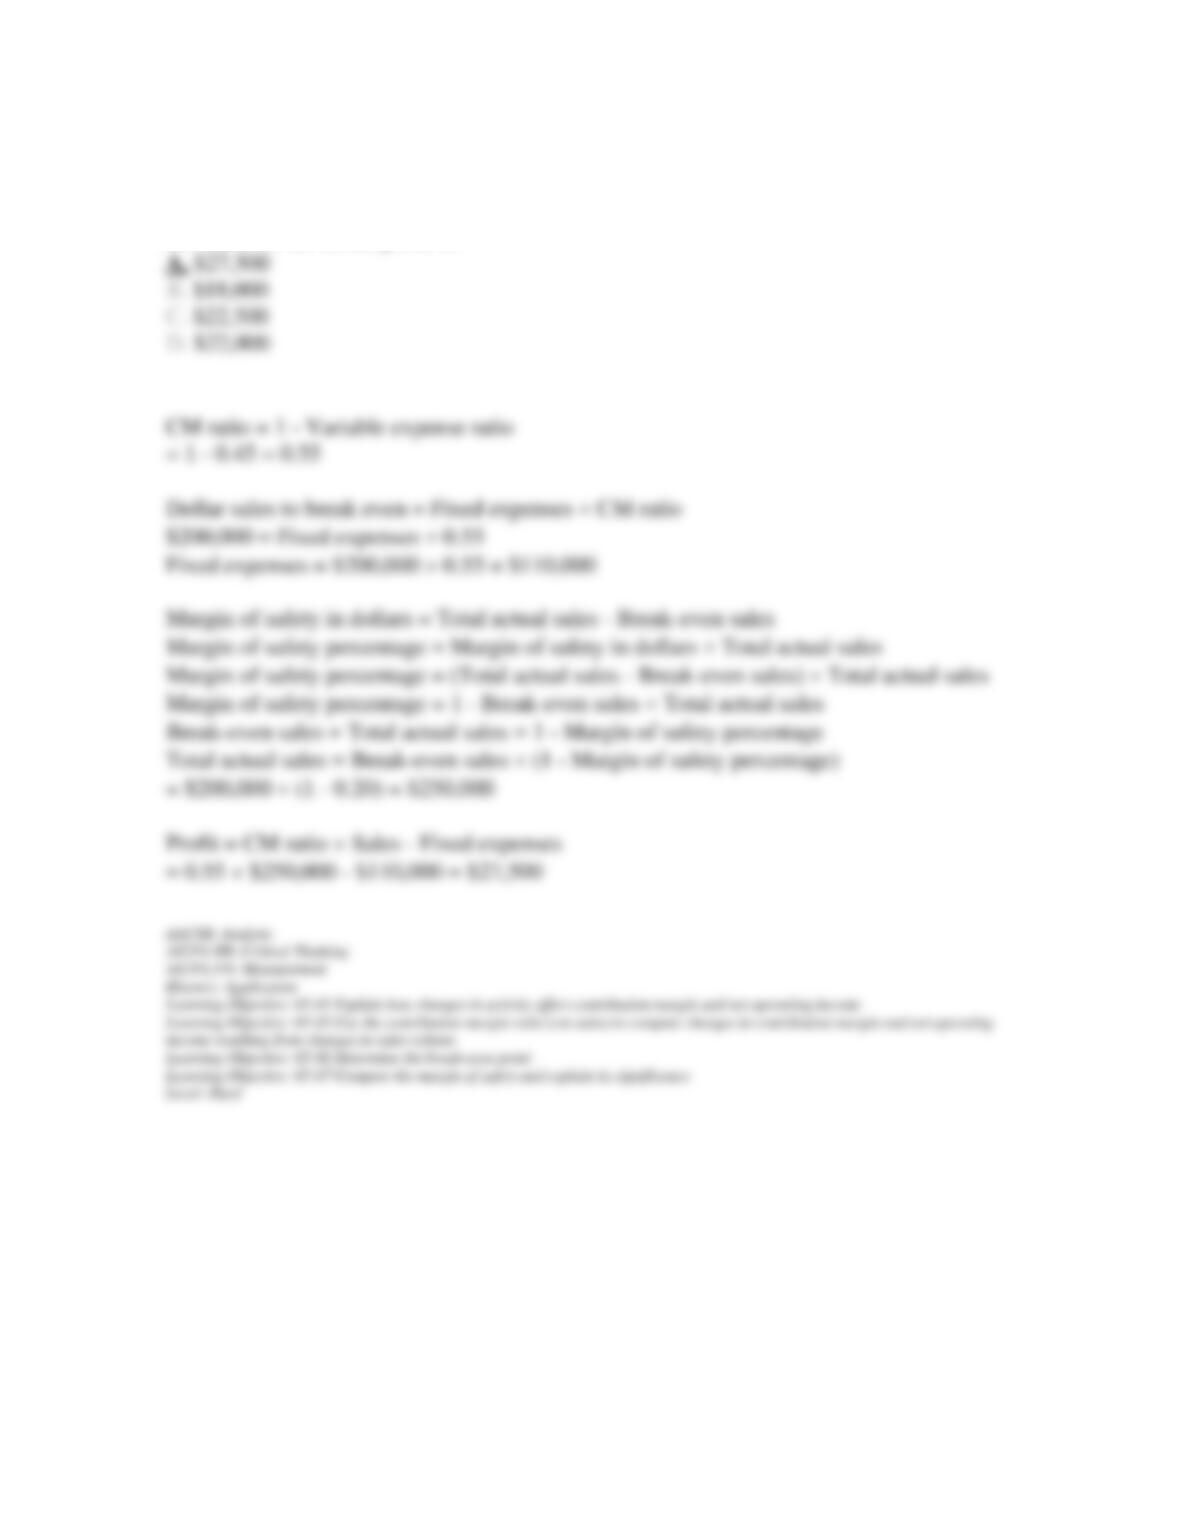
33. James Company has a margin of safety percentage of 20% based on its actual sales. The
break-even point is $200,000 and the variable expenses are 45% of sales. Given this
information, the actual profit is:
Chapter 05 – Cost-Volume-Profit Relationships
5-15
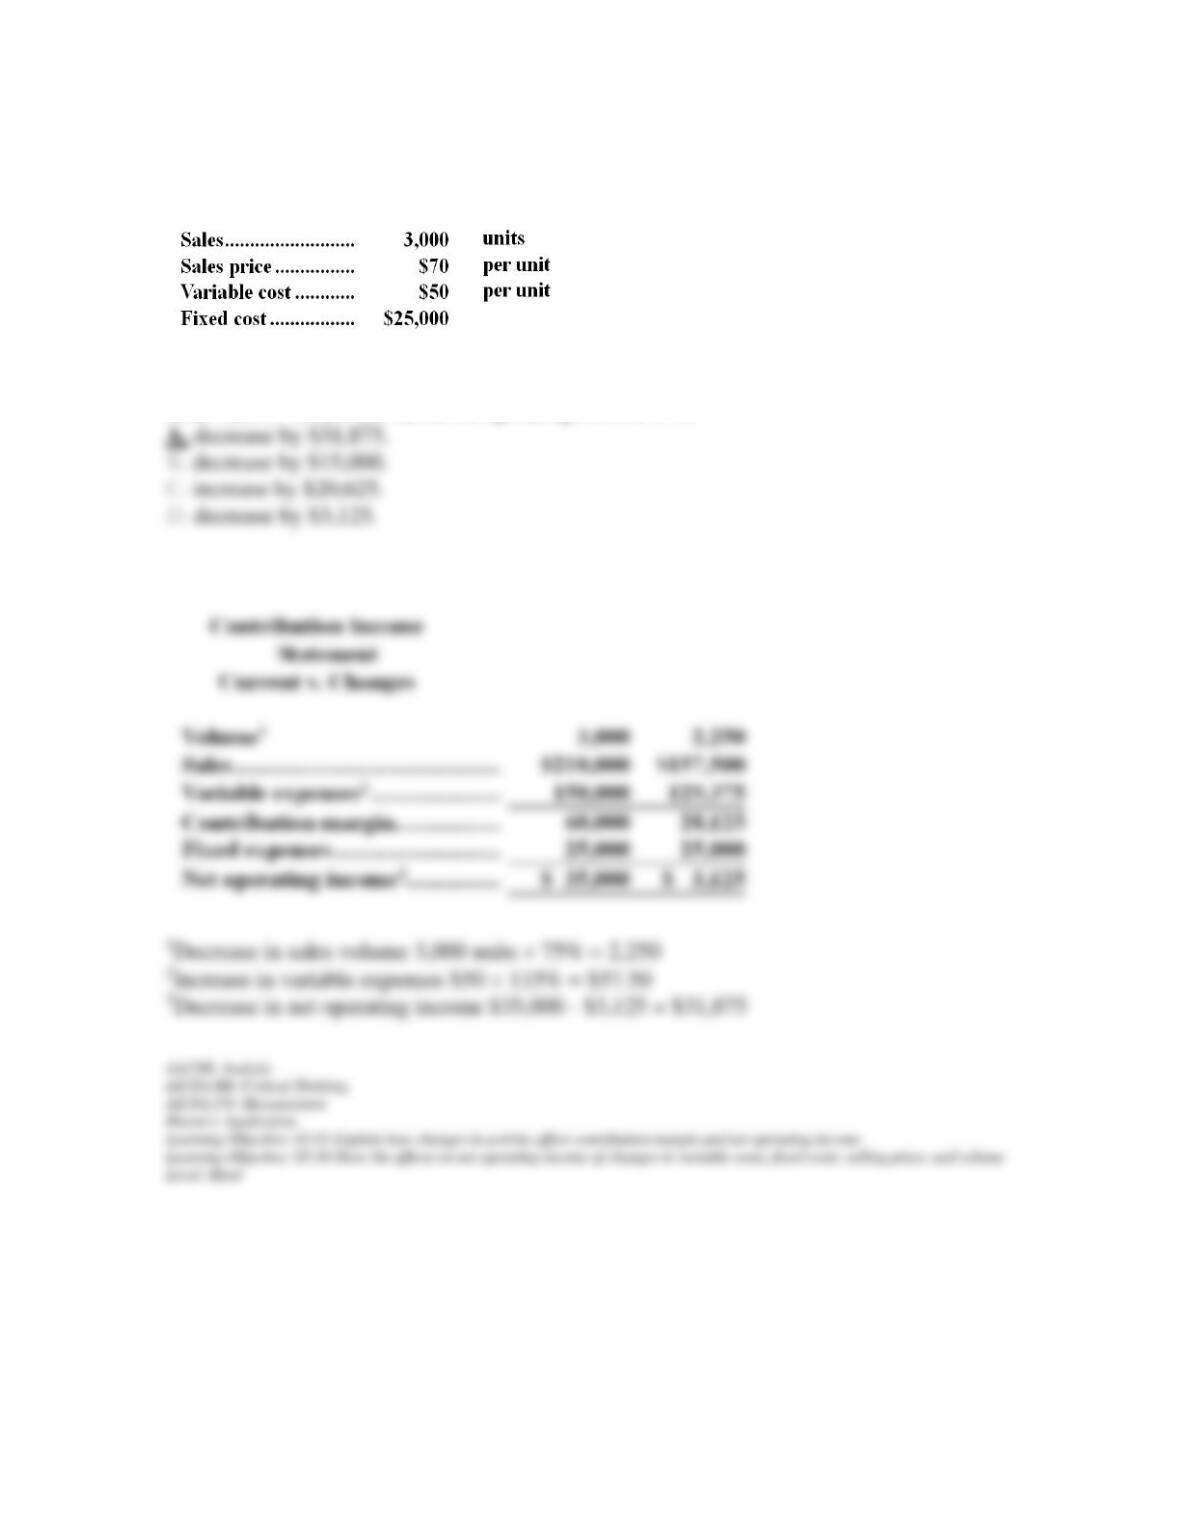
34. A company has provided the following data:
If the sales volume decreases by 25%, the variable cost per unit increases by 15%, and all
other factors remain the same, net operating income will:
Chapter 05 – Cost-Volume-Profit Relationships
5-16
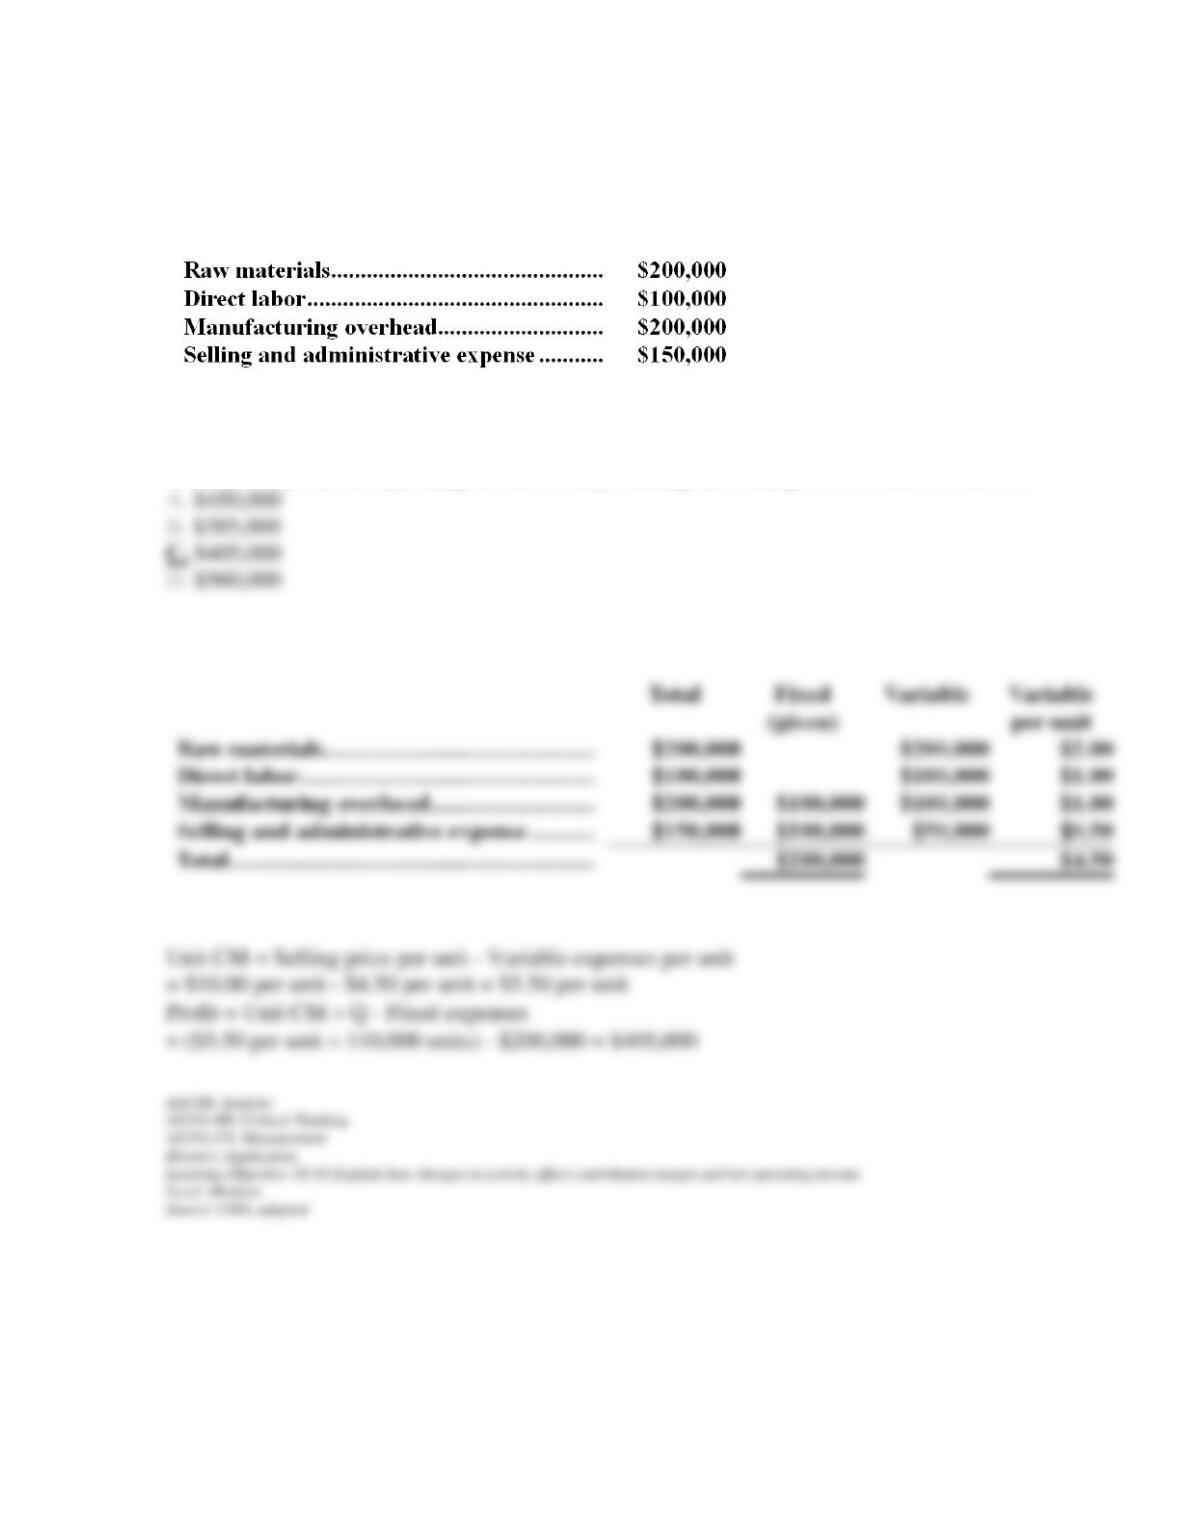
35. Butteco Corporation has provided the following cost data for last year when 100,000 units
were produced and sold:
All costs are variable except for $100,000 of manufacturing overhead and $100,000 of selling
and administrative expense. There are no beginning or ending inventories. If the selling price
is $10 per unit, the net operating income from producing and selling 110,000 units would be:
Chapter 05 – Cost-Volume-Profit Relationships
5-17
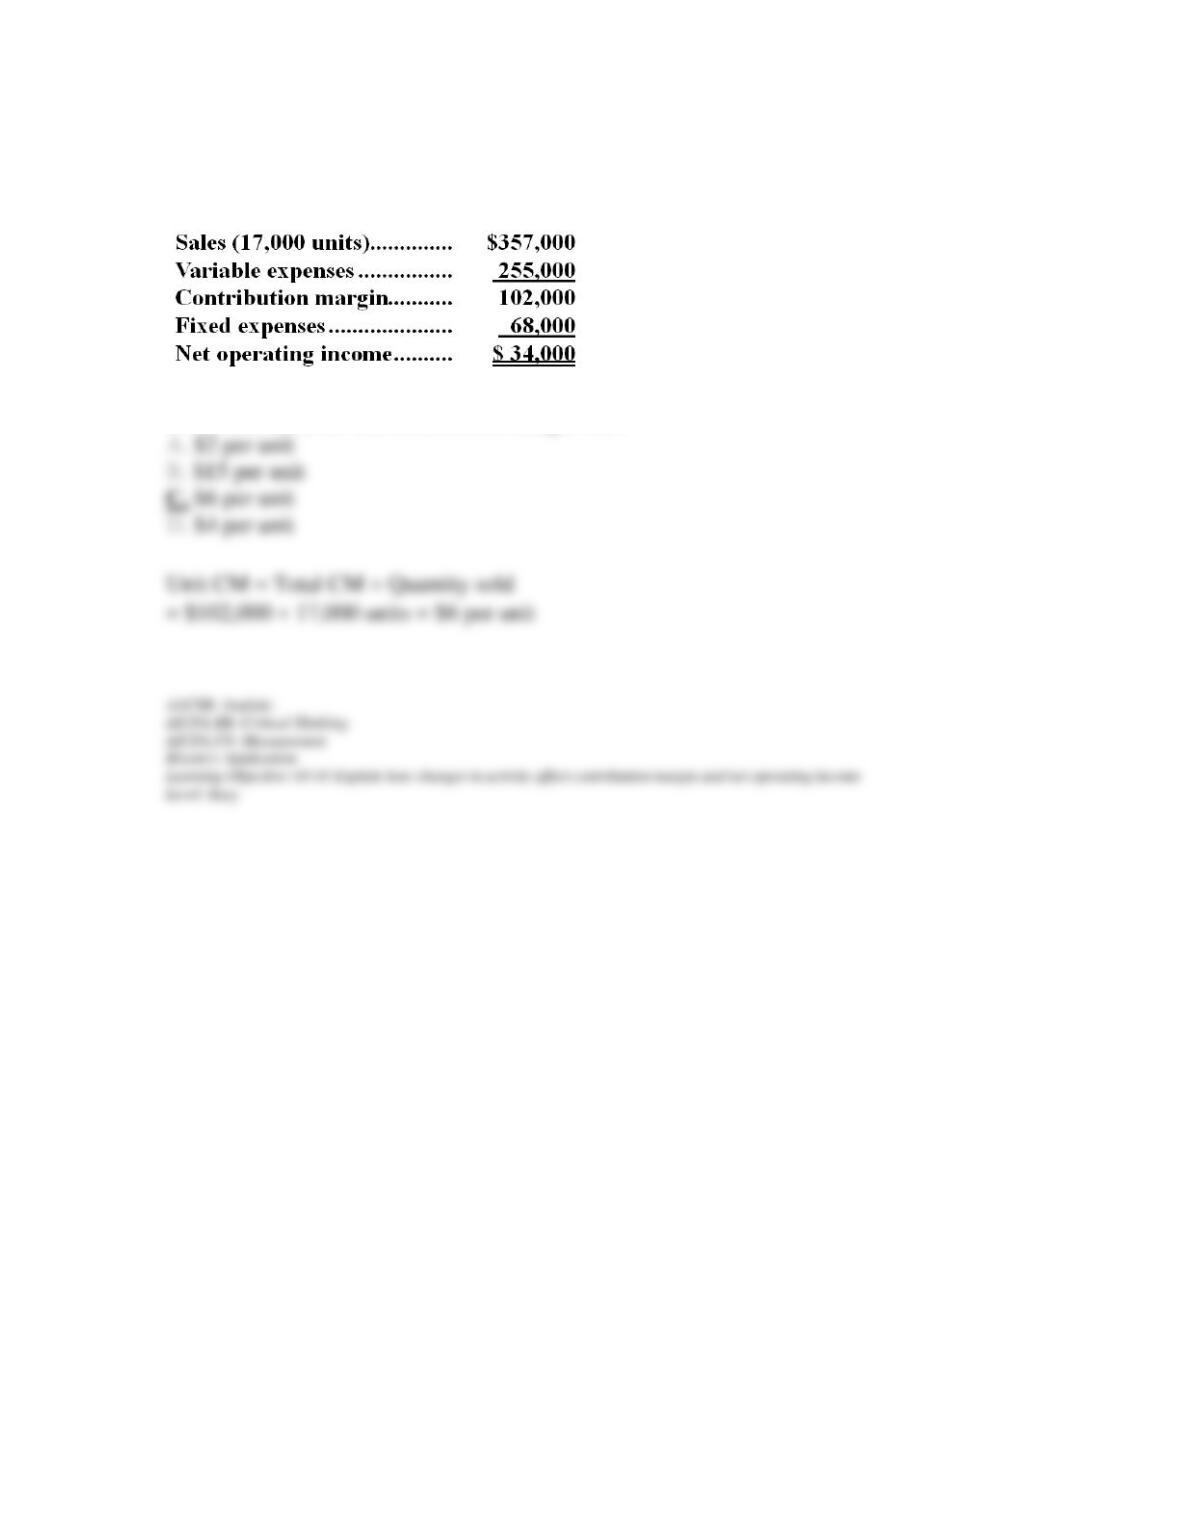
36. Menlove Company had the following income statement for the most recent year:
Given this data, the unit contribution margin was:
Chapter 05 – Cost-Volume-Profit Relationships
5-18
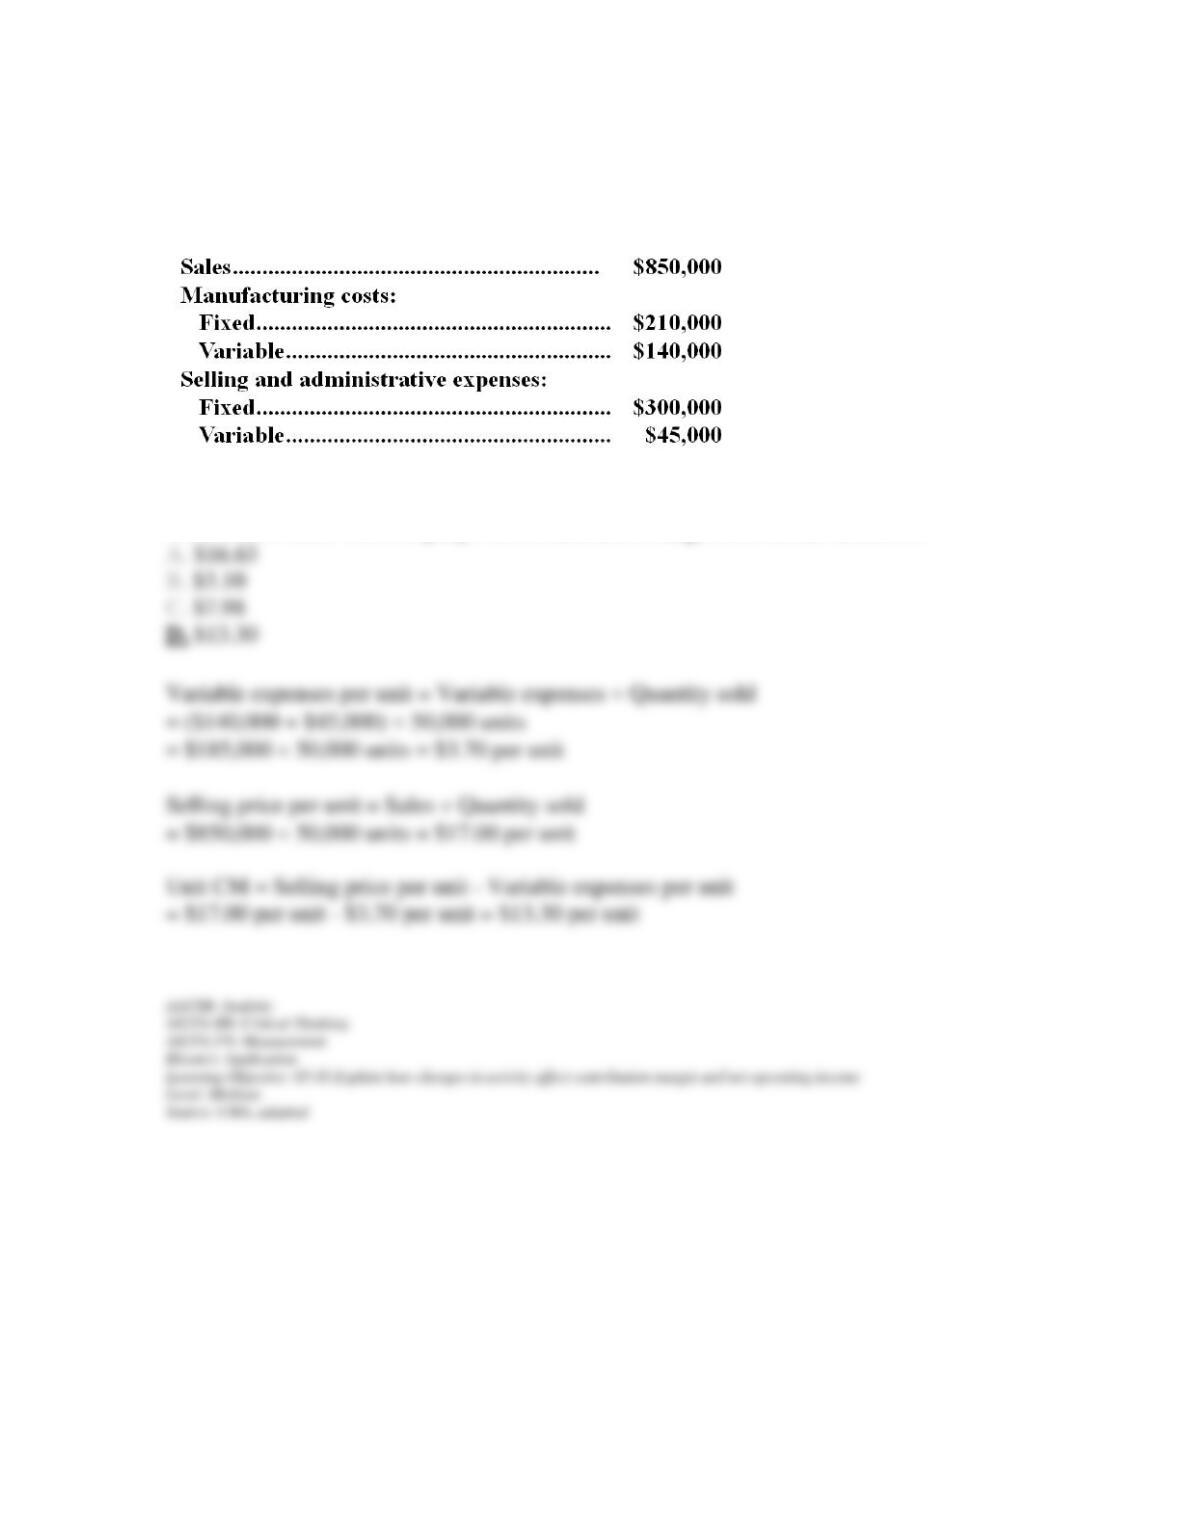
37. The following information relates to Clyde Corporation which produced and sold 50,000
units last month.
There were no beginning or ending inventories. Production and sales next month are expected
to be 40,000 units. The company’s unit contribution margin next month should be:
Chapter 05 – Cost-Volume-Profit Relationships
5-19
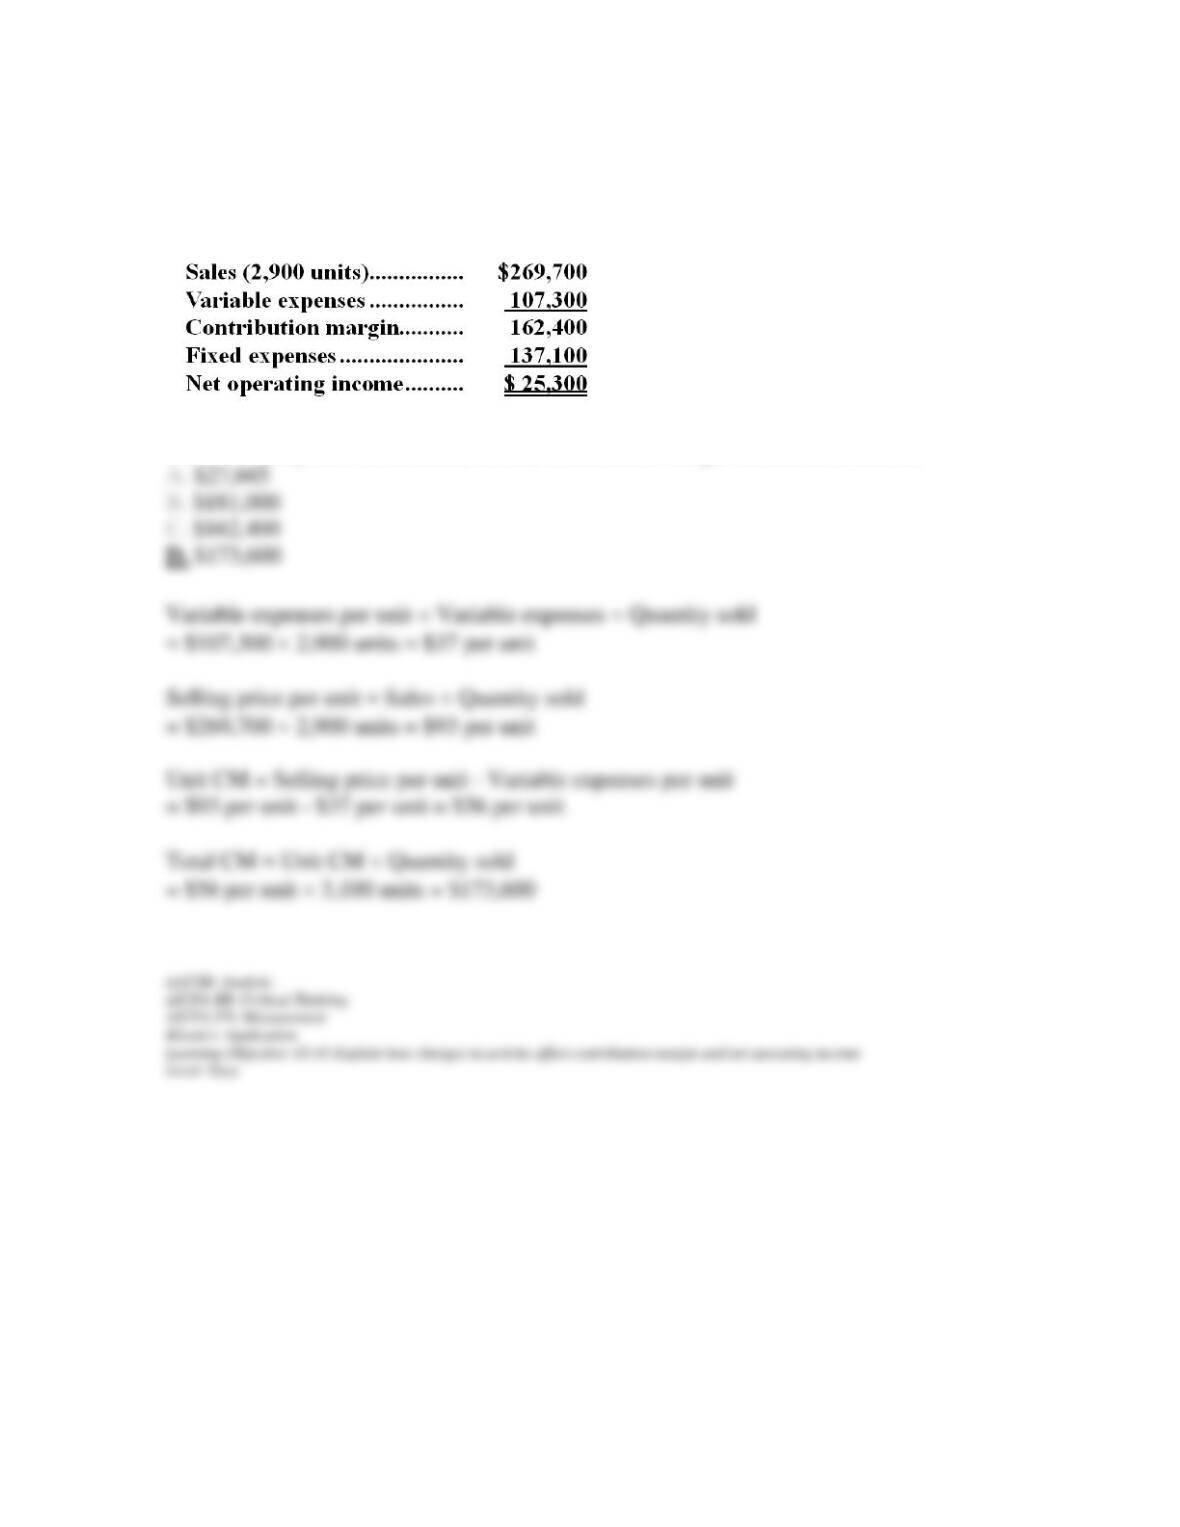
38. Mancuso Corporation has provided its contribution format income statement for January.
The company produces and sells a single product.
If the company sells 3,100 units, its total contribution margin should be closest to:
Chapter 05 – Cost-Volume-Profit Relationships
5-20
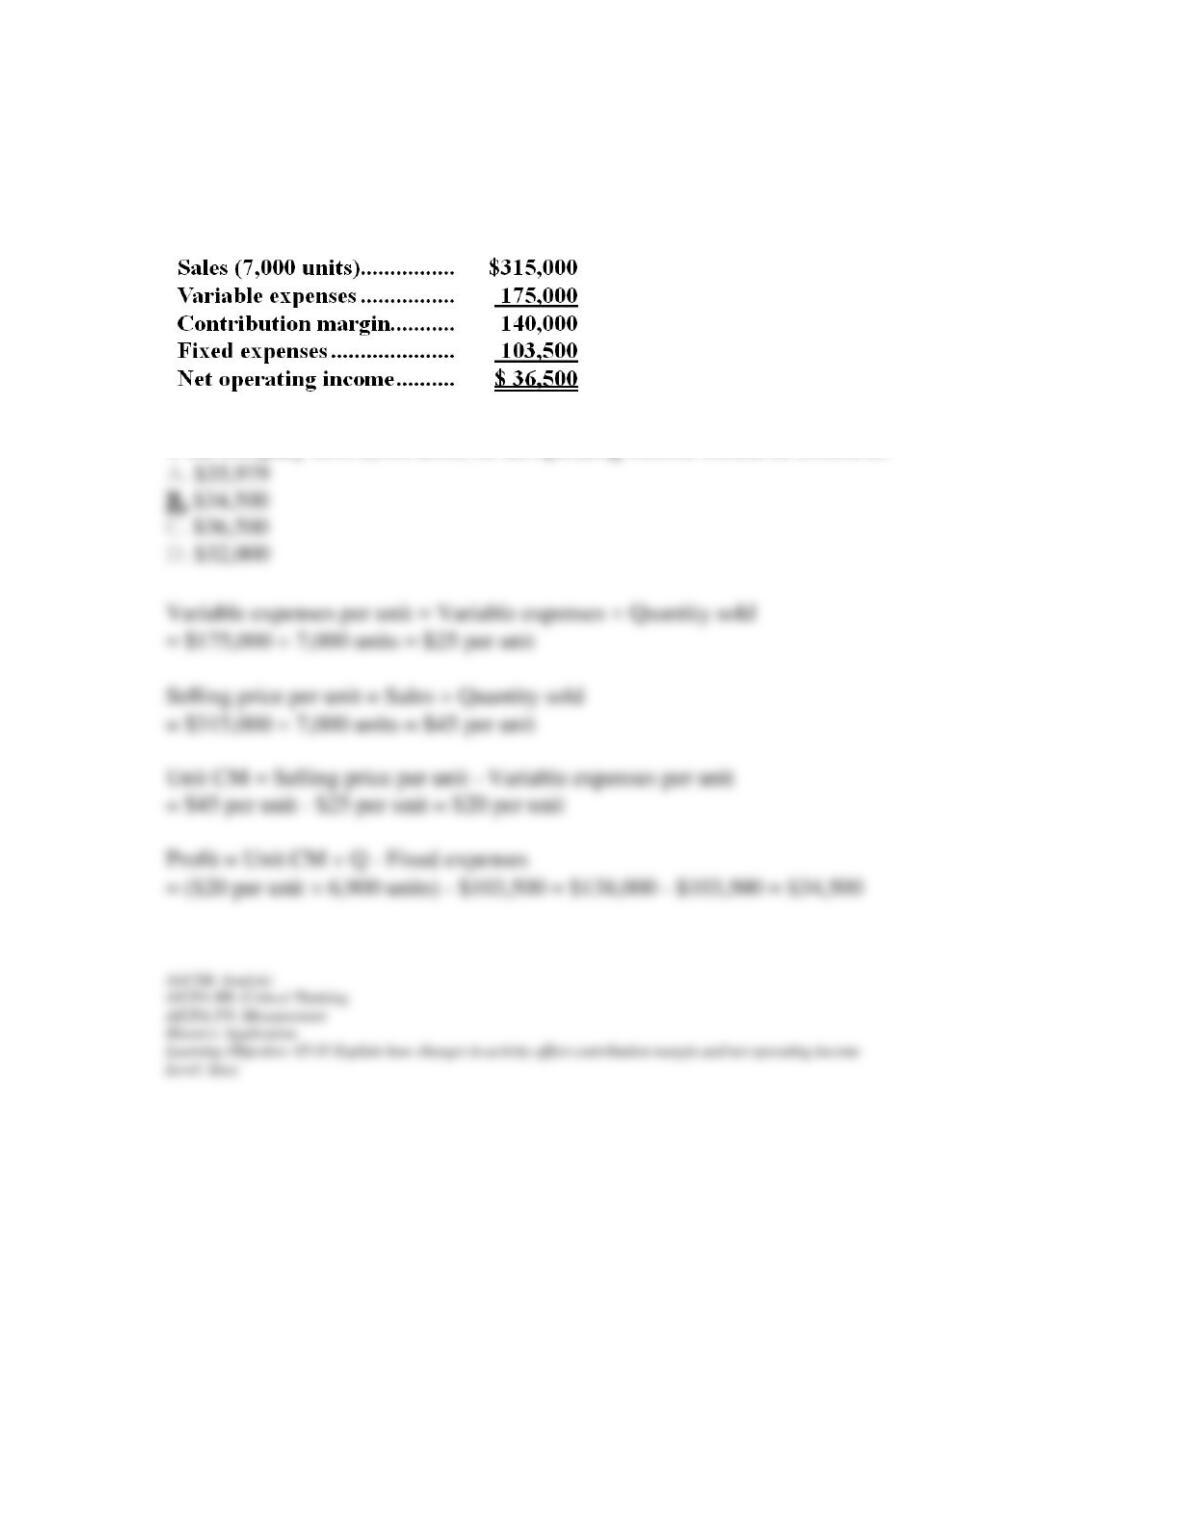
39. Dimitrov Corporation, a company that produces and sells a single product, has provided
its contribution format income statement for July.
If the company sells 6,900 units, its net operating income should be closest to: