Exam
Name___________________________________
MULTIPLE CHOICE. Choose the one alternative that best completes the statement or answers the question.
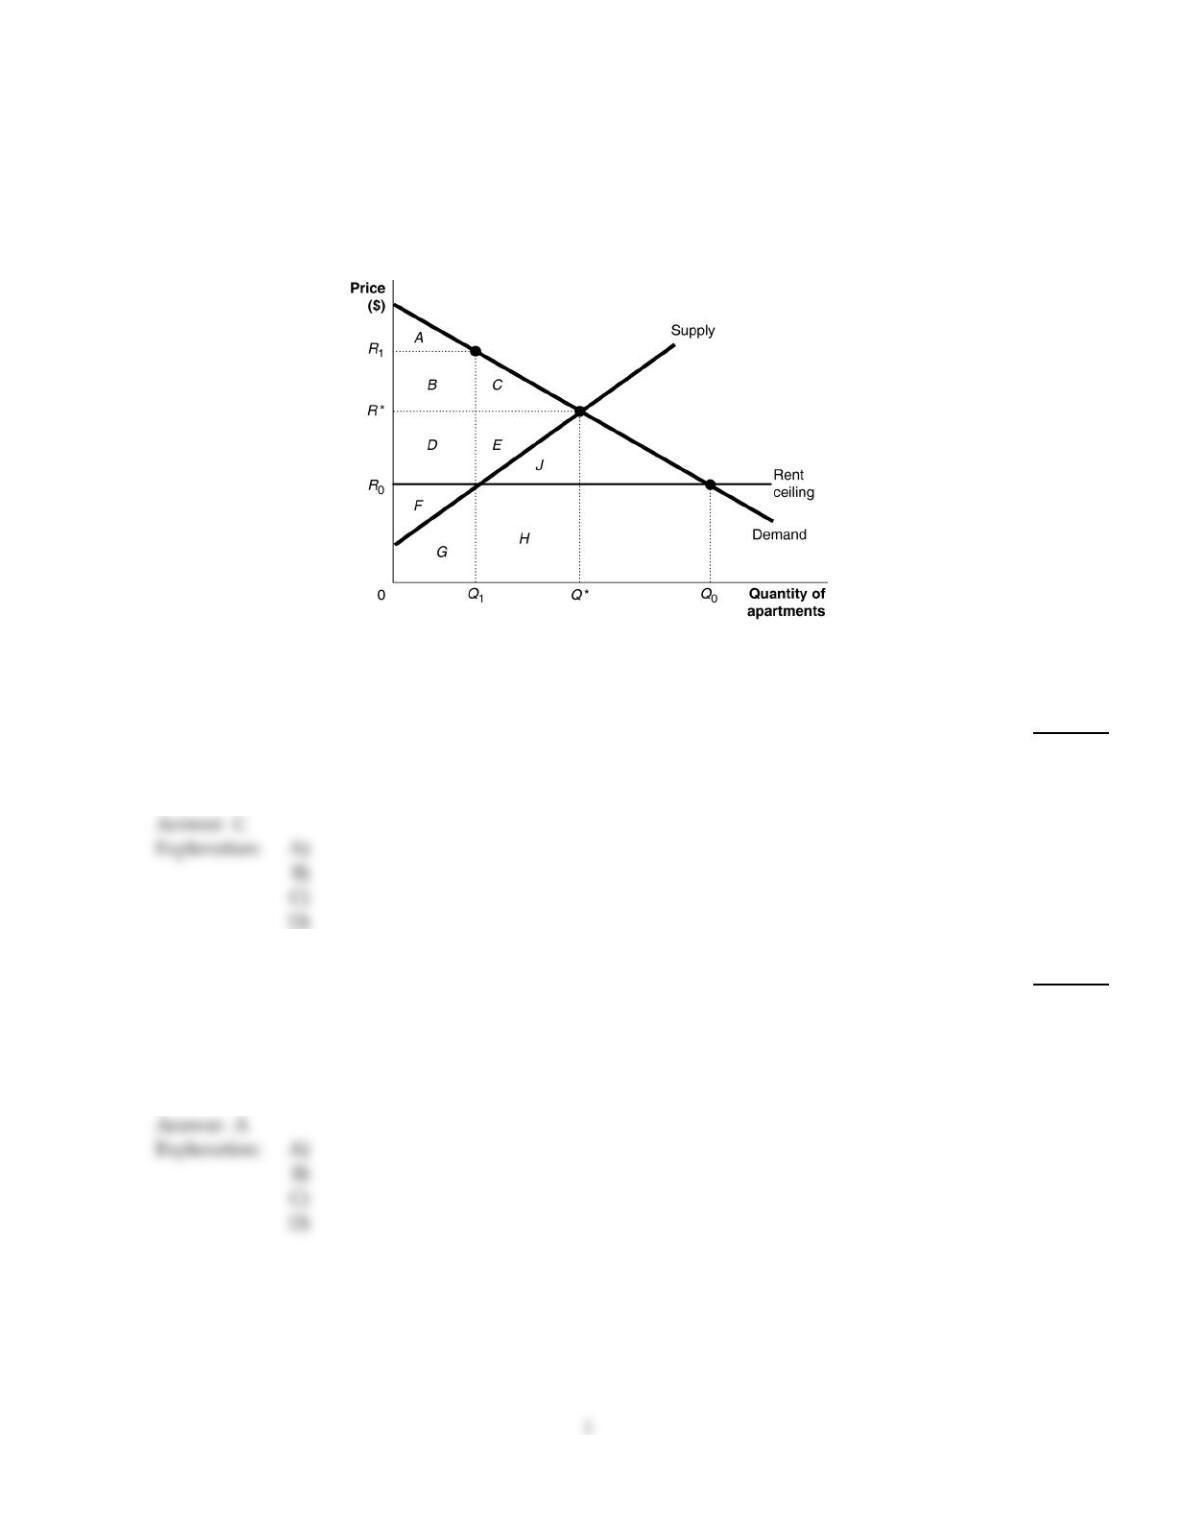
Figure 4–6
Figure 4–6 shows the market for apartments in Bay City. Recently, the government imposed a rent ceiling at R0.
1)
Refer to Figure 4–6. What is the area that represents the producer surplus after the imposition of
the ceiling?
1)
A)
D+F+G
B)
A+B+ D +F+G
C)
F
D)
F + G
2)
What are property rights?
2)
A)
The rights individuals or firms have to the exclusive use of their property, including the right
to buy or sell it.
B)
The title to ownership of any physical asset.
C)
The right of the government to appropriate private assets for the good of society.
D)
A legal document verifying ownership of intangible assets.
3)
If policymakers use a pollution tax to control pollution, the tax per unit of pollution should be set
3)
A)
equal to the marginal private cost of production at the economically efficient level of
pollution.
B)
at a level low enough so that producers can pass along a portion of the additional cost onto
consumers without significantly reducing demand for the product.
C)
equal to the amount of the deadweight loss created in the absence of a pollution tax.
D)
equal to the marginal external cost at the economically efficient level of pollution.
4)
Which of the following statements is false?
4)
A)
Private costs are borne by the producer of the good or service.
B)
Social benefits are external benefits minus private benefits.
C)
Private benefits are received by the consumer of the good or service.
D)
Social costs are private costs and any external costs.
Figure 4–1
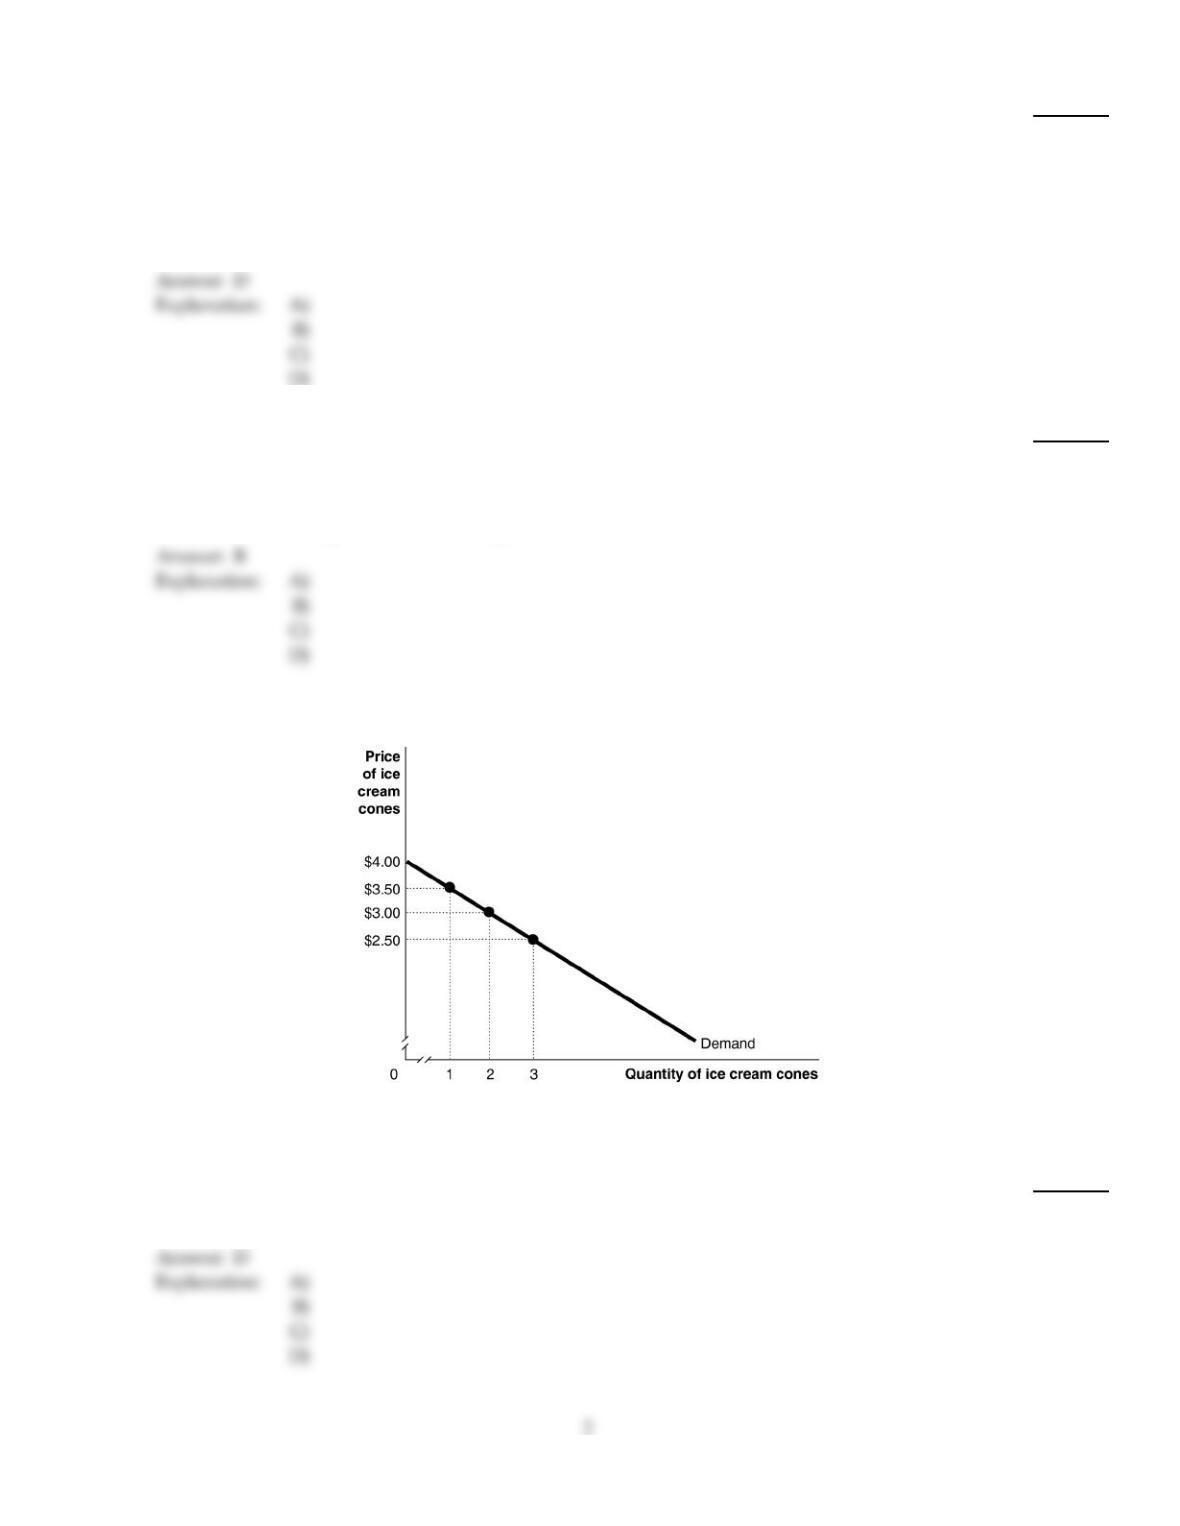
Figure 4–1 shows Kendra‘s demand curve for ice–cream cones curve.
5)
Refer to Figure 4–1. If the market price is $2.50, what is the consumer surplus on the second ice
cream cone?
5)
A)
$10.50
B)
$3.00
C)
$1.50
D)
$0.50
6)
Consumers are willing to purchase a product up to the point where
6)
A)
the marginal benefit of consuming a product is equal to its price.
B)
the consumer surplus is equal to the producer surplus.
C)
the marginal benefit of consuming the product is equal to the marginal cost of consuming it.
D)
the marginal benefit of consuming the product equals the area below the supply curve and
above the market price.
7)
Economic surplus is maximized in a competitive market when
7)
A)
producers sell the quantity that consumers are willing to buy.
B)
the deadweight loss equals the sum of consumer surplus and producer surplus.
C)
marginal benefit equals marginal cost.
D)
demand is equal to supply.

Figure 4–10
Figure 4–10 shows a market with an externality. The current market equilibrium output of Q1 is not the economically
efficient output. The economically efficient output is Q2.
8)
Refer to Figure 4–10. Suppose the current market equilibrium output of Q1 is not the economically
efficient output because of an externality. The economically efficient output is Q2. In that case, the
diagram shows
8)
A)
the effect of an external cost imposed on a producer.
B)
the effect of a positive externality in the production of a good.
C)
the effect of a negative externality in the production of a good.
D)
the effect of an external benefit such as a subsidy granted to consumers of a good.
C
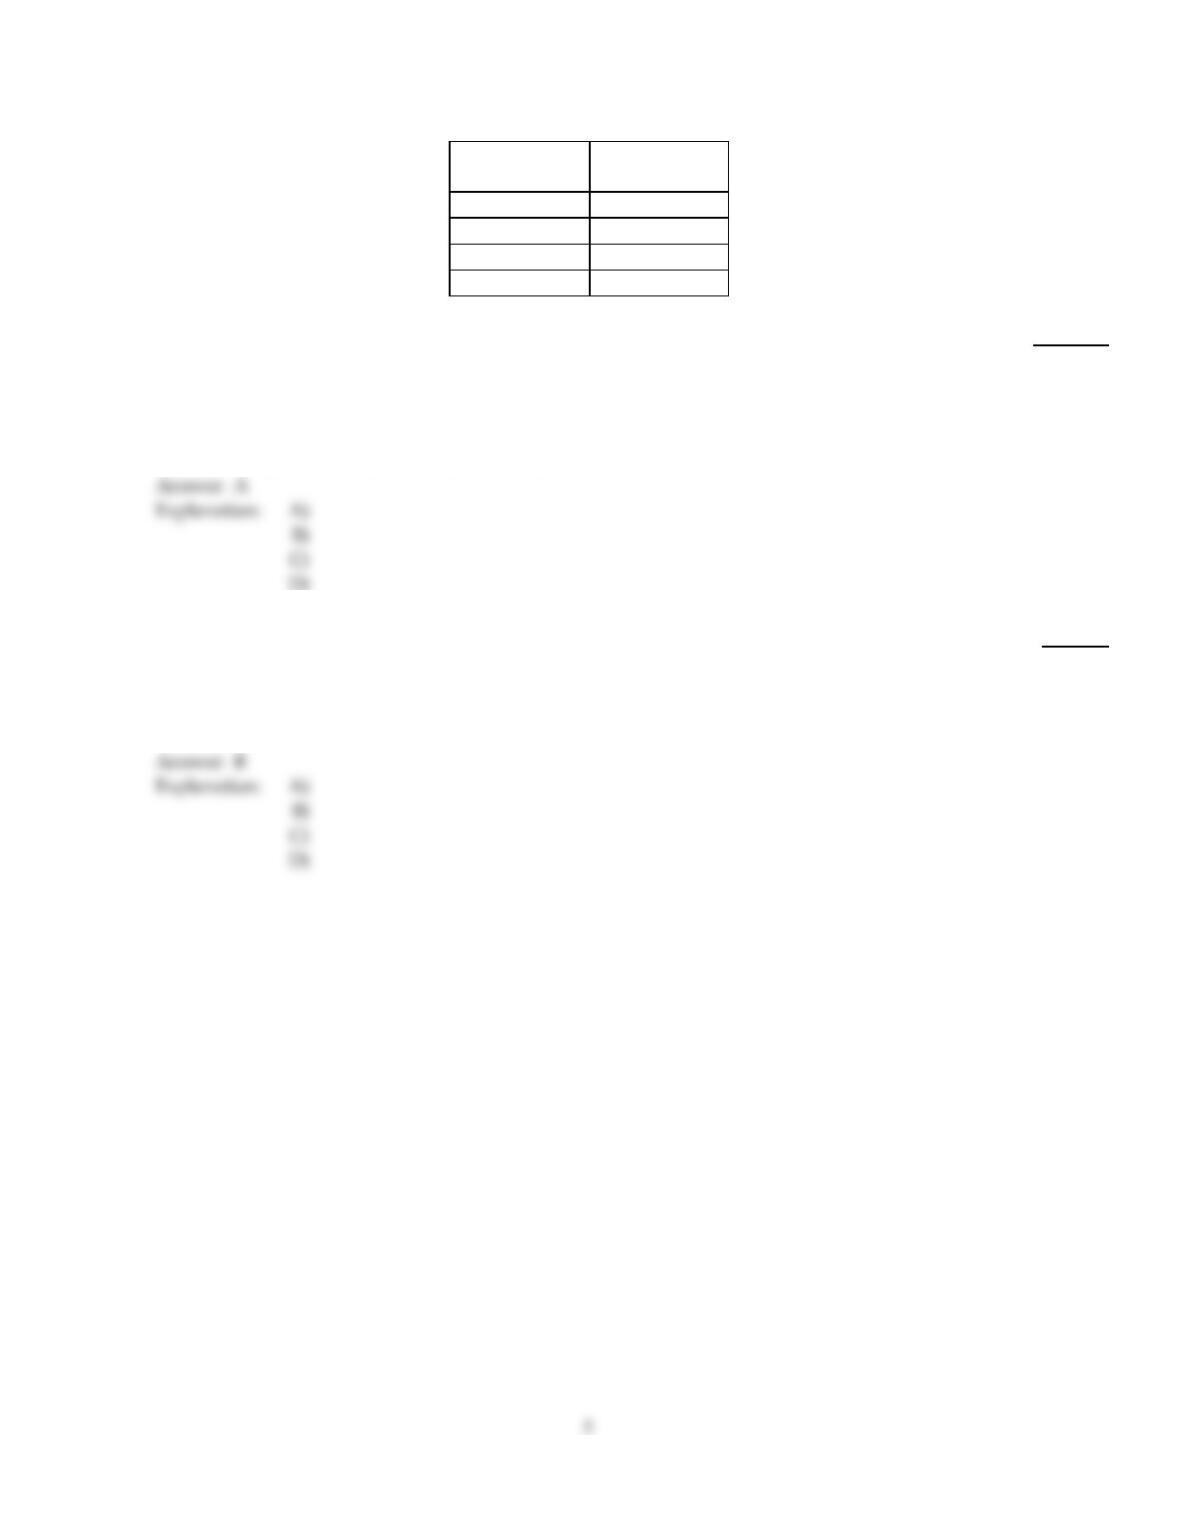
Table 4–2
Marko’s Polos
Marginal Cost
(Dollars)
1st shirt $7
2nd shirt 10
3rd shirt 15
4th shirt 20
9)
Refer to Table 4–2. The table above lists the marginal cost of polo shirts by Marko’s, a firm that
specializes in producing men’s clothing. If the price of polo shirts increases from $15 to $20
9)
A)
producer surplus will rise from $13 to $28.
B)
consumers will buy no polo shirts.
C)
there will be a surplus of polo shirts.
D)
the marginal cost of producing the third polo shirt will increase to $20.
10)
In which of these situations is there no deadweight loss?
10)
A)
consumption of a common resource without government restrictions
B)
free market production and consumption of a private good without any externalities
C)
free market production of a private good with a negative externality
D)
free market consumption of a private good with a positive externality
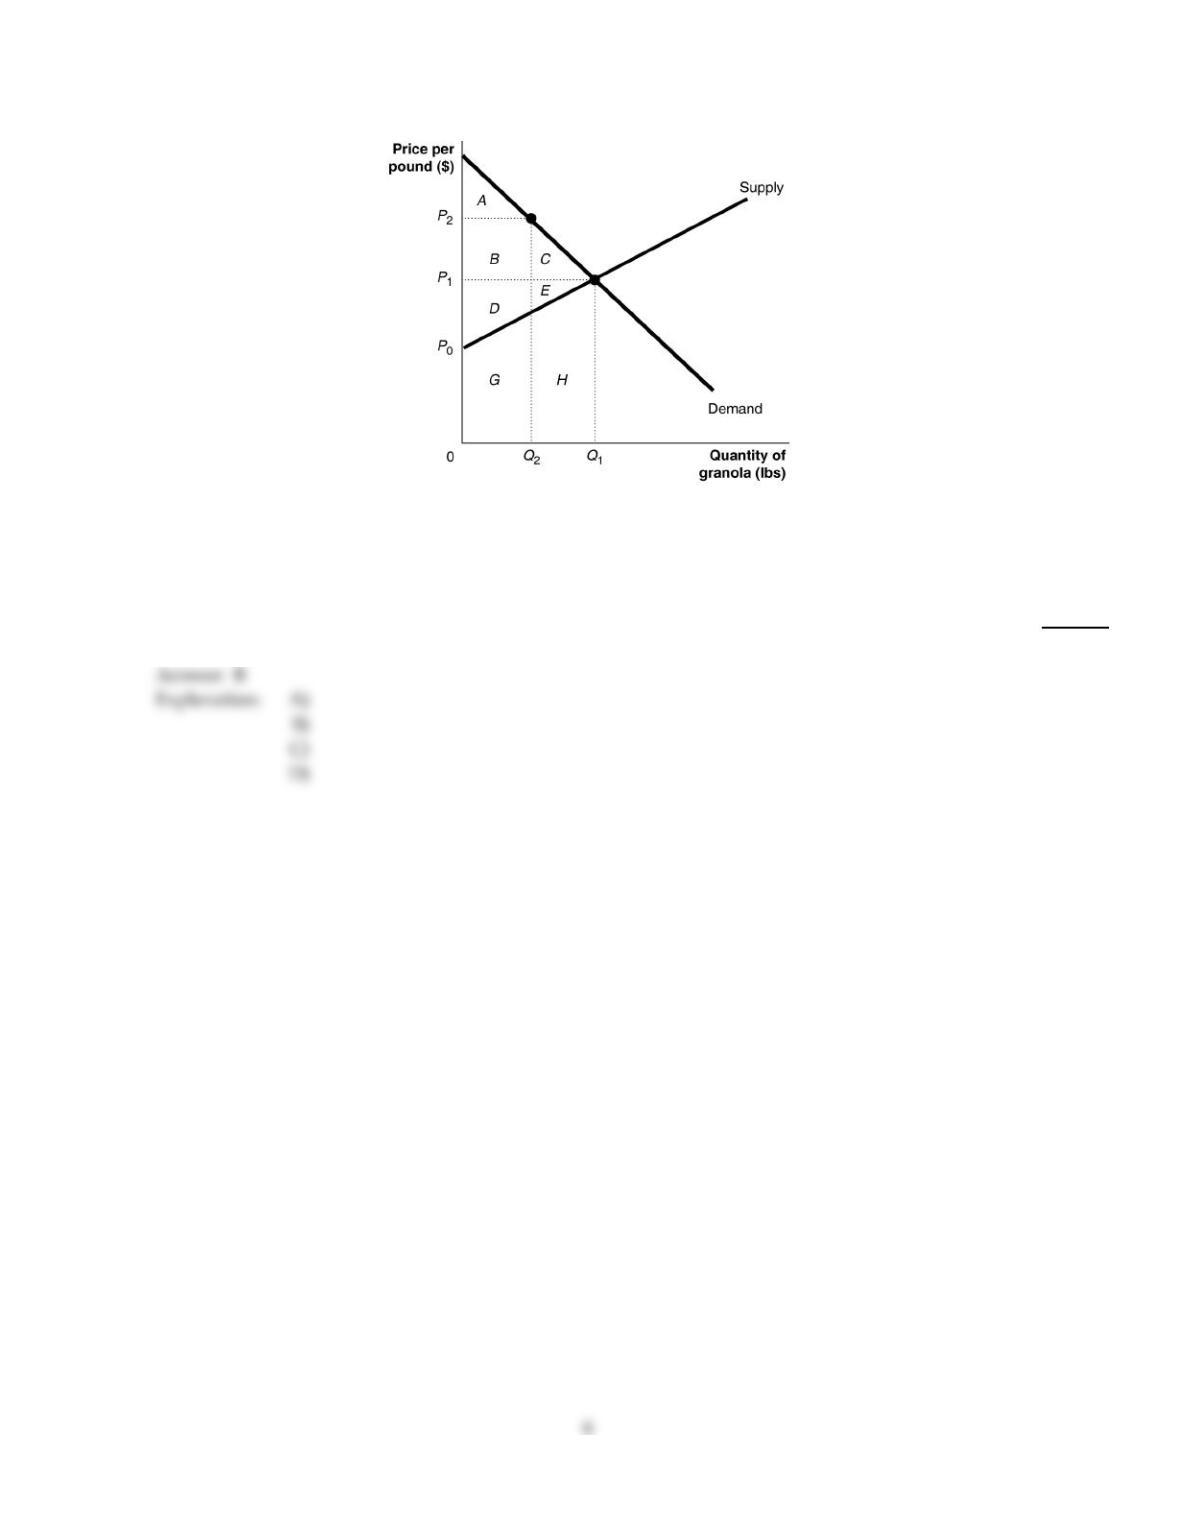
Figure 4–4
Figure 4–4 shows the market for granola. The market is initially in equilibrium at a price of P1 and a quantity of Q1. Now
suppose producers decide to cut output to Q2 in order to raise the price to P2.
11)
Refer to Figure 4–4. What area represents the deadweight loss at P2?
11)
A)
C+E+H
B)
C+E
C)
B+ C
D)
G+H
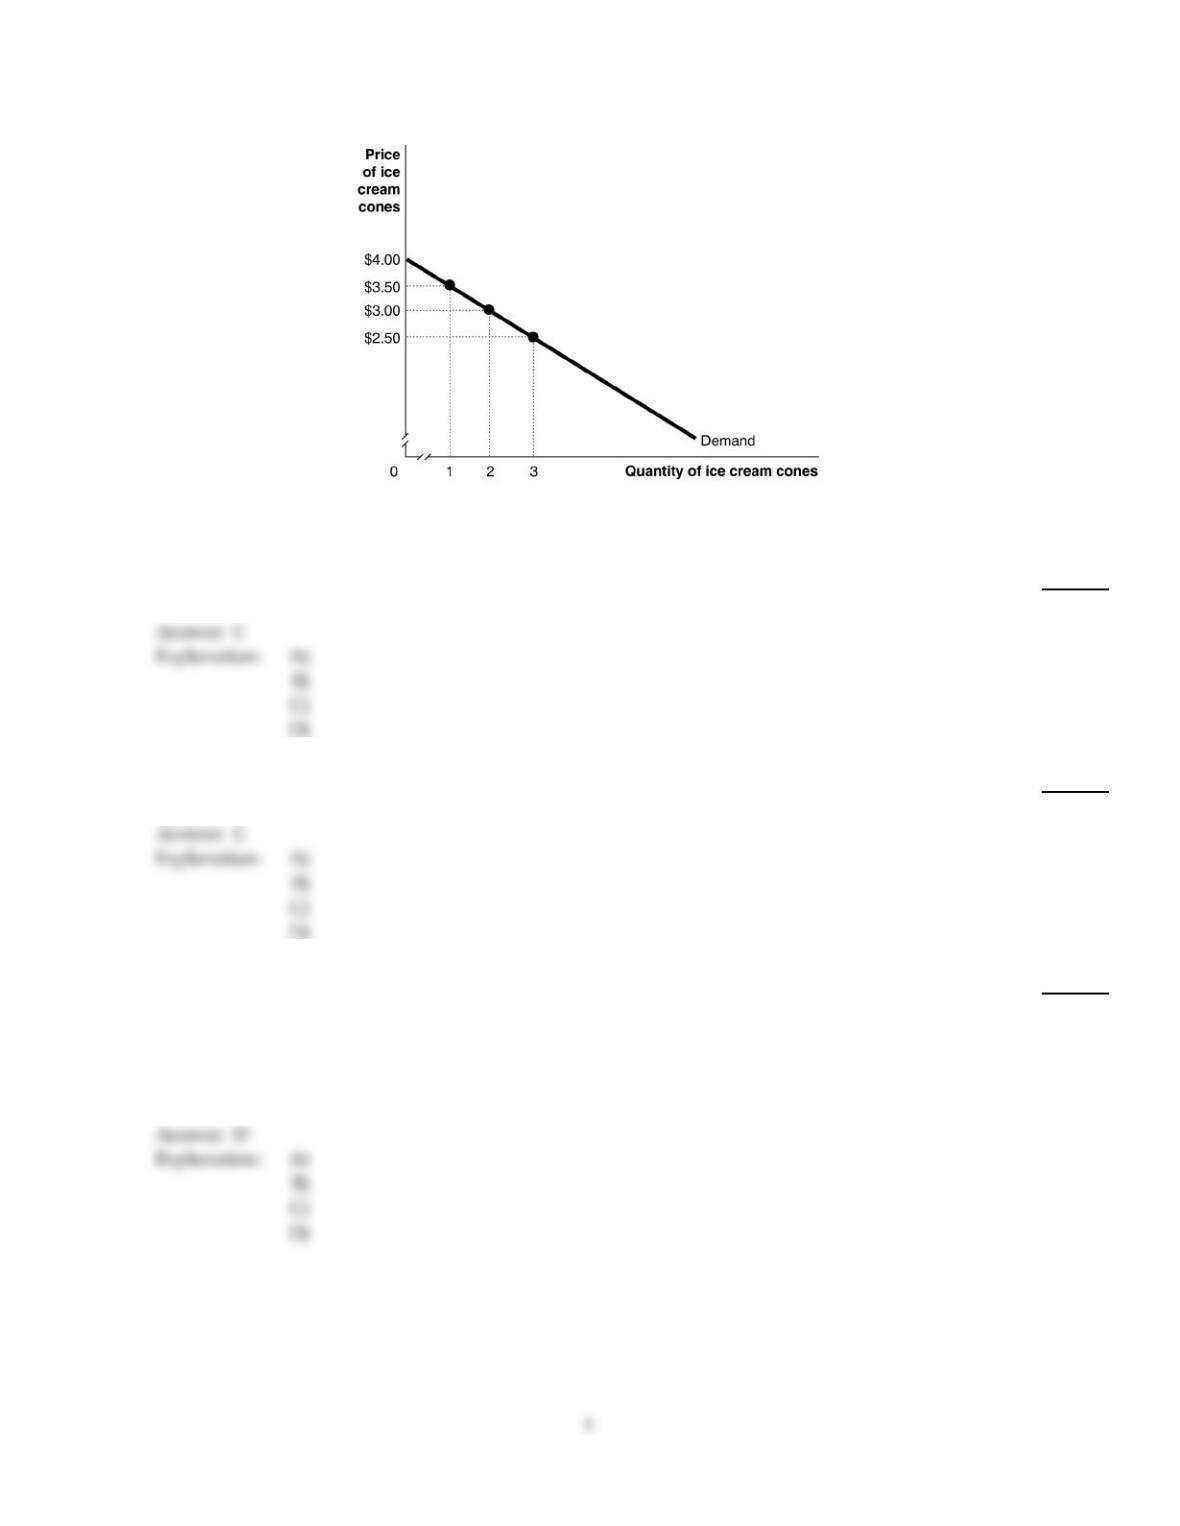
Figure 4–1
Figure 4–1 shows Kendra‘s demand curve for ice–cream cones curve.
12)
Refer to Figure 4–1. Kendra‘s marginal benefit from consuming the second ice cream cone is
12)
A)
$6.50
B)
$2.25
C)
$3.00
D)
$6.00
13)
Refer to Figure 4–1. What is the total amount that Kendra is willing to pay for 3 ice cream cones?
13)
A)
$7.50
B)
$2.50
C)
$9.00
D)
$13.50
14)
Government–imposed quantitative limits on the amount of pollution firms are allowed is an
example of
14)
A)
an allocatively efficient solution to pollution reduction.
B)
the Pigovian method of pollution control.
C)
a tradable emission allowance system of pollution control.
D)
a command and control approach to pollution reduction.
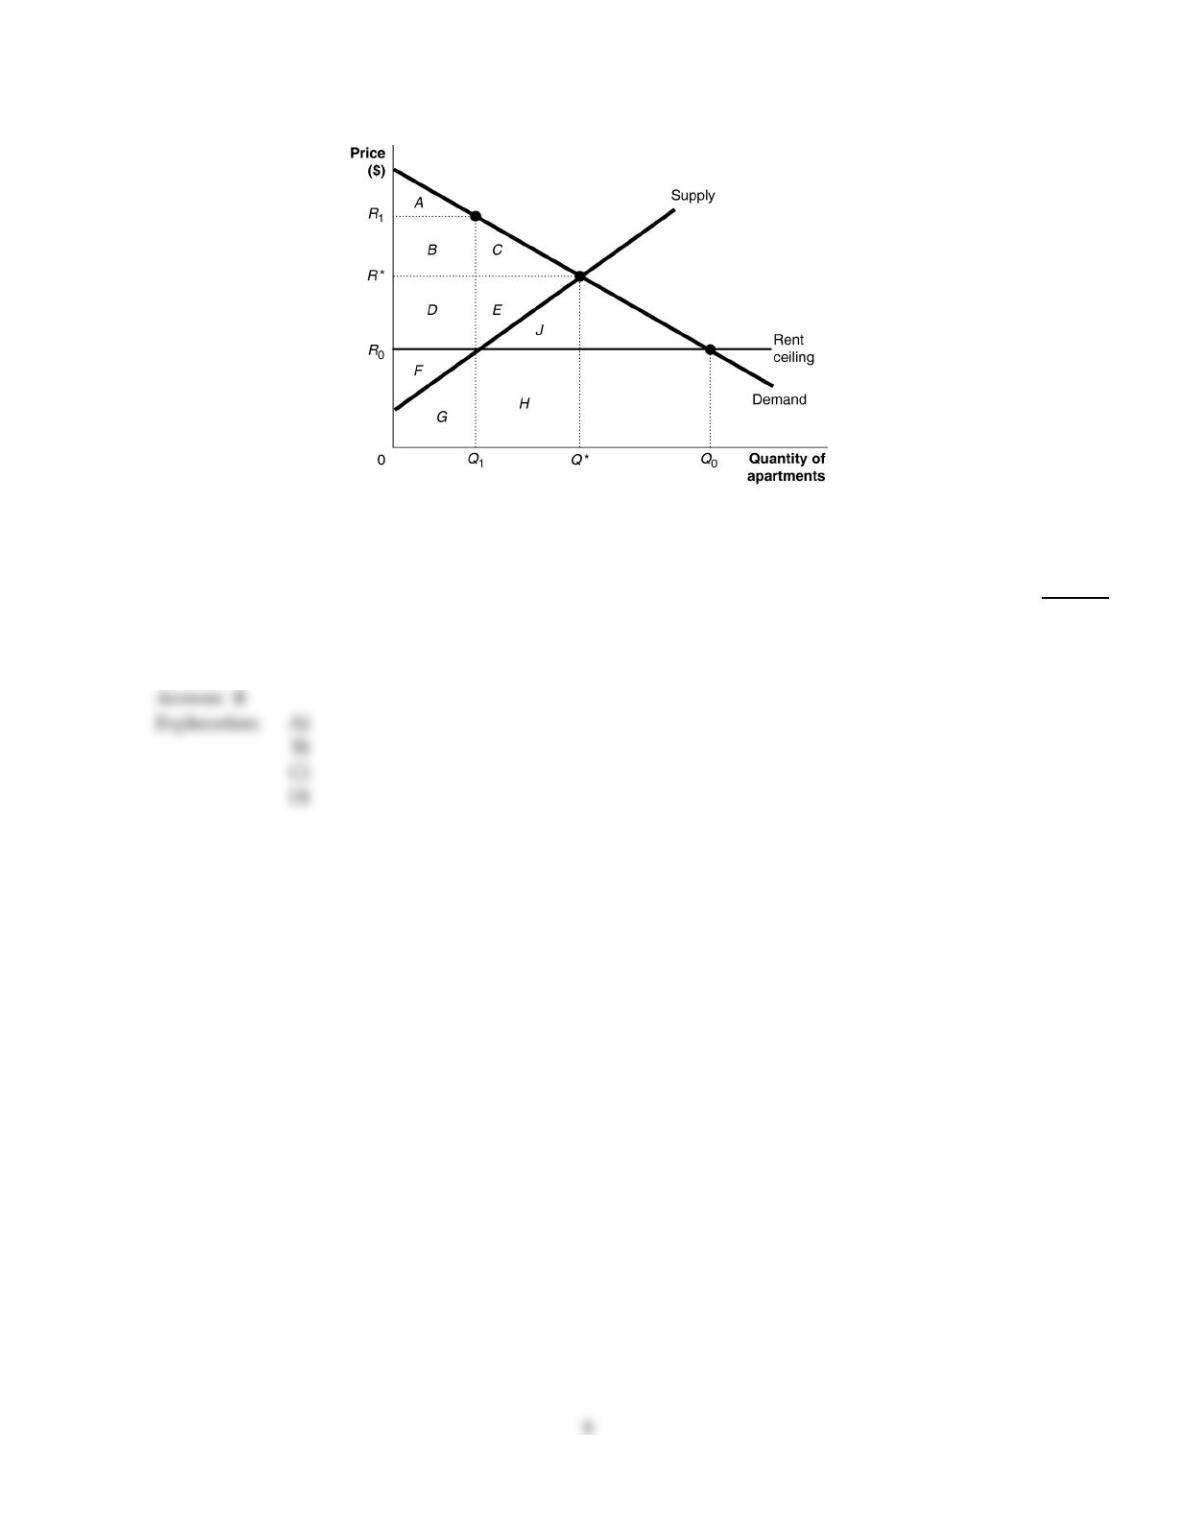
Figure 4–6
Figure 4–6 shows the market for apartments in Bay City. Recently, the government imposed a rent ceiling at R0.
15)
Refer to Figure 4–6. With rent control, the quantity supplied is Q1. Suppose apartment owners
ignore the law and rent this quantity for the highest rent they can get. What is the highest rent they
can get?
15)
A)
more than R1
B)
R1
C)
R*
D)
R0
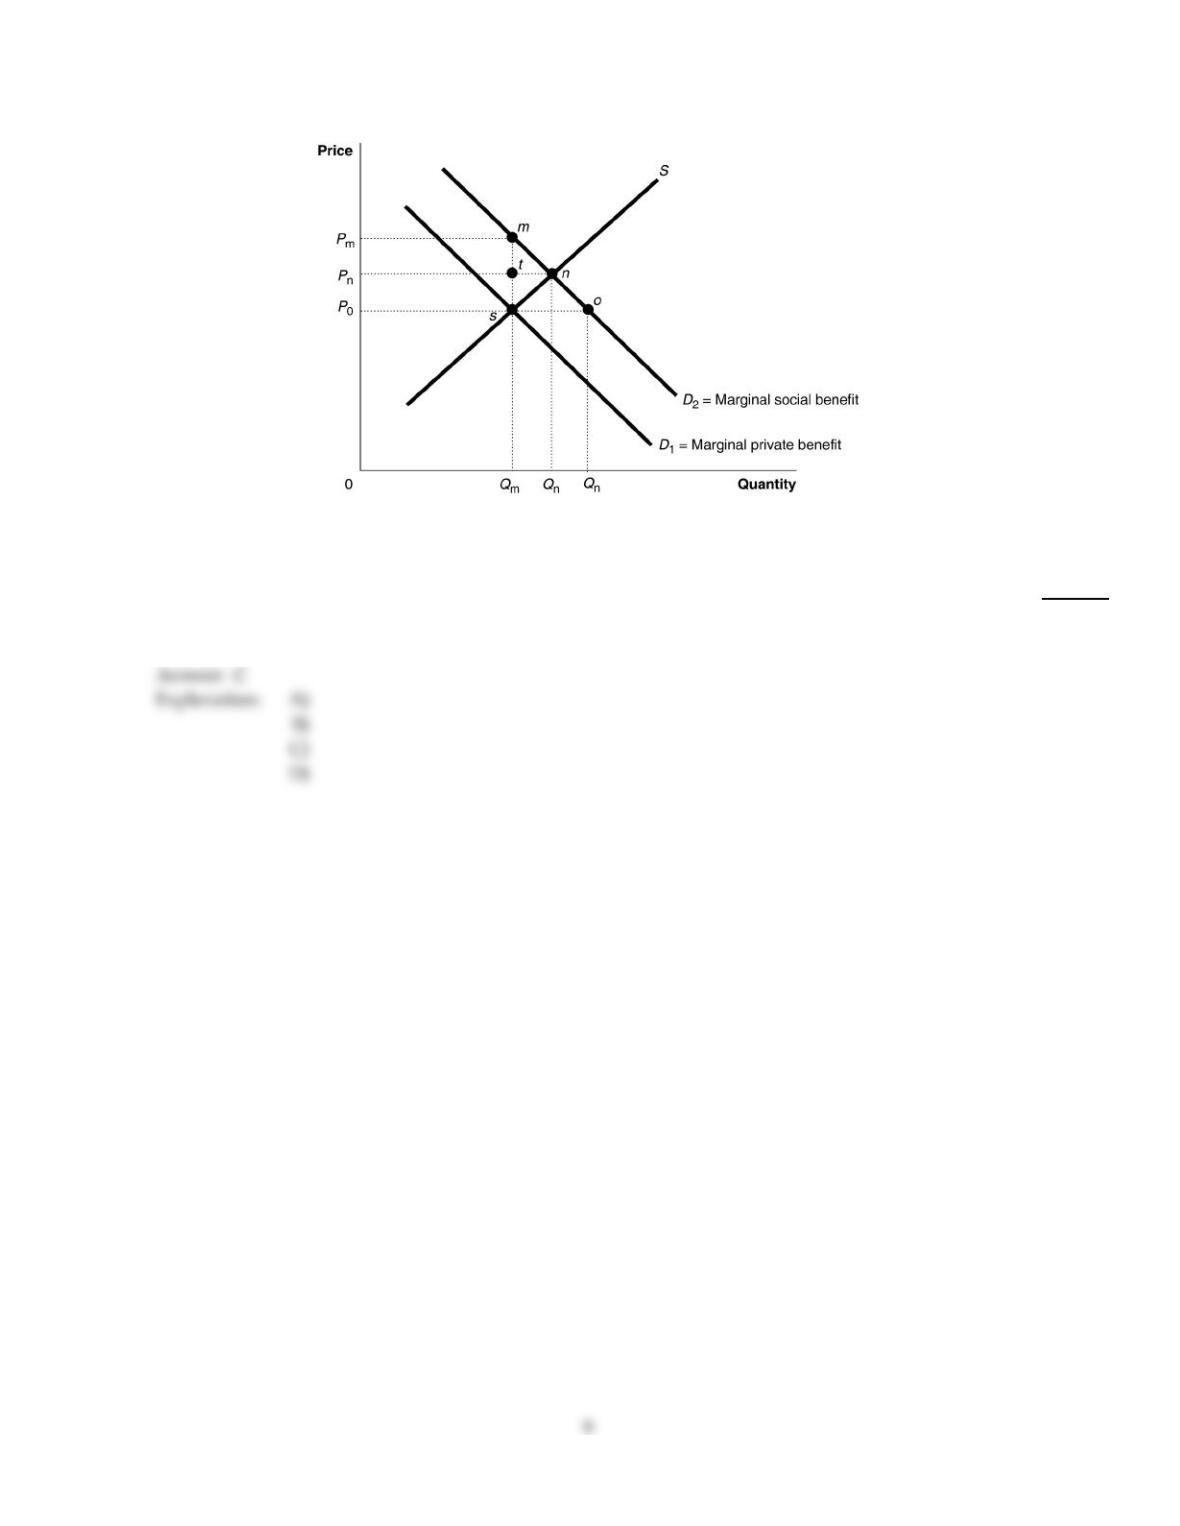
Figure 4–14
Figure 4–14 shows a market with a positive externality.
16)
Refer to Figure 4–14. The size of marginal external benefits can be determined by
16)
A)
D2+ D1 at each output level
B)
the demand curve D1.
C)
D2– D1 at each output level.
D)
the demand curve D2.
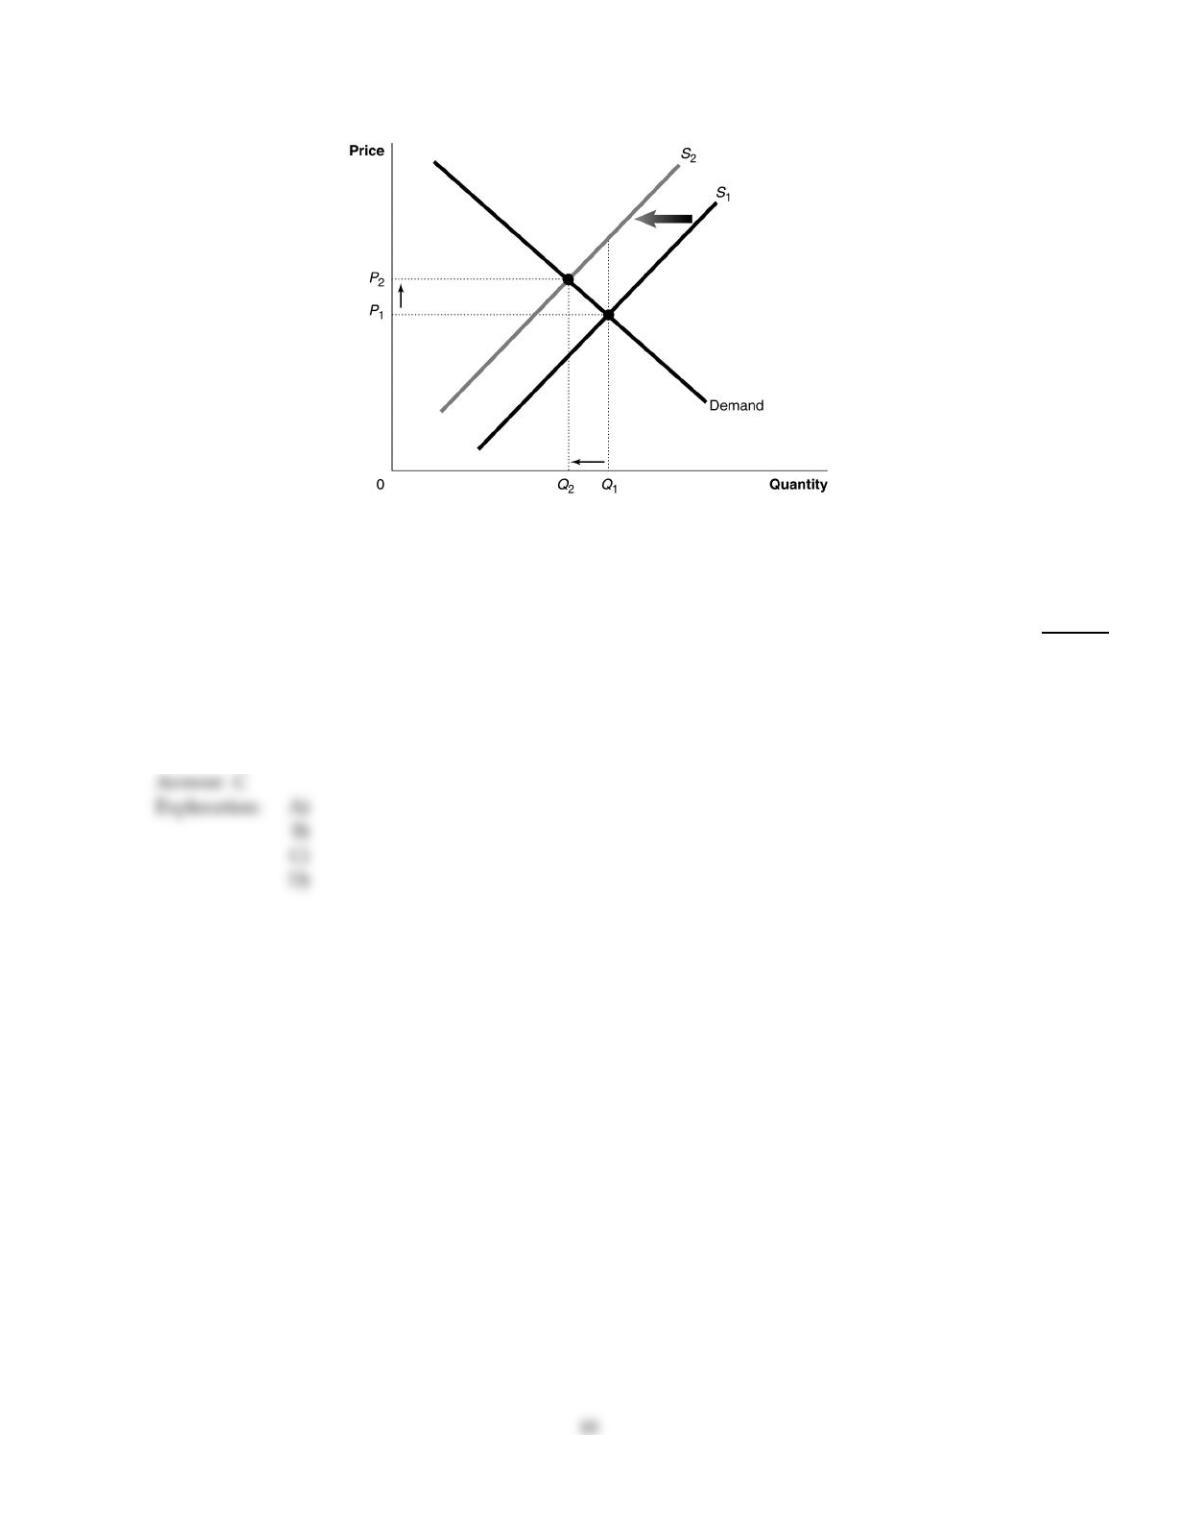
Figure 4–10
Figure 4–10 shows a market with an externality. The current market equilibrium output of Q1 is not the economically
efficient output. The economically efficient output is Q2.
17)
Refer to Figure 4–10. If, because of an externality, the economically efficient output is Q2 and not
the current equilibrium output of Q1, what does S2 represent?
17)
A)
the market supply curve reflecting external cost
B)
the market supply curve reflecting private cost
C)
the market supply curve reflecting social cost
D)
the market supply curve reflecting implicit cost
C
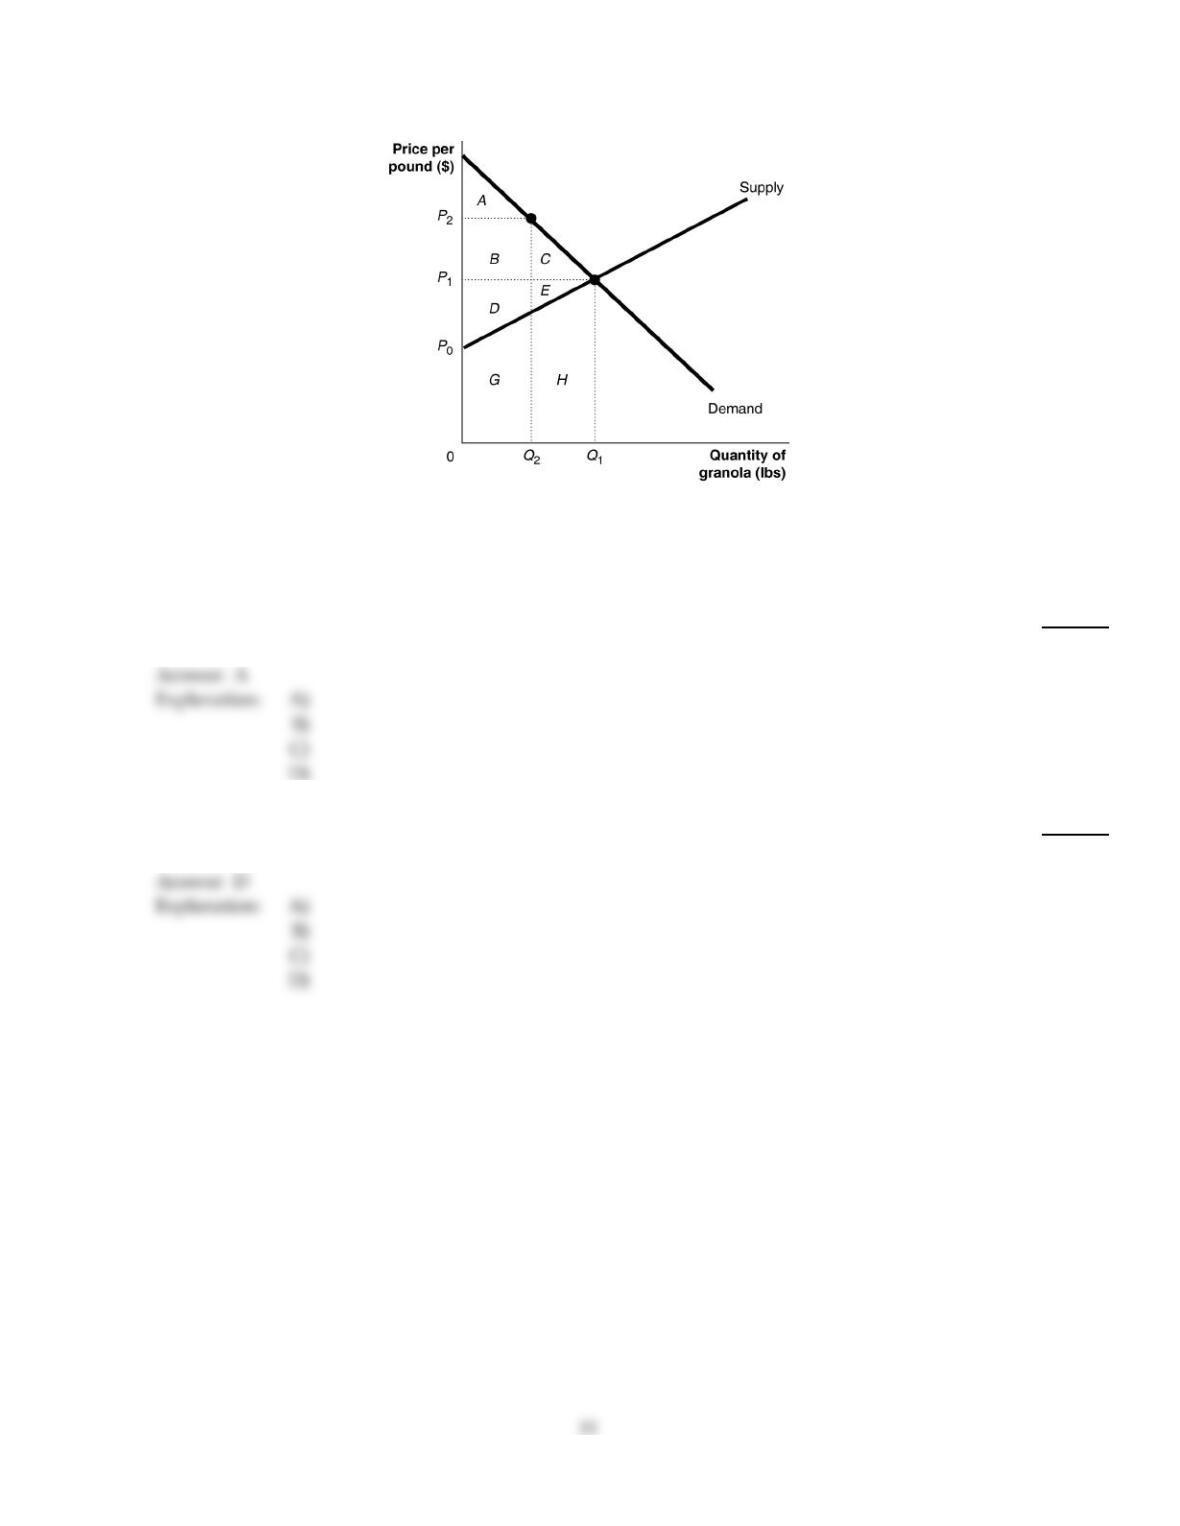
Figure 4–4
Figure 4–4 shows the market for granola. The market is initially in equilibrium at a price of P1 and a quantity of Q1. Now
suppose producers decide to cut output to Q2 in order to raise the price to P2.
18)
Refer to Figure 4–4. What area represents consumer surplus at P2?
18)
A)
A
B)
A+B
C)
A+B+D+F
D)
B+C
19)
Refer to Figure 4–4. What area represents producer surplus at P2?
19)
A)
B+C+D+E
B)
A+B+D
C)
B+D+G
D)
B+D
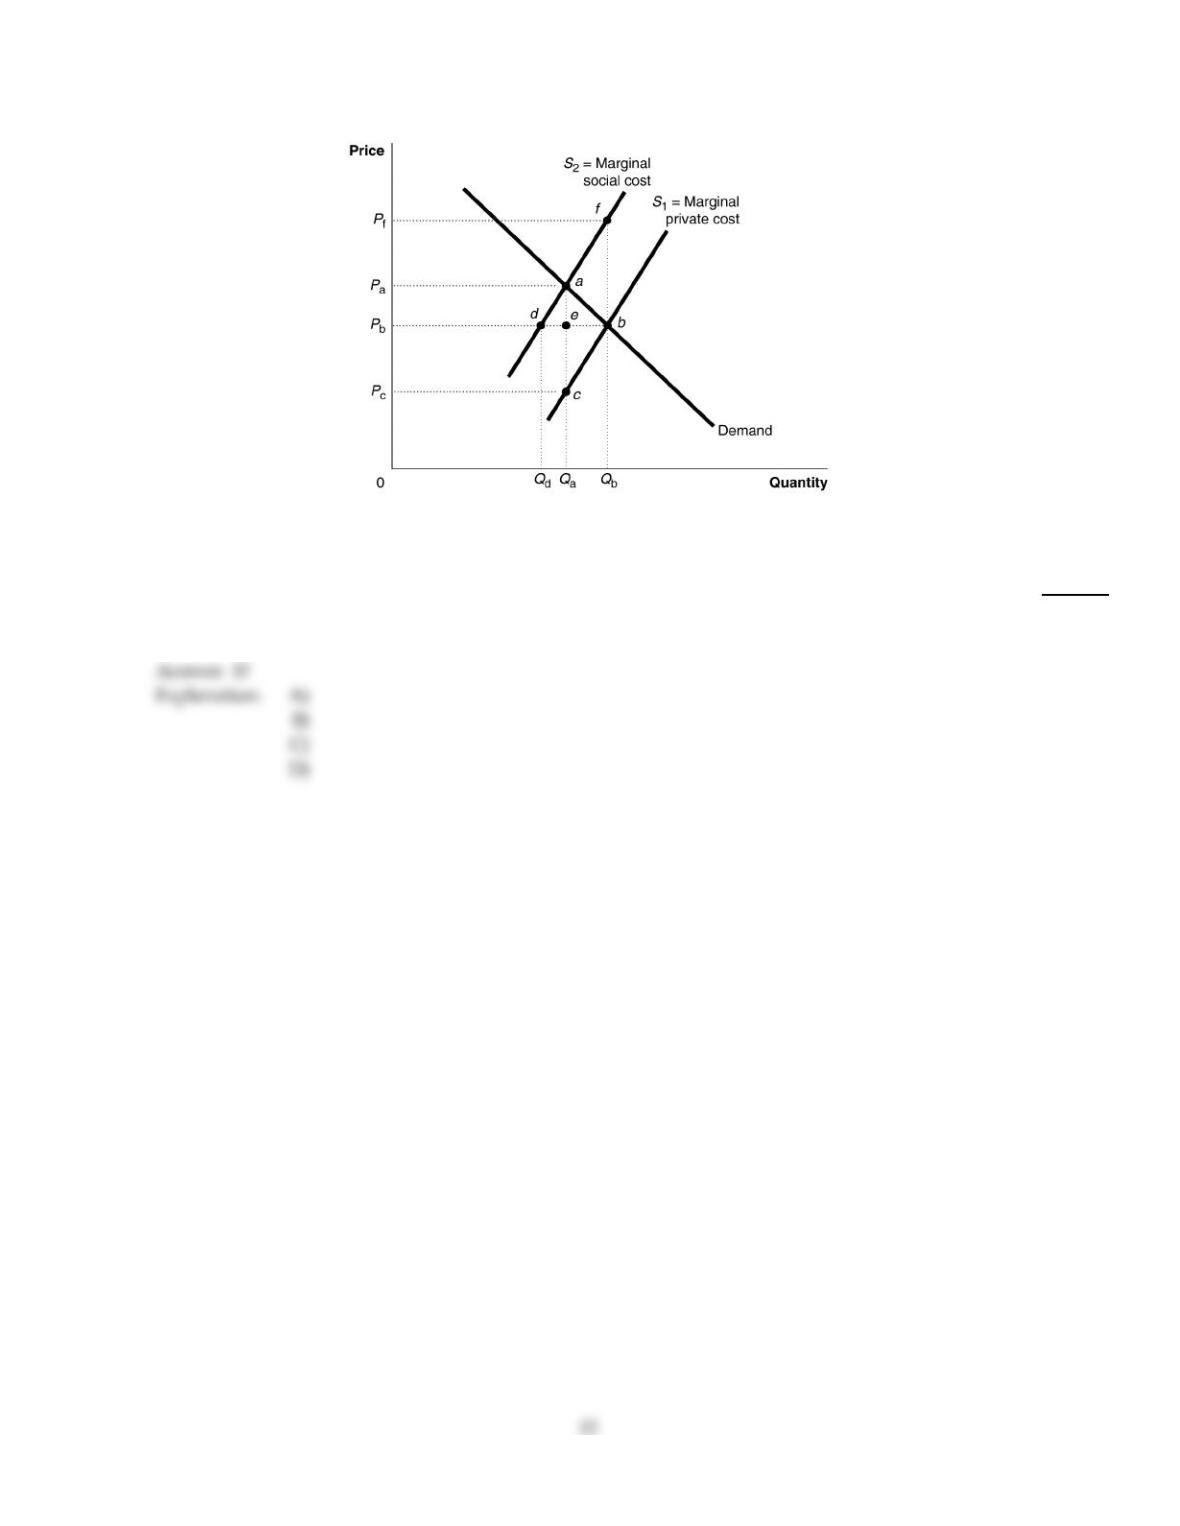
Figure 4–12
Figure 4–12 shows a market with a negative externality.
20)
Refer to Figure 4–12. The size of marginal external costs can be determined by
20)
A)
the supply curve S2.
B)
the supply curve S1.
C)
S2+ S1 at each output level.
D)
S2 – S1 at each output level.
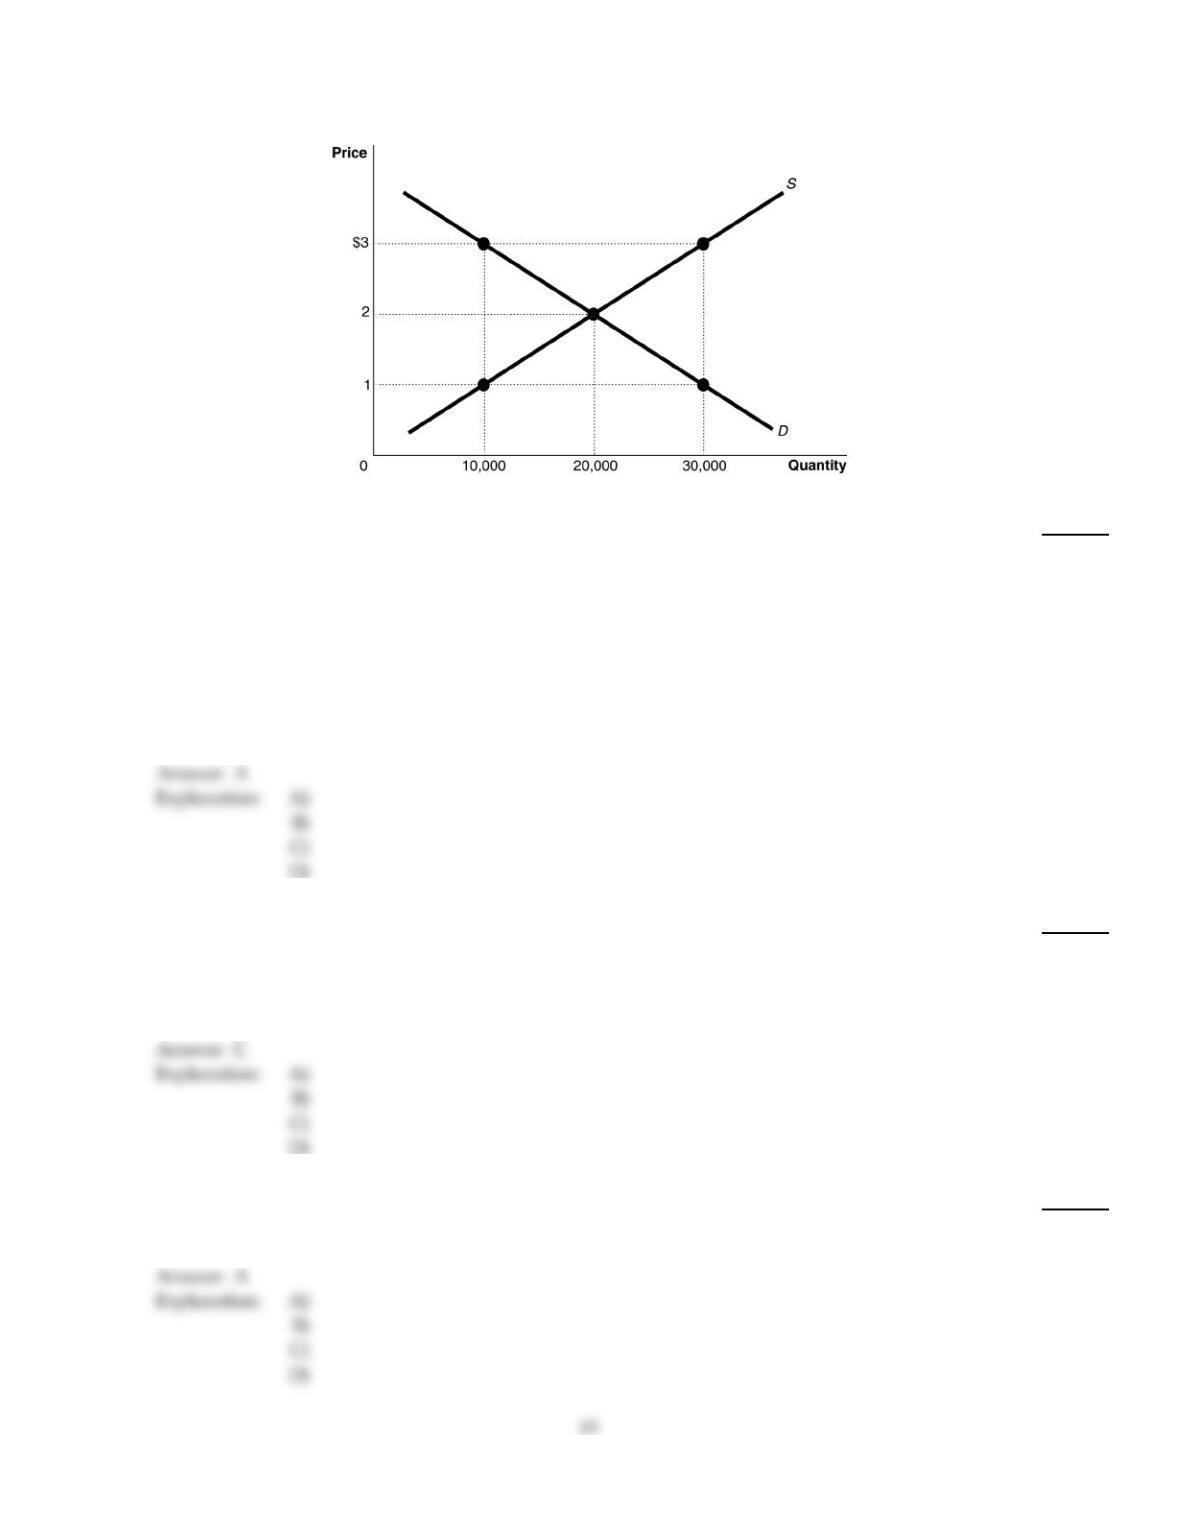
Figure 4–5
21)
Refer to Figure 4–5. The figure above represents the market for iced tea. Assume that this is a
competitive market. If the price of iced tea is $3, what changes in the market would result in an
economically efficient output?
21)
A)
The price would decrease, quantity demanded would increase and quantity supplied would
decrease.
B)
The price would decrease, the quantity supplied would increase, and the quantity demanded
would decrease.
C)
The price would decrease, the demand would increase and the supply would decrease.
D)
The quantity supplied would decrease, the quantity demanded would increase and the
equilibrium price would decrease.
22)
When the marginal benefit equals the marginal cost of the last unit sold in a competitive market
22)
A)
the net benefit of consumers is equal to the net benefit of producers.
B)
producer surplus is equal to consumer surplus.
C)
an economically efficient level of output is produced.
D)
total benefit is equal to total cost.
23)
Paul goes to Sportsmart to buy a new tennis racquet. He is willing to pay $200 for a new racquet,
but buys one on sale for $125. Paul’s consumer surplus from the purchase is
23)
A)
$75.
B)
$325.
C)
$125.
D)
$200.
24)
Which of the following is a source of market failure?
24)
A)
an inequitable income distribution
B)
incomplete property rights or inability to enforce property rights
C)
unforeseen circumstances which leads to the bankruptcy of many firms
D)
a lack of government intervention in a market
25)
Suppose a tax equal to the value of the marginal external cost at the optimal output is imposed on a
pollution generating good. All of the following will result from the tax except
25)
A)
an increase in the equilibrium market price.
B)
an increase in the demand for the good.
C)
a decrease in the equilibrium quantity produced and consumed.
D)
a decrease in market supply of the good.
B
26)
The minimum wage is an example of
26)
A)
a price ceiling.
B)
a price floor.
C)
a subsidy for low–skilled workers.
D)
a black market.
B
27)
Which of the following statements is true?
27)
A)
When a market is in equilibrium consumer surplus equals producer surplus.
B)
Producer surplus measures the total benefit received by producers from participating in a
market.
C)
Consumer surplus measures the net benefit from participating in a market.
D)
Consumer surplus measures the total benefit from participating in a market.
C
B
28)
A supply curve shows
28)
A)
the marginal cost of producing one more unit of a good or service.
B)
the total cost of producing different quantities of a good or service.
C)
the quantities sold at different prices.
D)
the marginal benefit from buying one more unit of a good or service.
29)
John List and Jason Shogren conducted a study that tried to explain why people continue to give
presents rather than cash for birthdays and holidays. Their study found that
29)
A)
the deadweight loss from giving cash was twice as great as the deadweight loss from giving
presents.
B)
as much as half the value of a gift to a recipient was its sentimental value.
C)
on average, families and friends paid much more for presents than the recipients were willing
to pay for them.
D)
government restrictions are responsible for most of the deadweight losses associated with gift
giving.
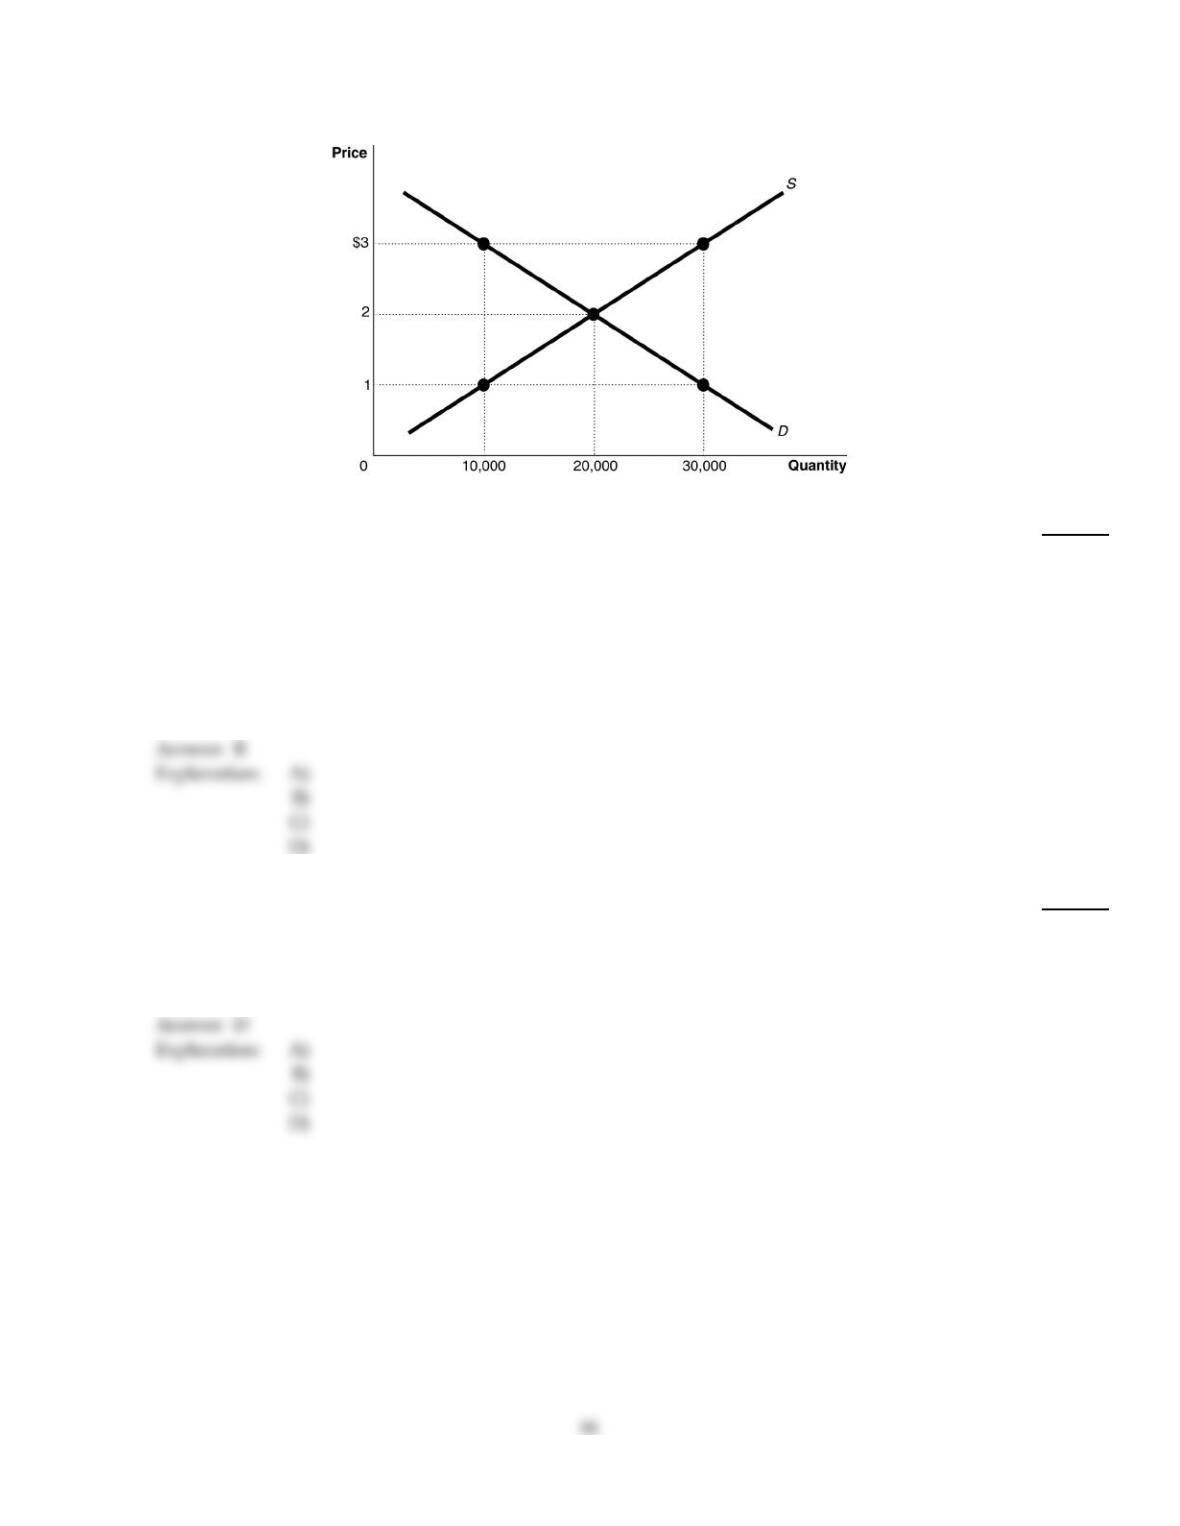
Figure 4–5
30)
Refer to Figure 4–5. The figure above represents the market for iced tea. Assume that this is a
competitive market. Which of the following is true?
30)
A)
If the price of iced tea is $3 producers will sell 30,000 units of iced tea but this output will be
economically inefficient.
B)
Both 10,000 and 30,000 are economically inefficient rates of output.
C)
If the price of iced tea is $3 the output will be economically efficient but there will be a
deadweight loss.
D)
If the price of iced tea is $3 consumers will purchase more than the economically efficient
output.
31)
A market demand curve reflects the
31)
A)
social benefits of consuming a product.
B)
the sum of private and social benefits of consuming a product.
C)
external benefits of consuming a product.
D)
private benefits of consuming a product.
D
B
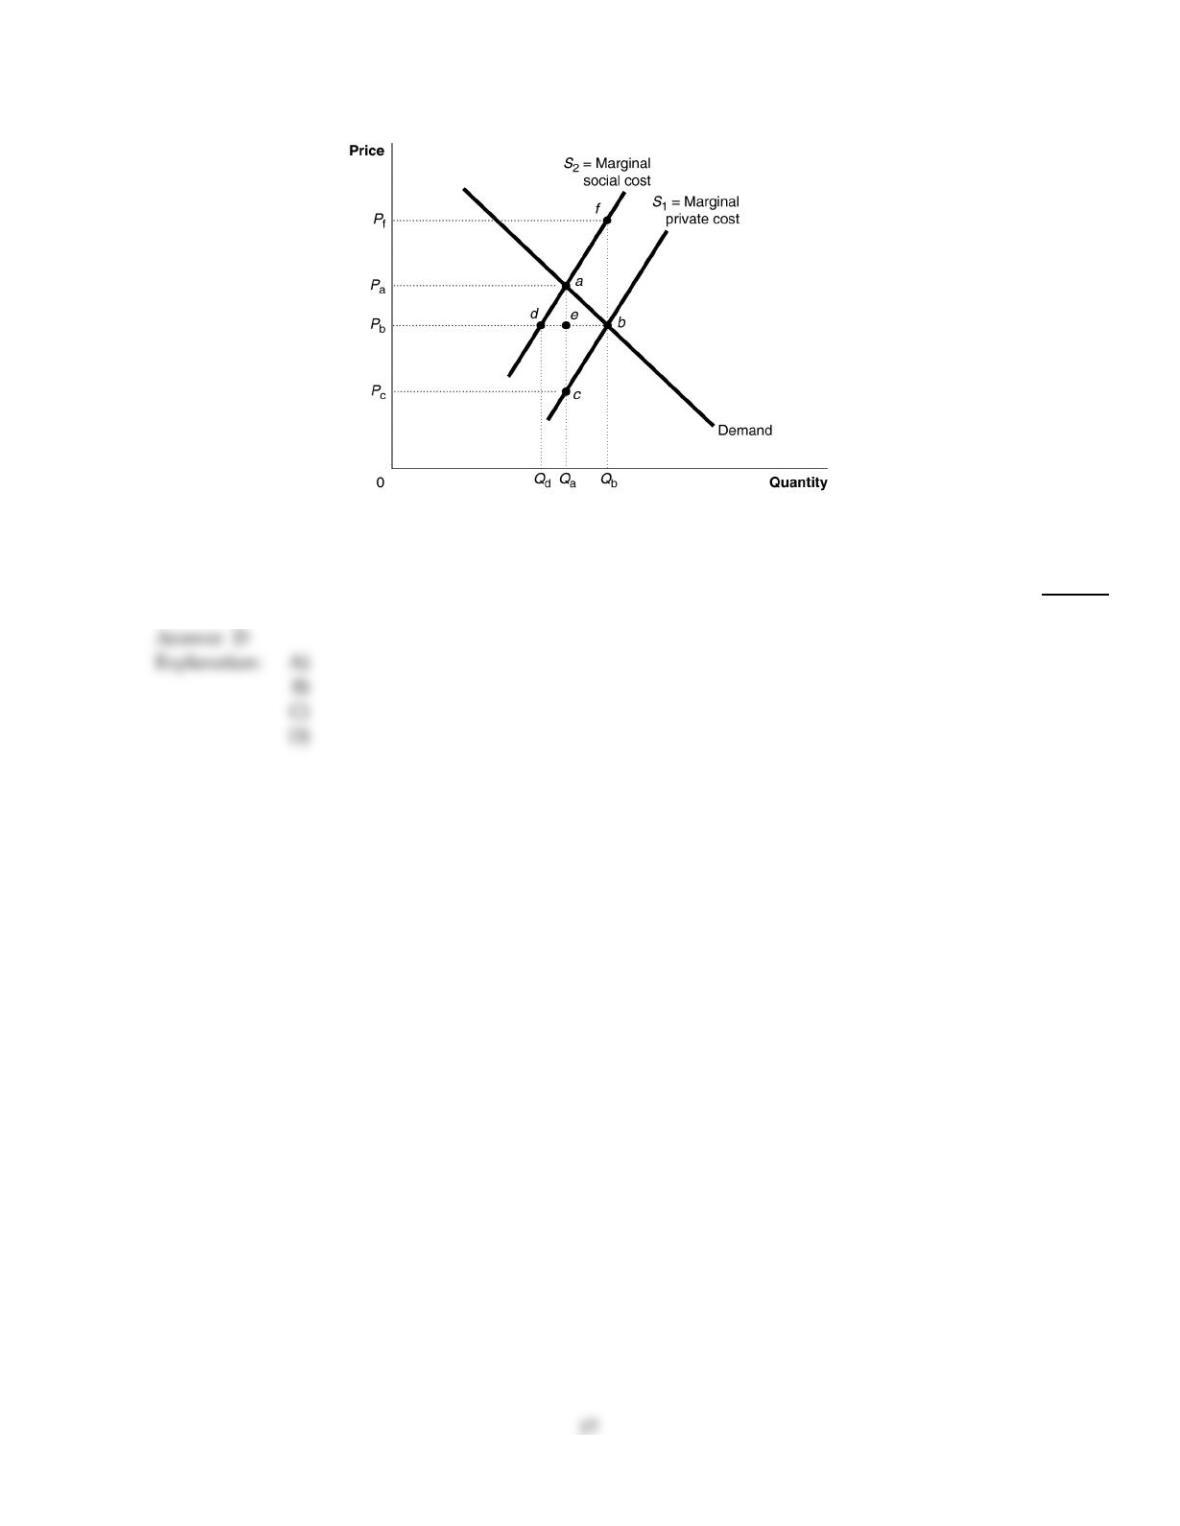
Figure 4–12
Figure 4–12 shows a market with a negative externality.
32)
Refer to Figure 4–12. The dead weight loss due to the externality is represented by the area
32)
A)
abe.
B)
ade.
C)
abd.
D)
abc.
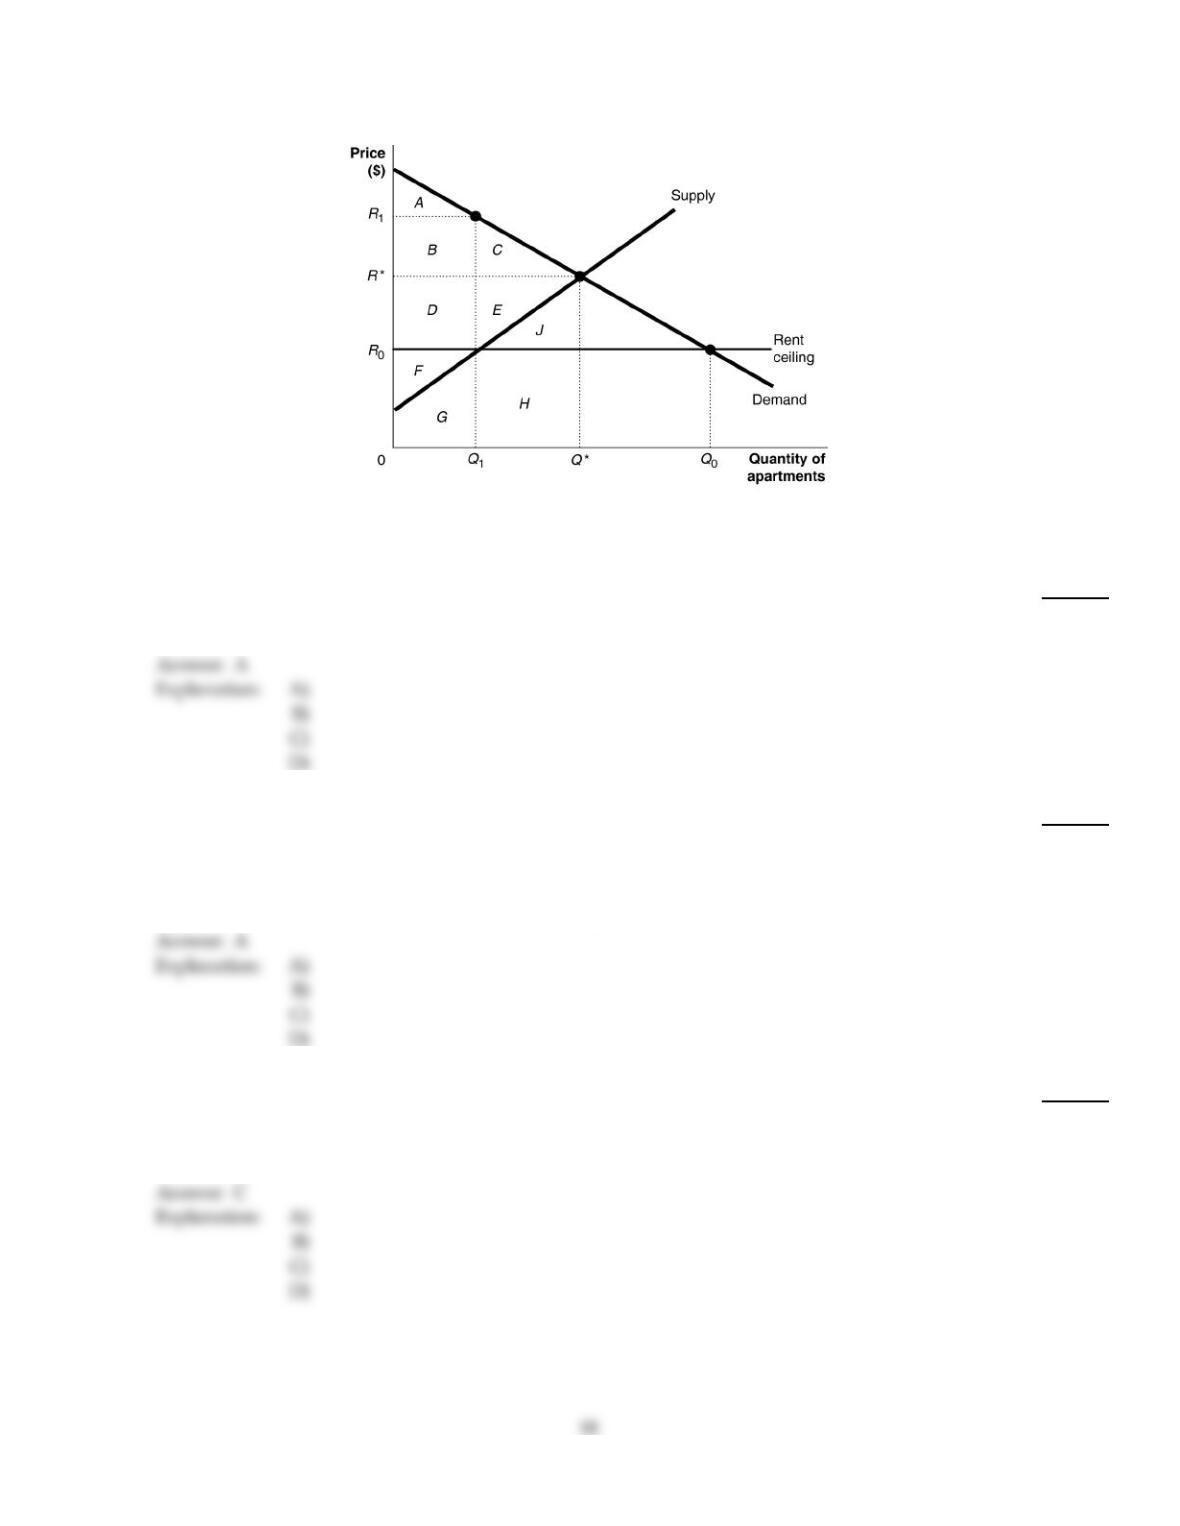
Figure 4–6
Figure 4–6 shows the market for apartments in Bay City. Recently, the government imposed a rent ceiling at R0.
33)
Refer to Figure 4–6. What is the area that represents the portion of producer surplus transferred to
consumers as a result of the rent ceiling?
33)
A)
D
B)
F
C)
D+F
D)
D+E
34)
A consumer is willing to purchase a product up to the point where
34)
A)
the marginal benefit is equal to the price of the product.
B)
he spends all of his income.
C)
the quantity demanded is equal to the quantity supplied.
D)
he is indifferent between consuming and saving.
A
35)
Economists refer a to a market where buying and selling take place at prices that violate
government price regulations as
35)
A)
a noncompetitive market.
B)
a restricted market.
C)
a black market.
D)
an outlaw market.
C
A
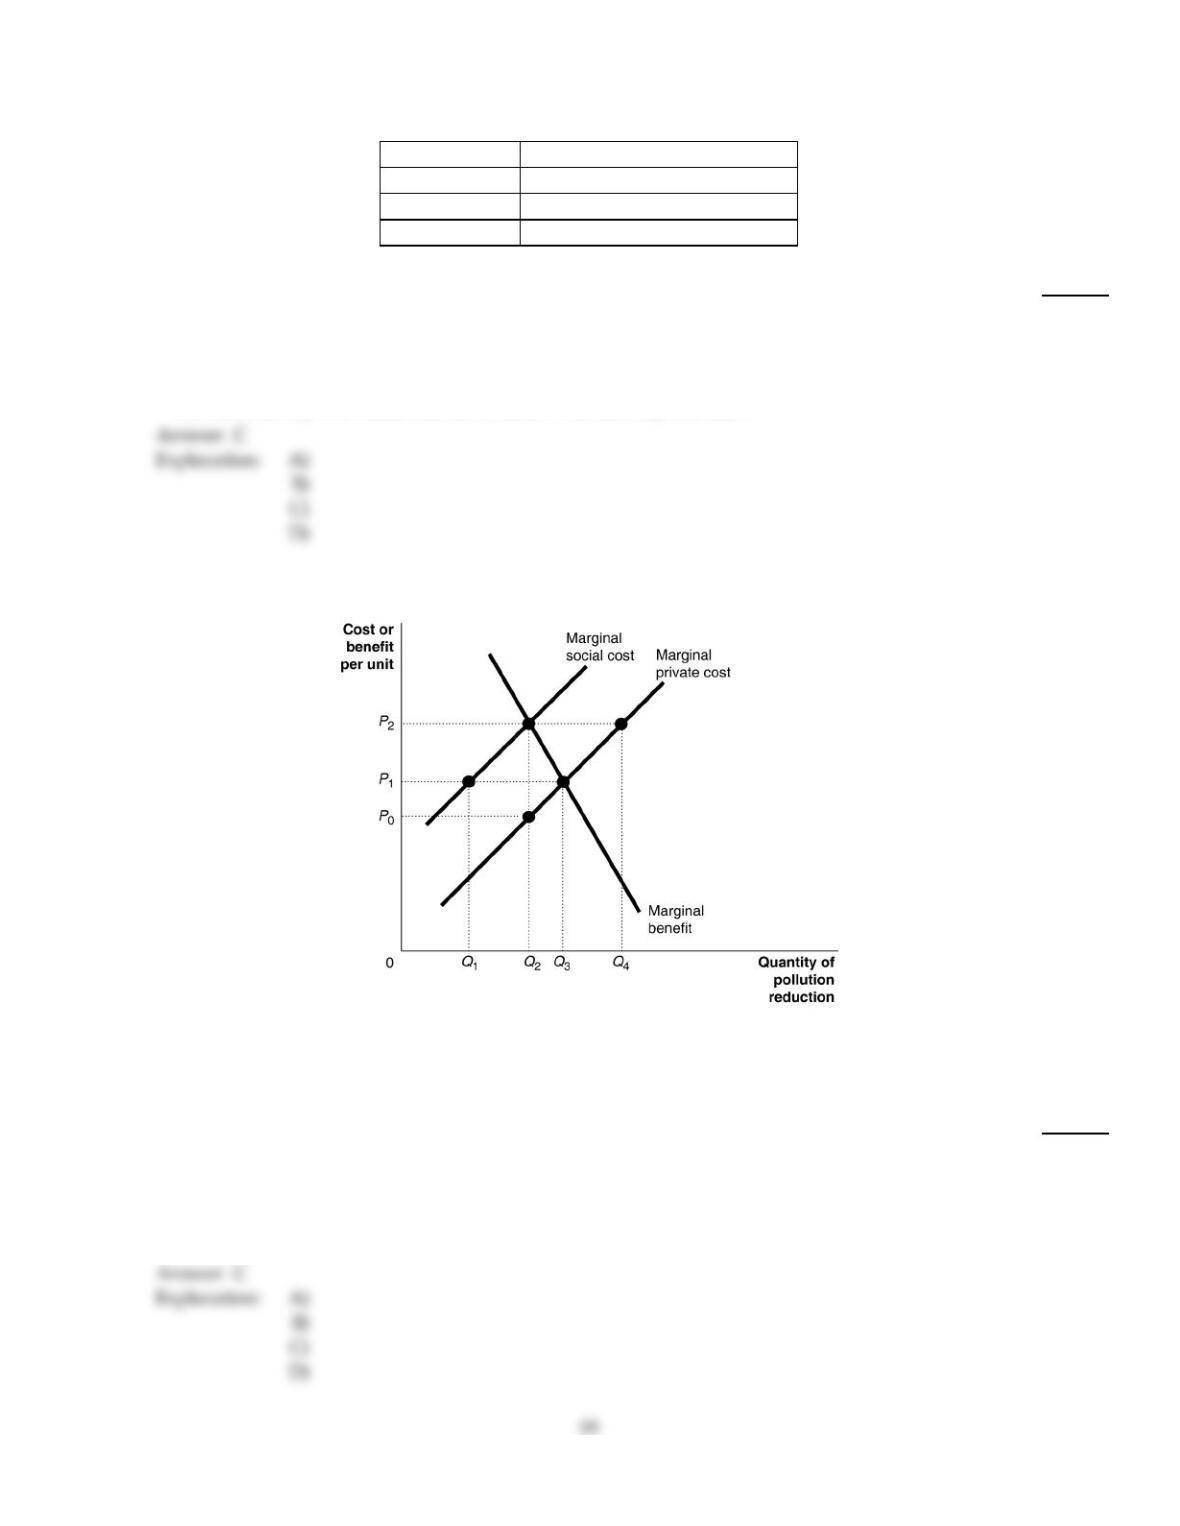
Table 4–1
Consumer Willingness to Pay
Tom $40
Dick $30
Harriet $25
36)
Refer to Table 4–1. The table above lists the highest prices three consumers, Tom, Dick and Harriet,
are willing to pay for a short–sleeved polo shirt. If the price of the shirts falls from $28 to $20
36)
A)
Harriet will receive more consumer surplus than Tom or Dick.
B)
consumer surplus will increase from $70 to $95.
C)
consumer surplus increases from $14 to $35.
D)
Tom will buy two shirts; Dick and Harriet will each buy one shirt.
Figure 4–15
Companies producing toilet paper bleach the paper to make it white. The bleach is discharged into rivers and lakes and
causes substantial environmental damage. Figure 4–15 illustrates this situation in the toilet paper market.
37)
Refer to Figure 4–15. Let’s suppose the government imposes a tax of $50 per ton of toilet paper to
bring about the efficient level of production. What happens to the market price of toilet paper?
37)
A)
It rises by more than $50.
B)
It rises by $50.
C)
It rises by less than $50.
D)
It remains the same because the tax is imposed on producers who create the externality.

Figure 4–10
Figure 4–10 shows a market with an externality. The current market equilibrium output of Q1 is not the economically
efficient output. The economically efficient output is Q2.
38)
Refer to Figure 4–10. If, because of an externality, the economically efficient output is Q2 and not
the current equilibrium output of Q1, what does S1 represent?
38)
A)
the market supply curve reflecting external cost
B)
the market supply curve reflecting private cost
C)
the market supply curve reflecting implicit cost
D)
the market supply curve reflecting social cost
B