Economics Chapter 4 B—Supply and Demand: Applications and Extensions
MULTIPLE CHOICE
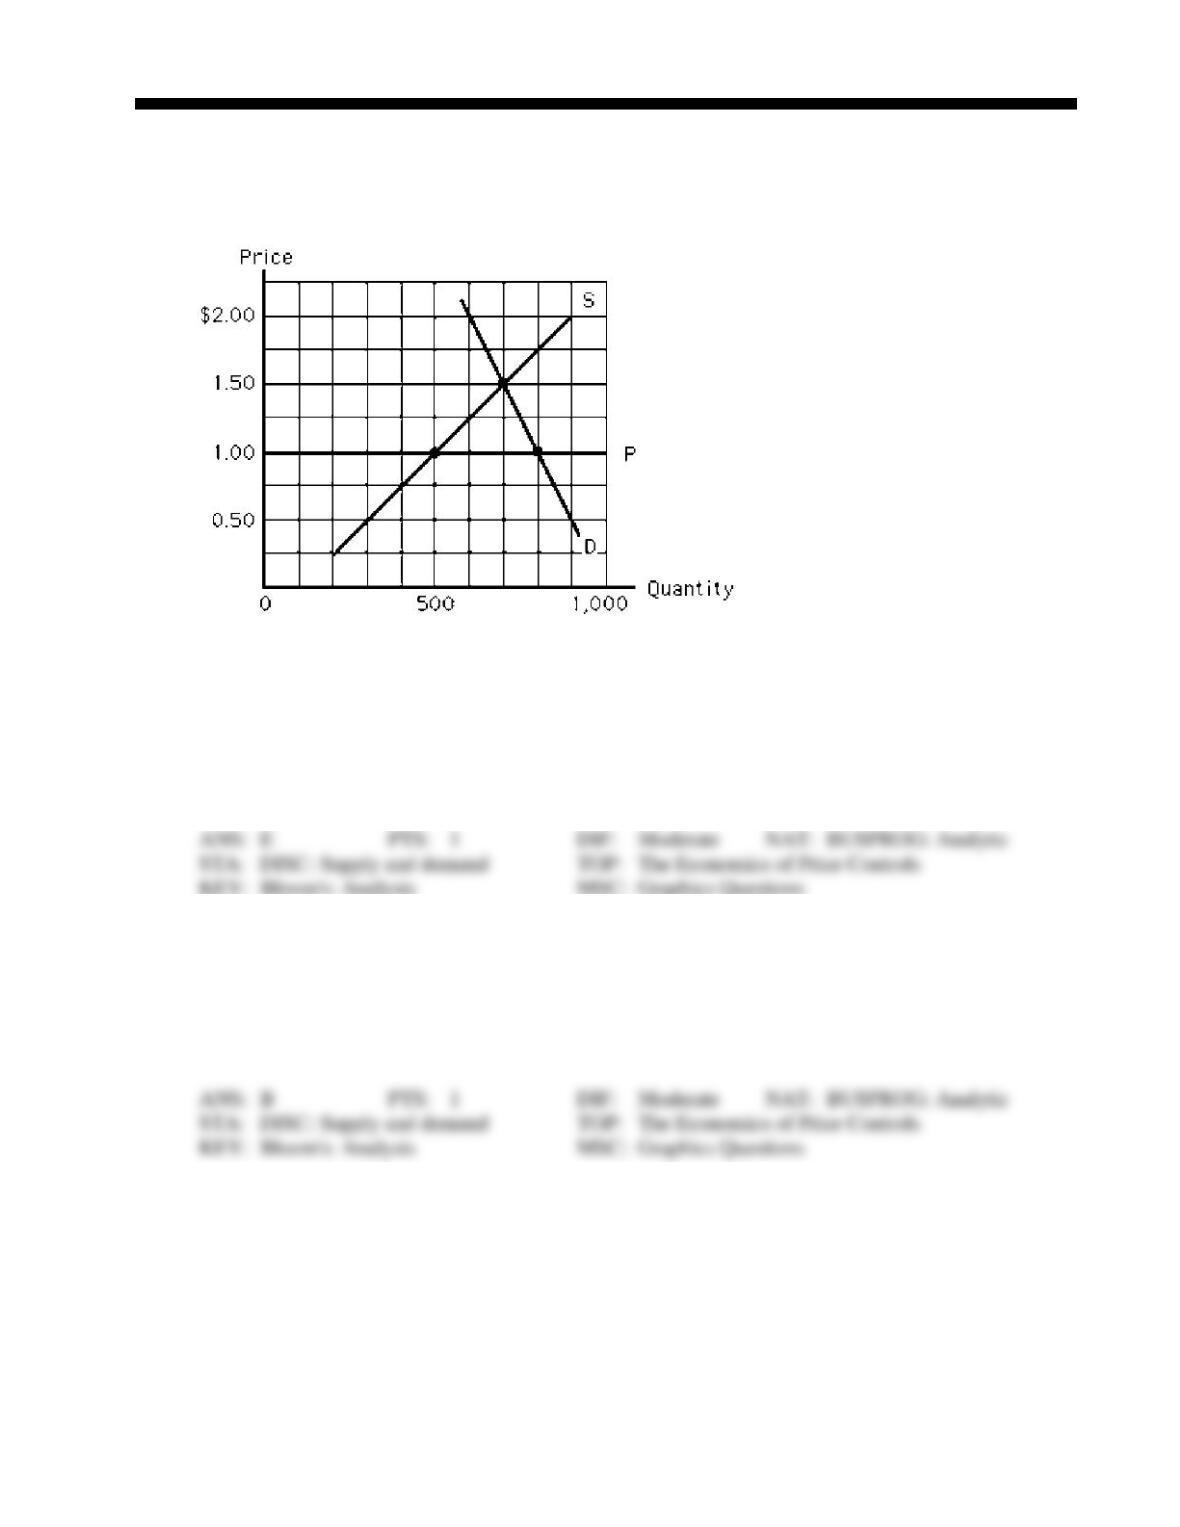
Figure 4-14
191. Figure 4-14 depicts the milk market. The horizontal line, P, represents a price ceiling imposed by the
government. Which of the following is true?
a.
In equilibrium, the quantity demanded is 800 gallons.
b.
At the ceiling price, there is a surplus.
c.
The quantity demanded at the price ceiling will equal the quantity supplied.
d.
The equilibrium price would be $1 per unit without the price ceiling.
e.
The quantity sold will be 500 gallons.
192. In Figure 4-14, which of the following is true at the price ceiling, P?
a.
The excess quantity supplied equals 300 gallons.
b.
The excess quantity demanded equals 300 gallons.
c.
The excess quantity supplied equals 500 gallons.
d.
The excess quantity demanded equals 800 gallons.
e.
Sales will be equal to 800 gallons.
Figure 4-15
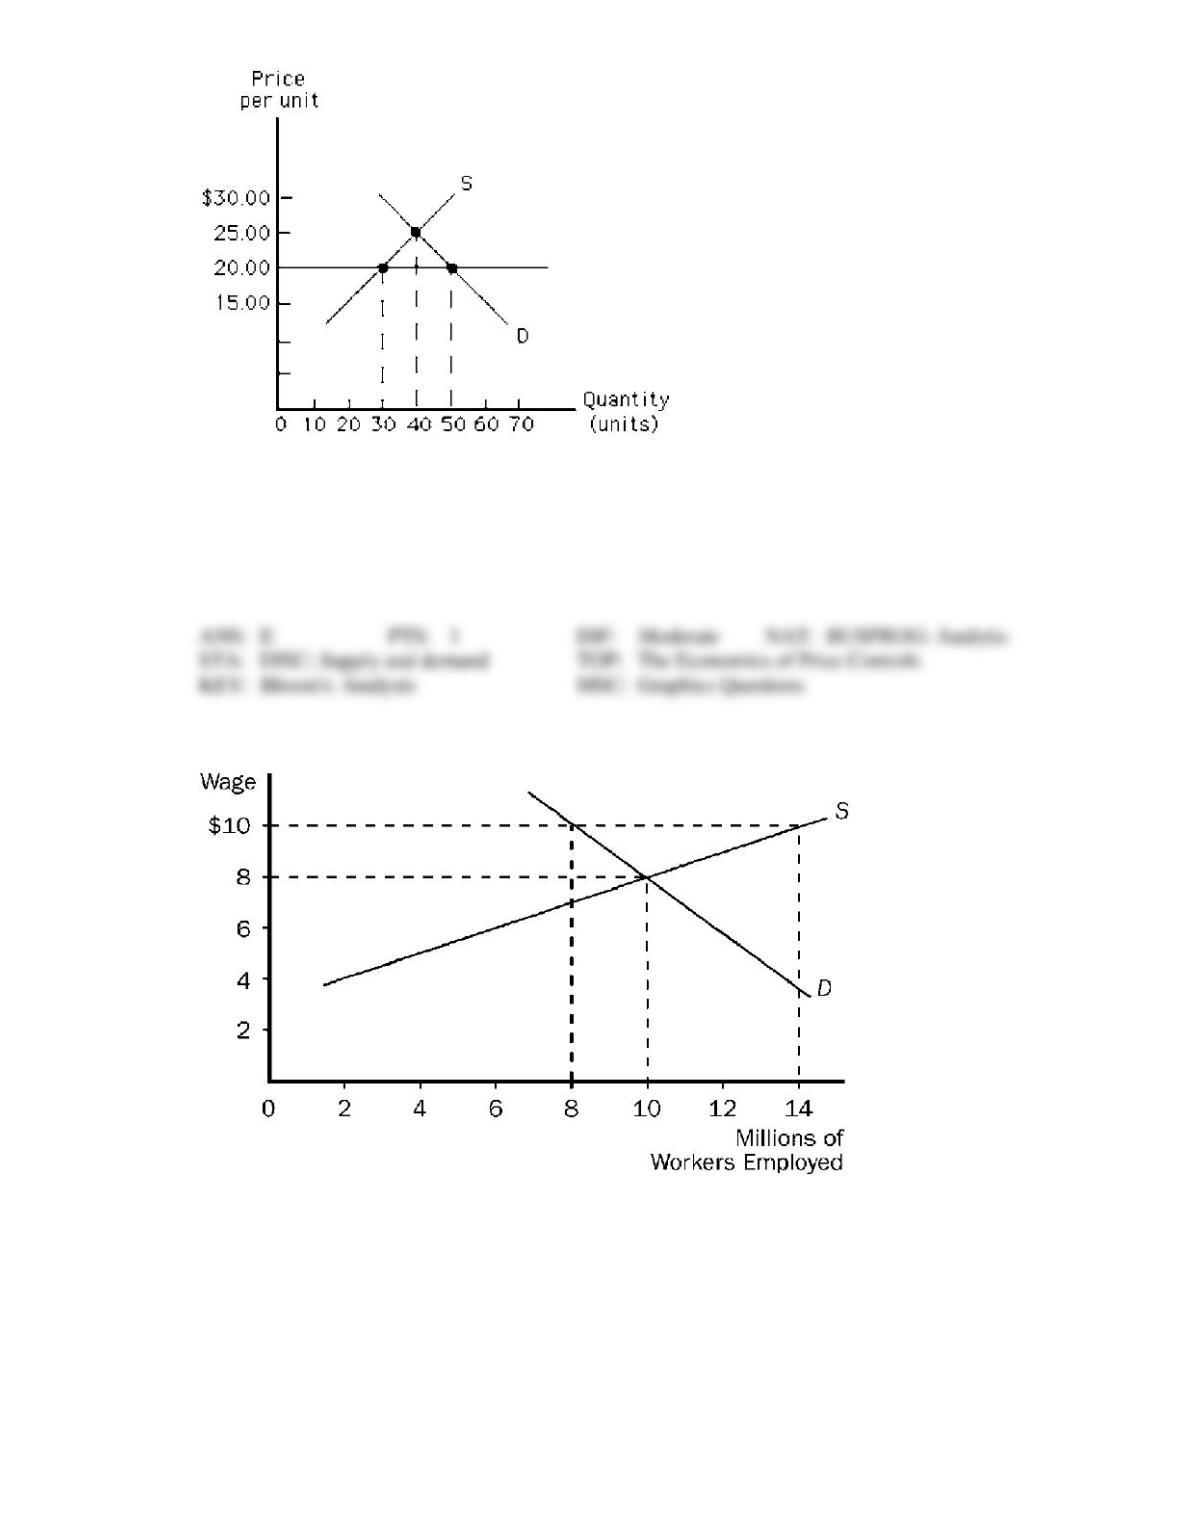
193. In Figure 4-15, suppose a price floor is established at $20.00. What is the result?
a.
a shortage of 10 units
b.
a surplus of 10 units
c.
a shortage of 20 units
d.
a surplus of 20 units
e.
there is no change from the situation that exists at the equilibrium price
Figure 4-16
194. Refer to Figure 4-16. Some policymakers have argued that the government should establish a “living
wage.” A living wage would provide workers a reasonable standard of living in their city or region. If
a living wage of $10 per hour is established in the market pictured here, we would expect
a.
employment will increase to 14 million.
b.
employment will decrease to 8 million.
c.
the wage will actually rise to $20 per hour.
d.
there will be a surplus of 14 million workers.
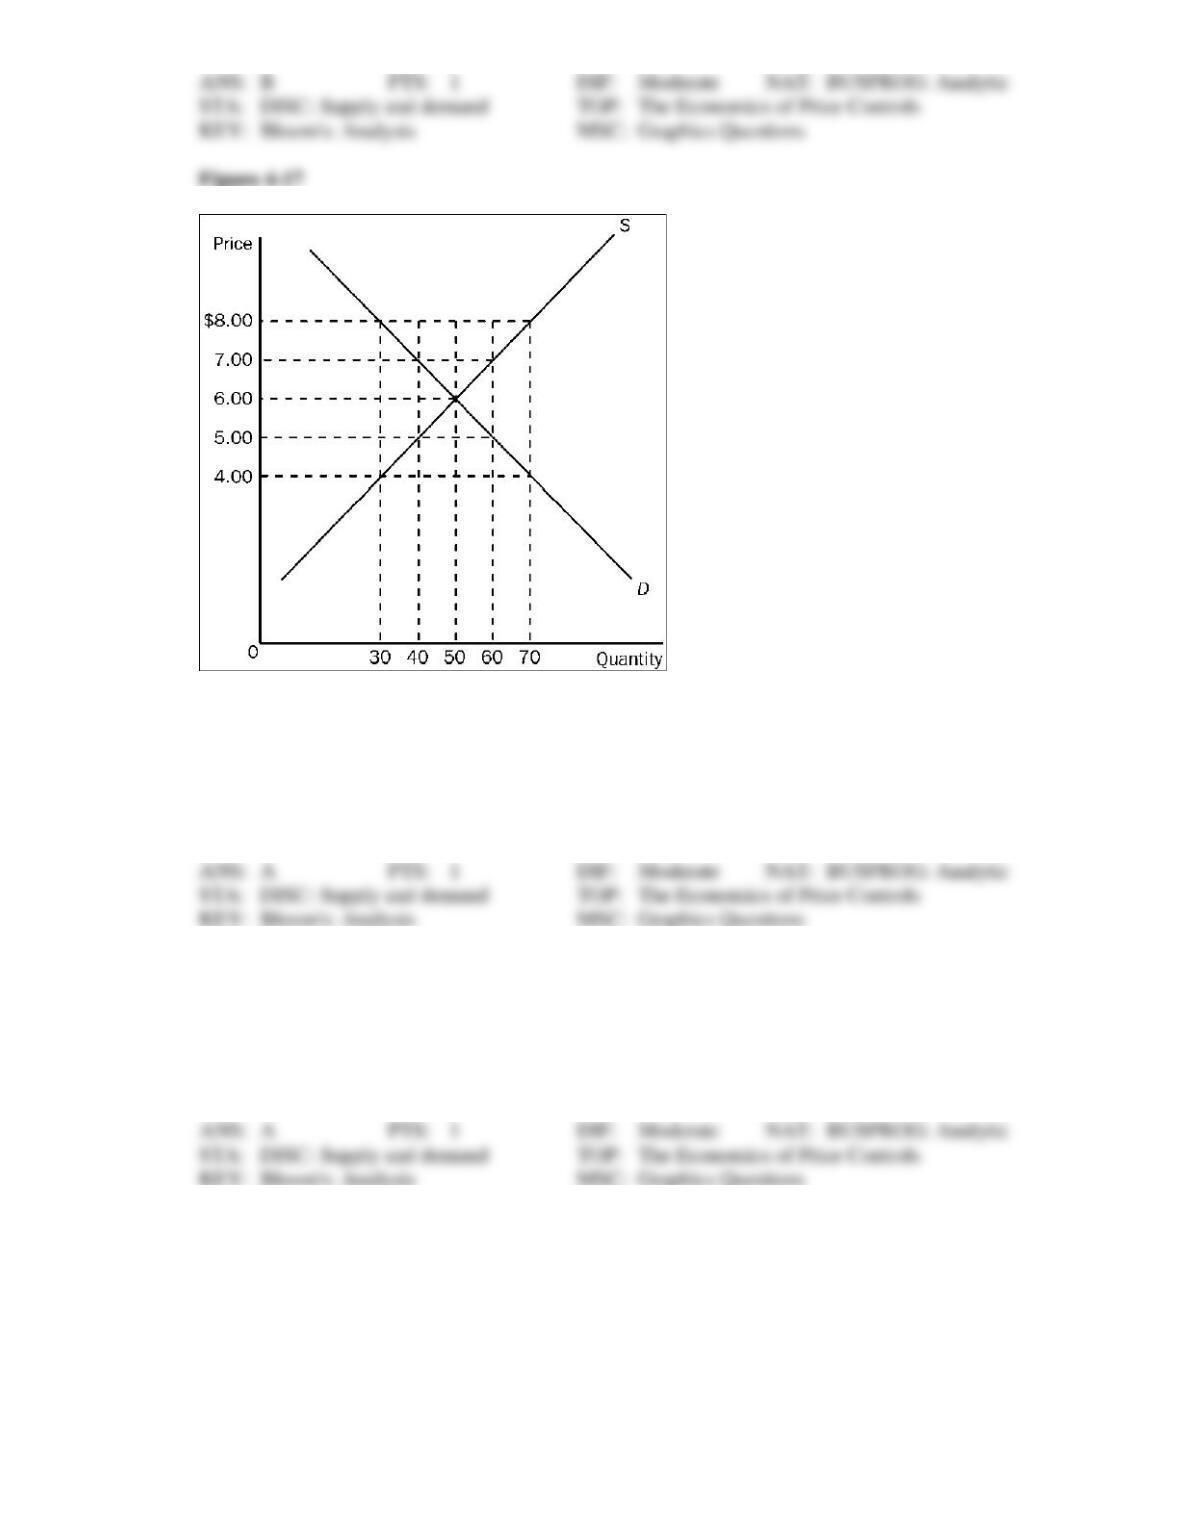
195. Refer to Figure 4-17. If the government imposes a price ceiling in this market at a price of $5.00, the
result would be a
a.
shortage of 20 units.
b.
shortage of 10 units.
c.
surplus of 20 units.
d.
surplus of 10 units.
196. Refer to Figure 4-17. Which of the following price controls would cause a shortage of 10 units of the
good?
a.
a price ceiling of $5.50
b.
a price floor of $5.50
c.
a price ceiling of $6.50
d.
a price floor of $6.50
197. Refer to Figure 4-17. Suppose a price floor of $7.00 is imposed. As a result,
a.
buyers’ total expenditure on the good decreases by $20.00.
b.
the supply curve will shift to the left so as to now pass through the point (Q = 40, P =
$7.00).
c.
the quantity of the good demanded decreases by 20 units.
d.
the price of the good continues to serve as the rationing mechanism.
198. Refer to Figure 4-17. Suppose a price ceiling of $4.50 is imposed. As a result,
a.
there is a shortage of 15 units of the good.
b.
the demand curve will shift to the left so as to now pass through the point (Q = 35, P =
$4.50).
c.
the situation is very much like the one created by a binding minimum wage.
d.
the quantity of the good that is bought and sold is the same as it would have been had a
price floor of $7.50 been imposed.
Figure 4-18
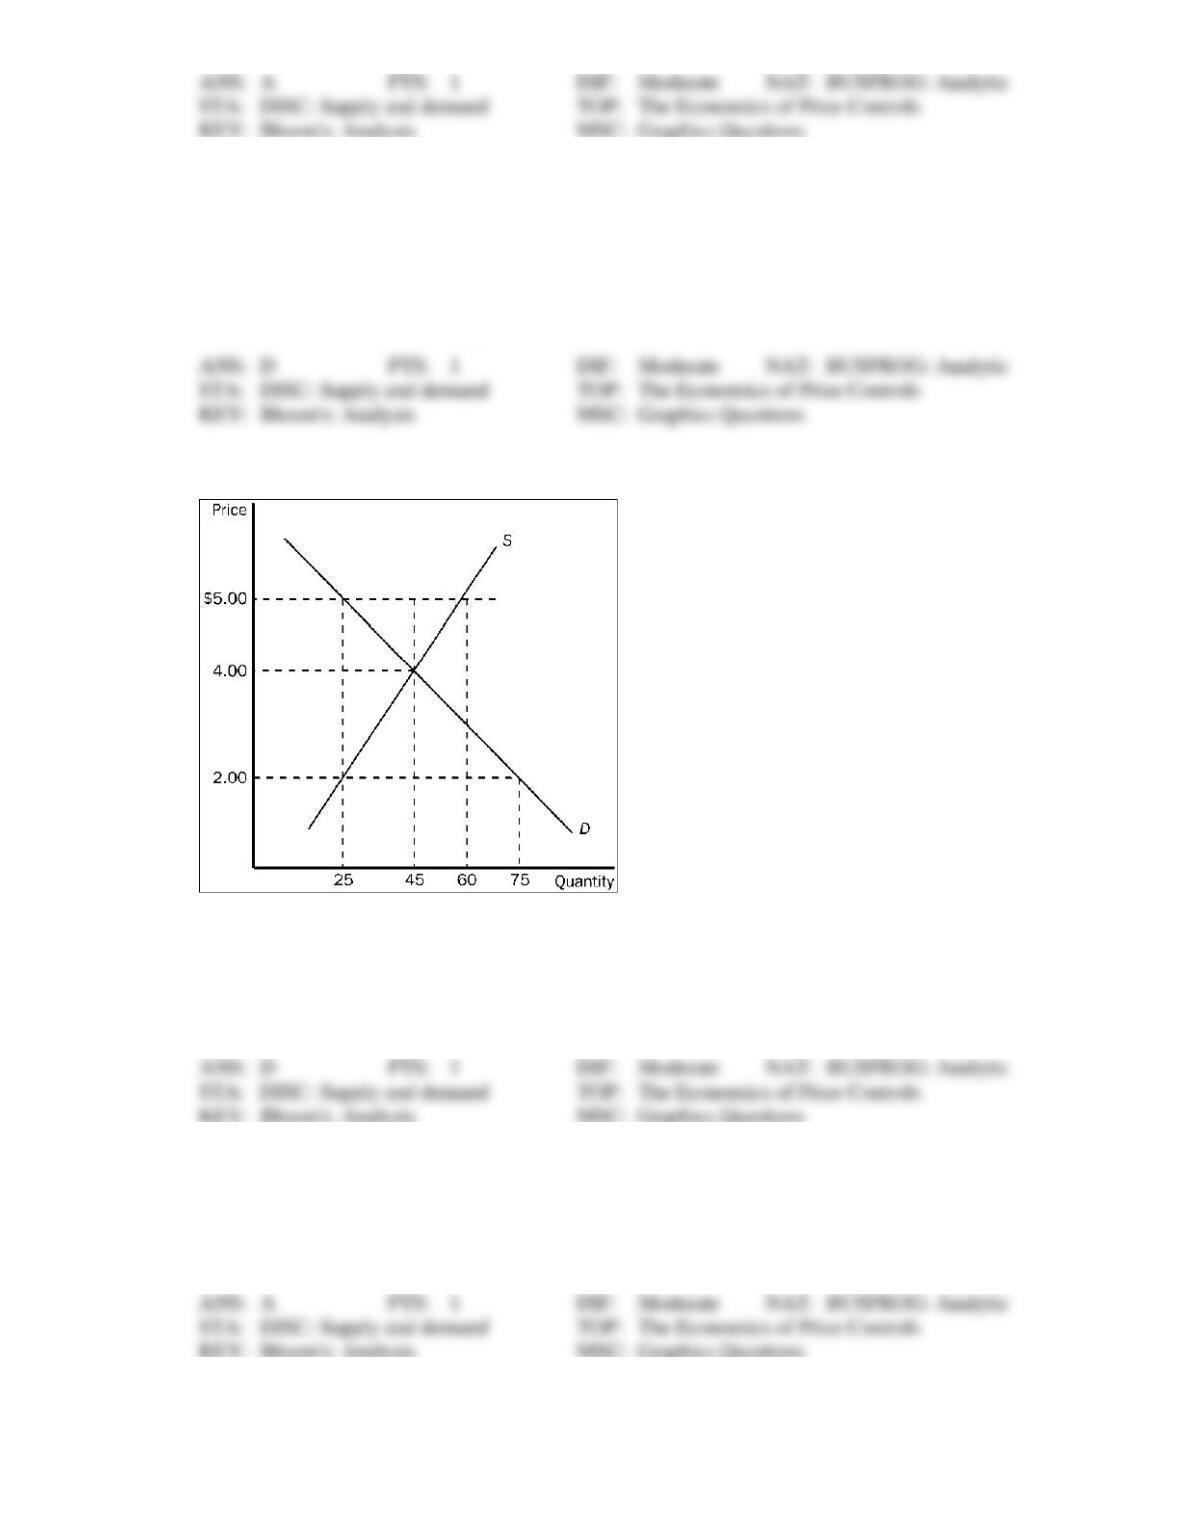
199. Refer to Figure 4-18. If the government imposes a price ceiling of $2.00 in this market, the result is a
a.
surplus of 30 units of the good.
b.
shortage of 20 units of the good.
c.
shortage of 30 units of the good.
d.
shortage of 50 units of the good.
200. Refer to Figure 4-18. In this market, which of the following price controls would be binding?
a.
a price ceiling of $2.00, and it would cause a shortage
b.
a price ceiling of $5.00, and it would cause a surplus
c.
a price floor of $2.00, and it would cause a shortage
d.
All of the above are correct.
201. Refer to Figure 4-18. The price of the good would continue to serve as the rationing mechanism if
a.
a price ceiling of $4.00 were imposed.
b.
a price ceiling of $5.00 were imposed.
c.
a price floor of $3.00 were imposed.
d.
All of the above are correct.
Figure 4-19
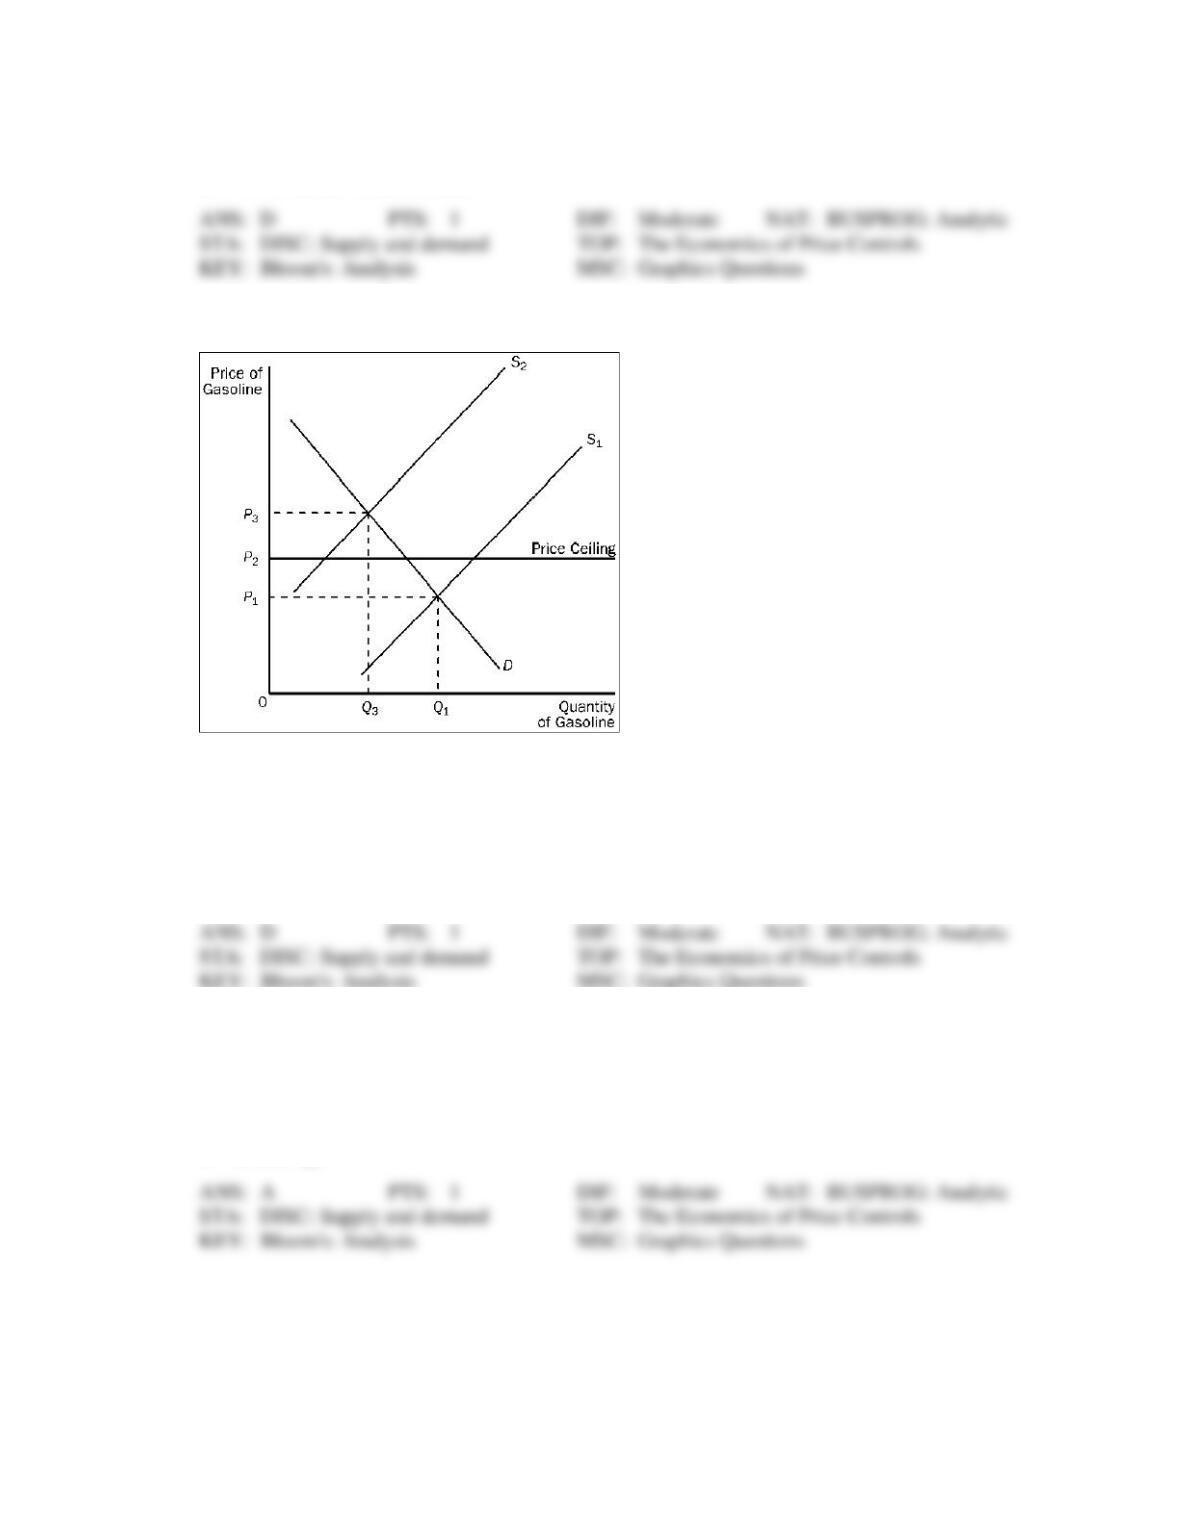
202. Refer to Figure 4-19. When the price ceiling applies in this market and the supply curve for gasoline
shifts from S1 to S2,
a.
the price will increase to P3.
b.
a surplus will occur at the new market price of P2.
c.
the market price will stay at P1 due to the price ceiling.
d.
a shortage will occur at the price ceiling of P2.
203. Refer to Figure 4-19. When the price ceiling applies in this market and the supply curve for gasoline
shifts from S1 to S2, the resulting quantity of gasoline that is bought and sold is
a.
less than Q3.
b.
Q3
c.
between Q1 and Q3.
d.
at least Q1.
Figure 4-20
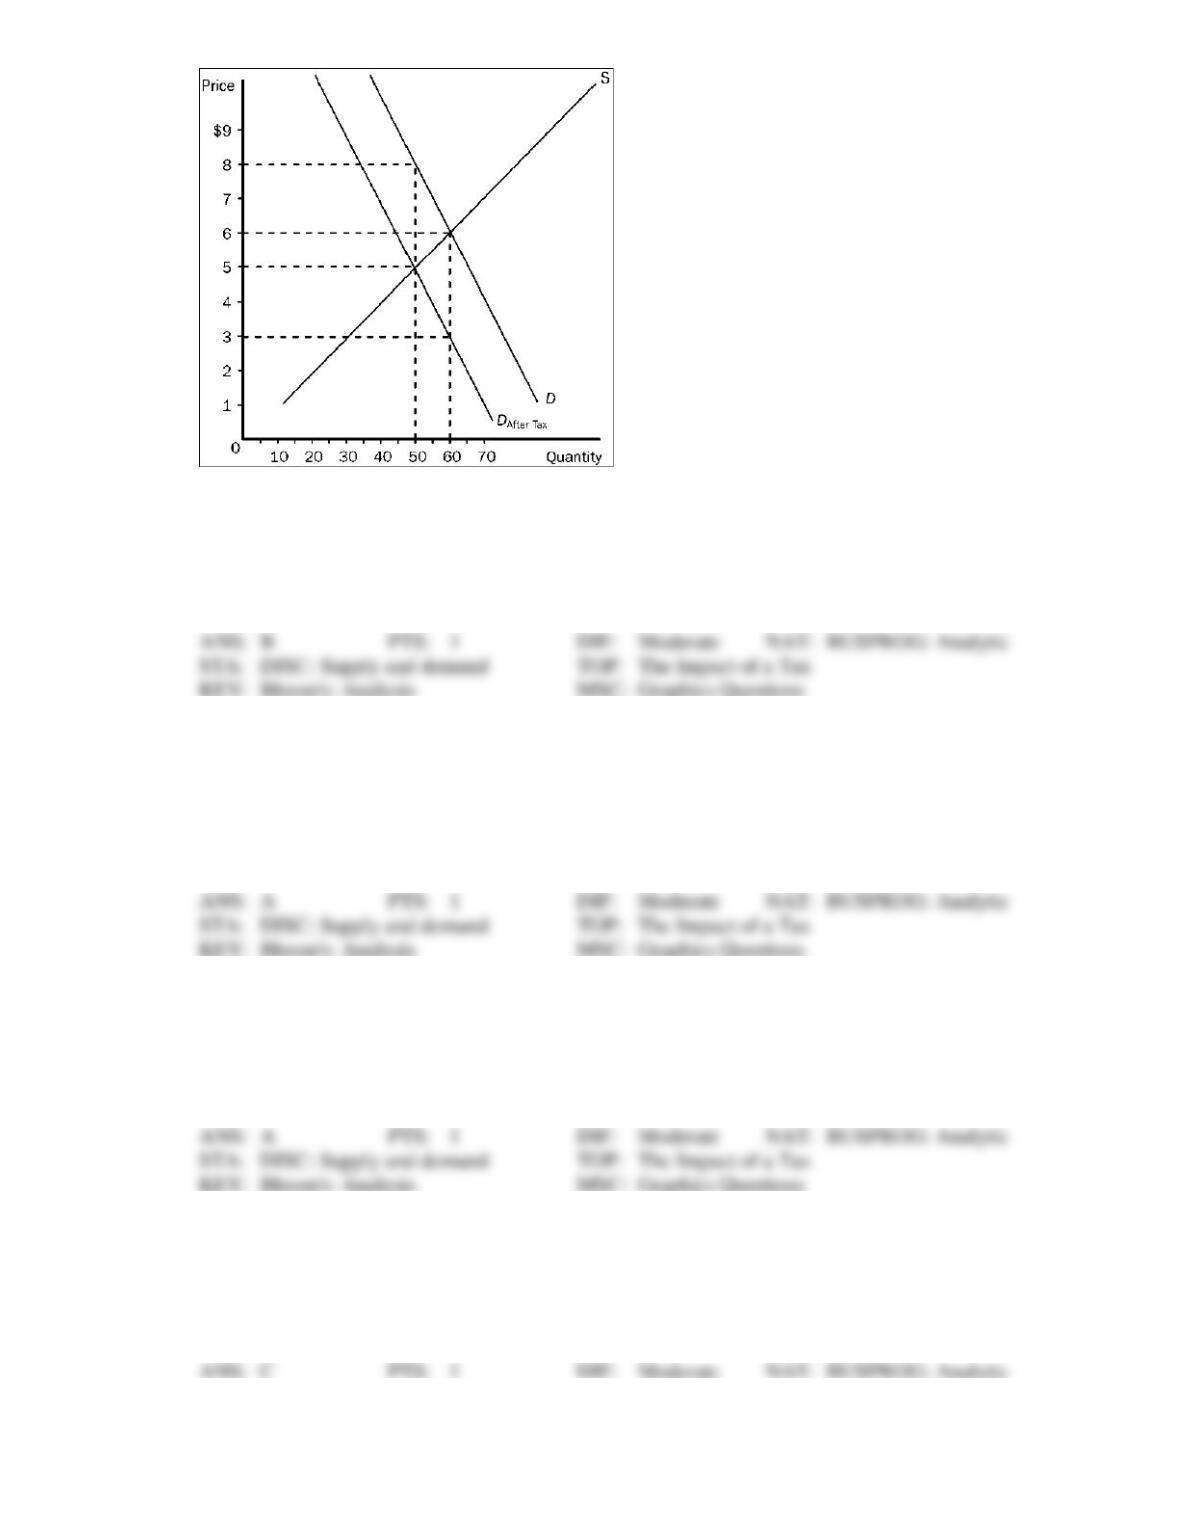
204. Refer to Figure 4-20. The equilibrium price in the market before the tax is imposed is
a.
$8.
b.
$6.
c.
$5.
d.
$3.
205. Refer to Figure 4-20. As the figure is drawn, who sends the tax payments to the government?
a.
the buyers
b.
the sellers
c.
A portion of the tax payments is sent by the buyers and the remaining portion is sent by
the sellers.
d.
The question of who sends the tax payments cannot be determined from the figure.
206. Refer to Figure 4-20. The price that buyers pay after the tax is imposed is
a.
$8.
b.
$6.
c.
$5.
d.
$3.
207. Refer to Figure 4-20. The price that sellers receive after the tax is imposed is
a.
$8.
b.
$6.
c.
$5.
d.
$3.
208. Refer to Figure 4-20. The amount of the tax per unit is
a.
$1.
b.
$2.
c.
$3.
d.
$5.
209. Refer to Figure 4-20. The burden of the tax on buyers is
a.
$1.00 per unit.
b.
$1.50 per unit.
c.
$2.00 per unit.
d.
$3.00 per unit.
210. Refer to Figure 4-20. The burden of the tax on sellers is
a.
$1.00 per unit.
b.
$1.50 per unit.
c.
$2.00 per unit.
d.
$3.00 per unit.
211. Refer to Figure 4-20. Suppose the same S and D curves apply, and a tax of the same amount per unit as
shown here is imposed. Now, however, the sellers of the good, rather than the buyers, are required to
pay the tax to the government. Now, relative to the case depicted in the figure,
a.
the burden on buyers will be larger and the burden on sellers will be smaller.
b.
the burden on buyers will be smaller and the burden on sellers will be larger.
c.
the burden on buyers will be the same and the burden on sellers will be the same.
d.
The relative burdens in the two cases cannot be determined without further information.
Figure 4-21
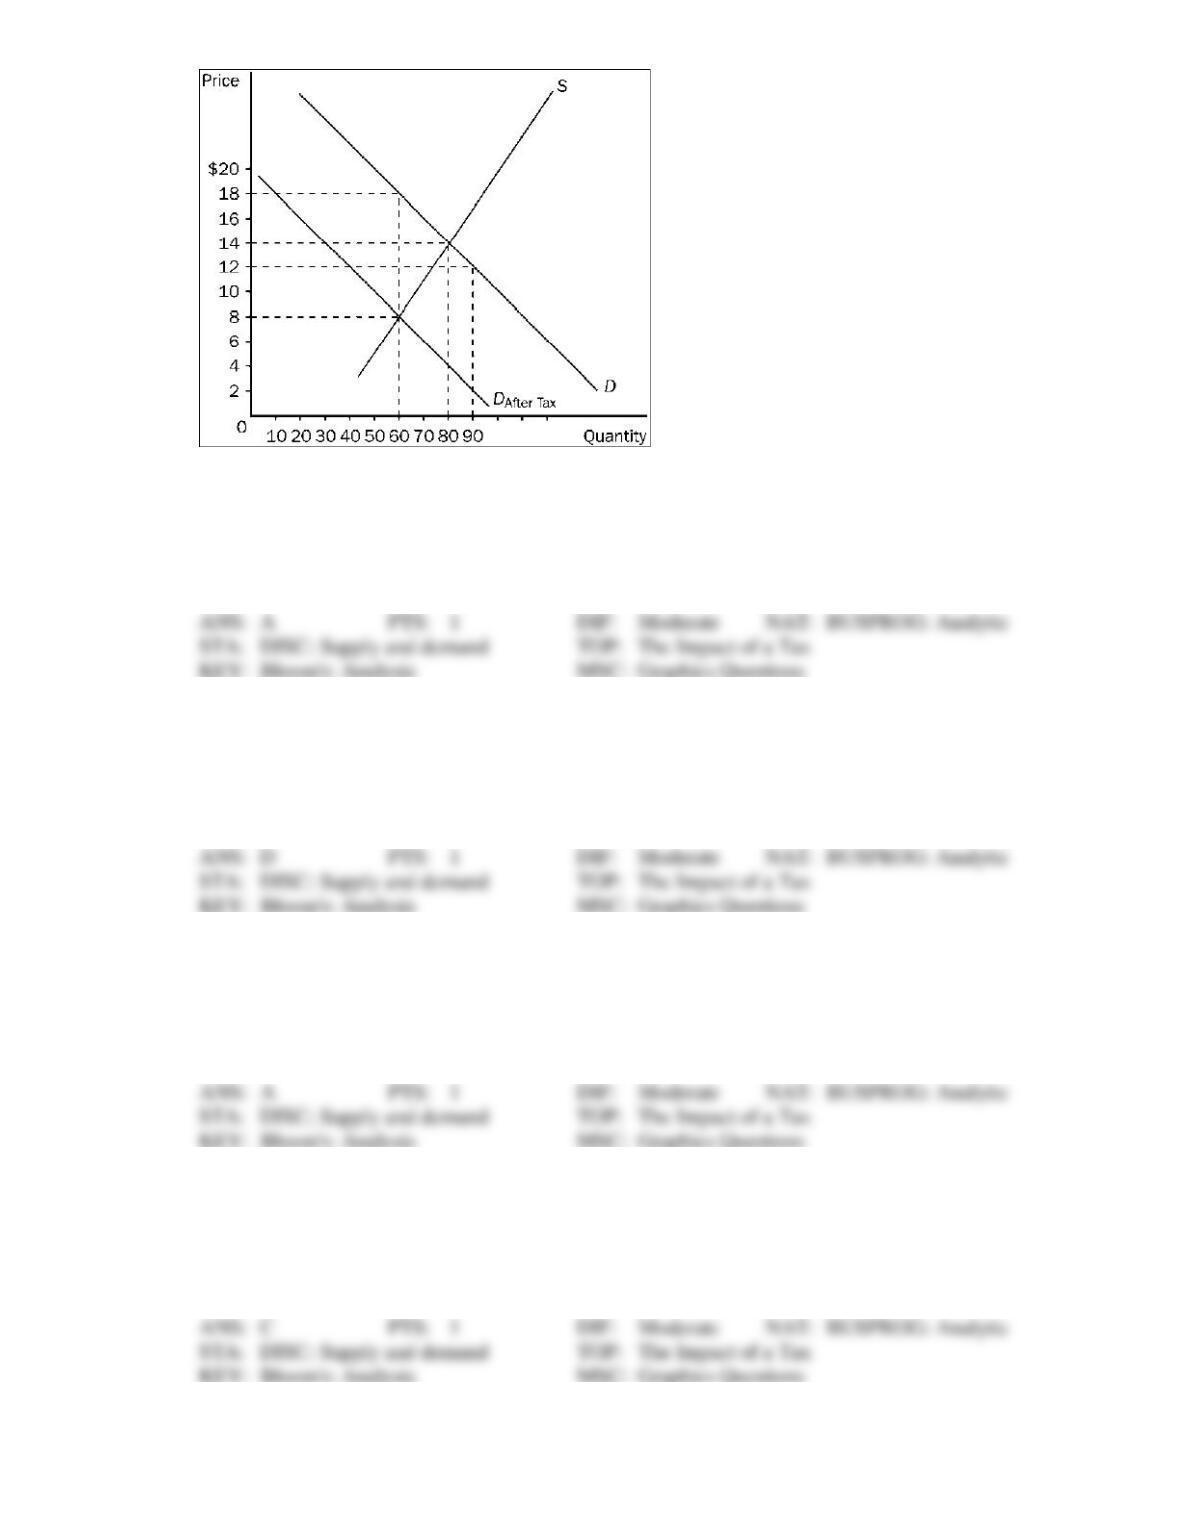
212. Refer to Figure 4-21. The price paid by buyers after the tax is imposed is
a.
$18.
b.
$14.
c.
$12.
d.
$8.
213. Refer to Figure 4-21. The price received by sellers after the tax is imposed is
a.
$18.
b.
$14.
c.
$12.
d.
$8.
214. Refer to Figure 4-21. The amount of the tax per unit is
a.
$10.
b.
$6.
c.
$4.
d.
$2.
215. Refer to Figure 4-21. The per-unit burden of the tax is
a.
$4 on buyers and $4 on sellers.
b.
$5 on buyers and $5 on sellers.
c.
$4 on buyers and $6 on sellers.
d.
$6 on buyers and $4 on sellers.
216. Refer to Figure 4-21. How much tax revenue does this tax produce for the government?
a.
$480
b.
$600
c.
$800
d.
$1,080
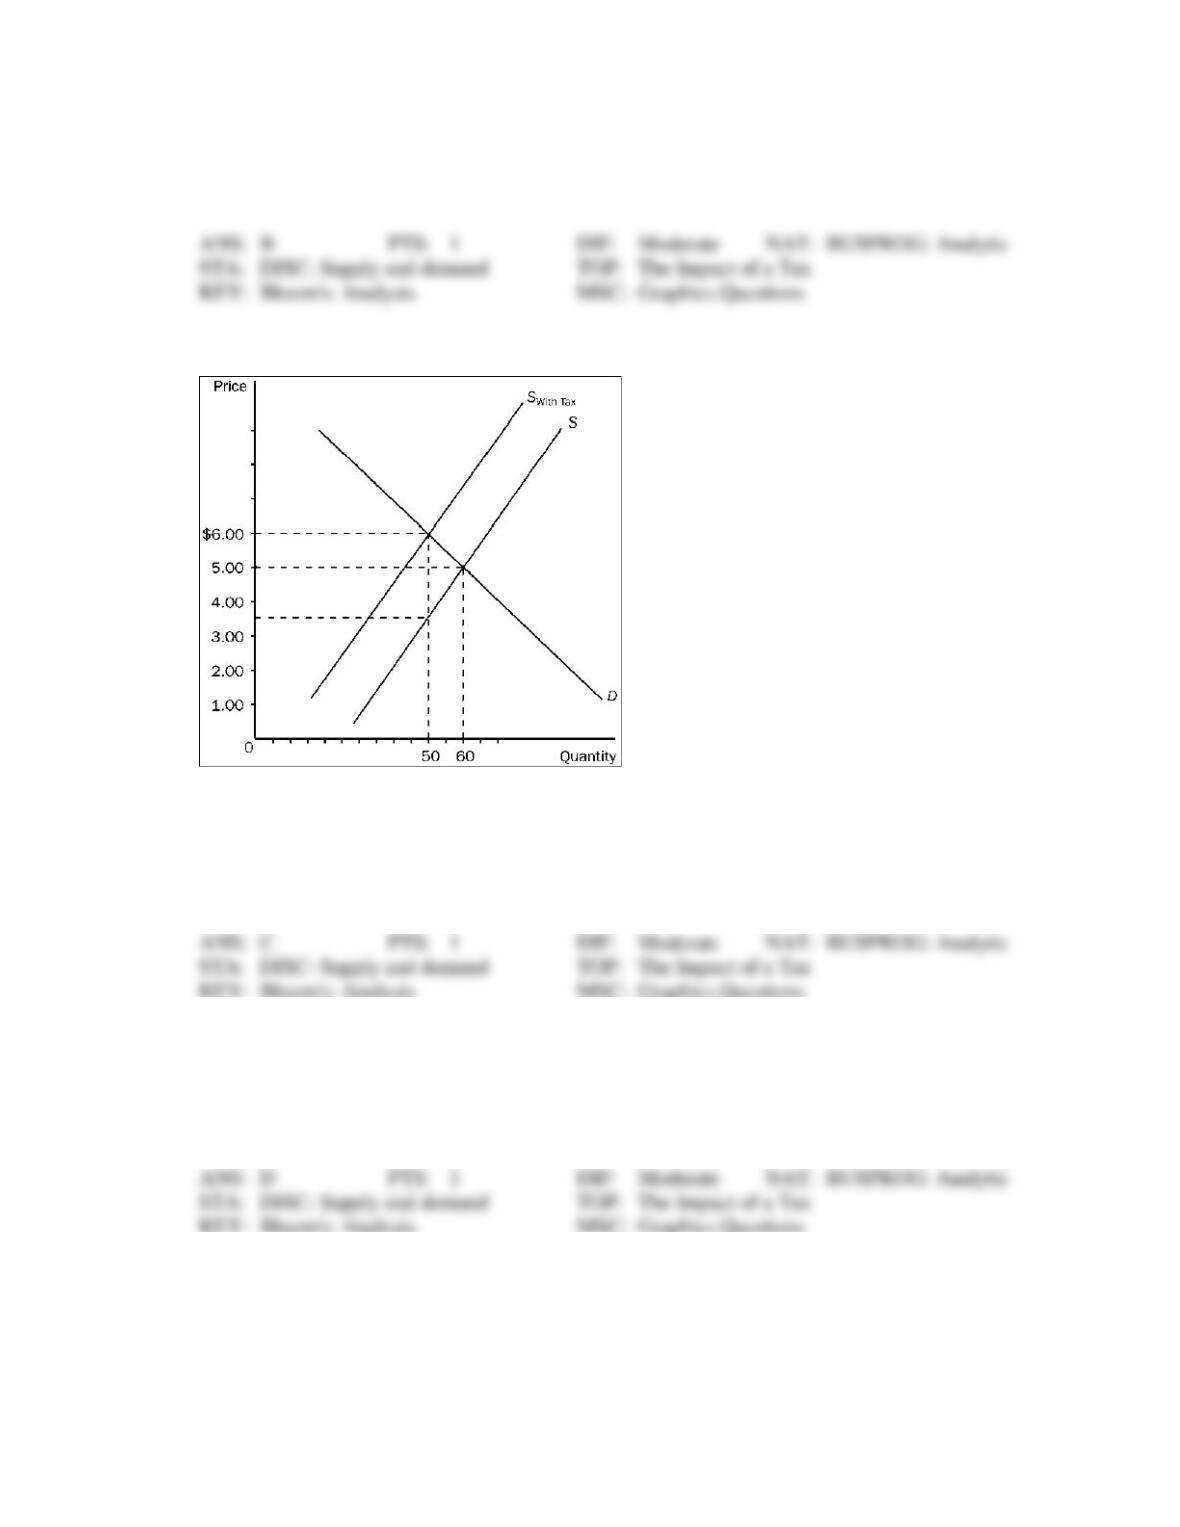
Figure 4-22
217. Refer to Figure 4-22. The equilibrium price in the market before the tax is imposed is
a.
$1.00.
b.
$3.50.
c.
$5.00.
d.
$6.00.
218. Refer to Figure 4-22. The price paid by buyers after the tax is imposed is
a.
$1.00.
b.
$3.50.
c.
$5.00.
d.
$6.00.
219. Refer to Figure 4-22. The effective price sellers receive after the tax is imposed is
a.
$1.00.
b.
$3.50.
c.
$5.00.
d.
$6.00.
220. Refer to Figure 4-22. The amount of the tax per unit is
a.
$1.00.
b.
$1.50.
c.
$2.50.
d.
$3.50.
221. Refer to Figure 4-22. From this tax the government will collect a total of
a.
$125.00.
b.
$175.00.
c.
$200.00.
d.
$250.00.
222. Refer to Figure 4-22. Buyers pay how much of the tax per unit?
a.
$1.00.
b.
$1.50.
c.
$2.50.
d.
$3.00.
223. Refer to Figure 4-22. Sellers pay how much of the tax per unit?
a.
$1.00.
b.
$1.50.
c.
$2.50.
d.
$3.00.
224. Refer to Figure 4-22. Suppose the same S and D curves apply, and a tax of the same amount per unit as
shown here is imposed. Now, however, the buyers of the good, rather than the sellers, are required to
pay the tax to the government. Now,
a.
the burden on buyers will be larger than in the case illustrated in Figure 4-22.
b.
the burden on sellers will be smaller than in the case illustrated in Figure 4-22.
c.
a downward shift of the demand curve replaces the upward shift of the supply curve.
d.
All of the above are correct.
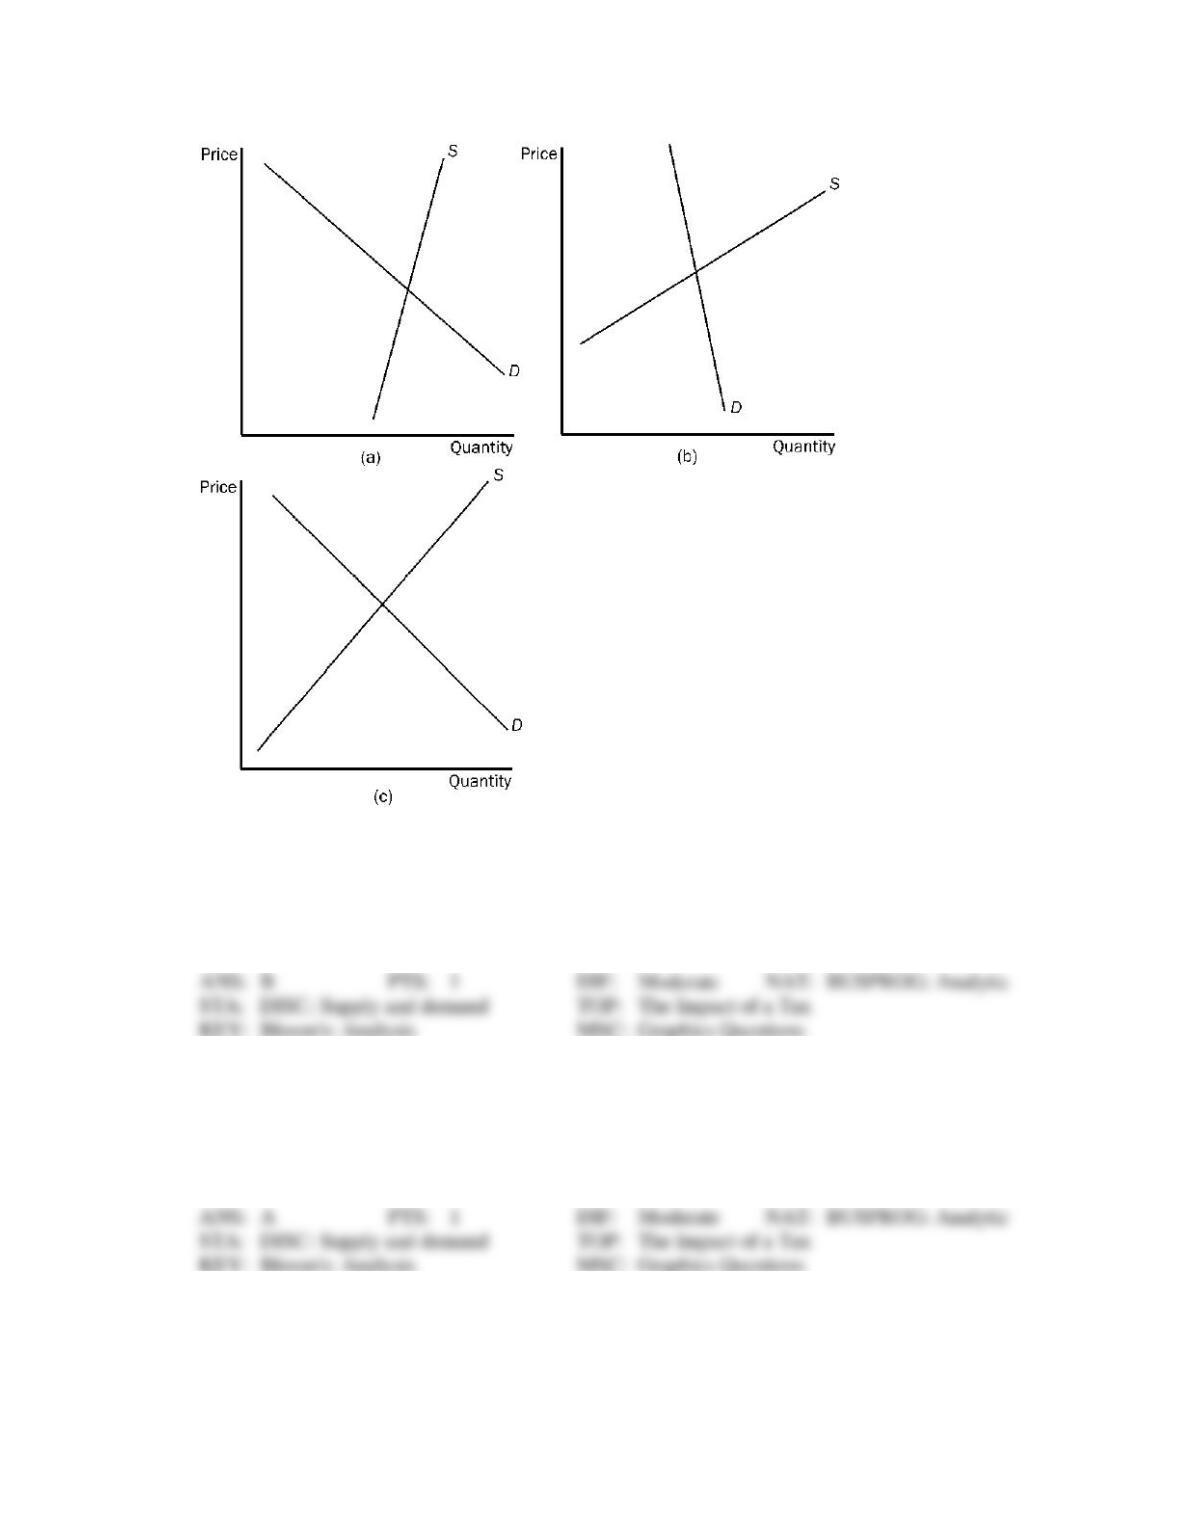
Figure 4-23
225. Refer to Figure 4-23. In which market will the majority of the tax burden fall on the buyer?
a.
market (a)
b.
market (b)
c.
market (c)
d.
All of the above are correct.
226. Refer to Figure 4-23. In which market will the majority of the tax burden fall on the seller?
a.
market (a)
b.
market (b)
c.
market (c)
d.
All of the above are correct.
227. Refer to Figure 4-23. In which market will the tax burden be most equally divided between the buyer
and the seller?
a.
market (a)