The Market Forces of Supply and Demand 775
41.
Which of the following characteristics is required for a perfectly competitive market?
a.
The goods offered for sale are exactly the same.
b.
There are so many buyers and sellers that no single buyer or seller has any influence over the
market price.
c.
It is difficult for new sellers to enter the market.
d.
Both a and b are correct.
42.
Which of the following is the least likely to be a competitive market?
a.
ice cream
b.
soybeans
c.
cable television
d.
new houses
43.
Assume the market for tennis balls is perfectly competitive. When one tennis ball producer exits
the market,
a.
the price of tennis balls increases.
b.
the price of tennis balls decreases.
c.
the price of tennis balls does not change.
d.
there is no longer a market for tennis balls.
44.
Assume the market for pork is perfectly competitive. When one pork buyer exits the market,
a.
the price of pork increases.
b.
the price of pork decreases.
c.
the price of pork does not change.
d.
there is no longer a market for pork.
The Market Forces of Supply and Demand 777
45.
Which of the following is not a reason perfect competition is a useful simplification, despite the
diversity of market
types we find in the world?
a.
Perfectly competitive markets are the easiest to analyze because everyone participating in the
market takes
the price as given by market conditions.
b.
Some degree of competition is present in most markets.
c.
There are many buyers and many sellers in all types of markets.
d.
Many of the lessons that we learn by studying supply and demand under perfect competition
apply in more
complicated markets as well.
46.
If a firm is a price taker, it operates in a
a.
competitive market.
b.
monopoly market.
c.
oligopoly market.
d.
monopolistically competitive market.
47.
A monopoly is a market with one
a.
seller, and that seller is a price taker.
b.
seller, and that seller sets the price.
c.
buyer, and that buyer is a price taker.
d.
buyer, and that buyer sets the price.
48.
Which of the following would most likely serve as an example of a monopoly?
a.
a bakery in a large city
b.
a bank in a large city
c.
a local cable television company
d.
a small group of corn farmers
49.
Which of the following would most likely serve as an example of a monopoly?
a.
a restaurant in a large city
b.
a dry cleaners in a large city
c.
a local gas station
d.
a local electrical company
The Market Forces of Supply and Demand 779
Multiple Choice – Section 02: Demand
1.
The quantity demanded of a good is the amount that buyers are
a.
willing to purchase.
b.
willing and able to purchase.
c.
willing, able, and need to purchase.
d.
able to purchase.
2.
An increase in quantity demanded
a.
results in a movement downward and to the right along a demand curve.
b.
results in a movement upward and to the left along a demand curve.
c.
shifts the demand curve to the left.
d.
shifts the demand curve to the right.
3.
A decrease in quantity demanded
a.
results in a movement downward and to the right along a demand curve.
b.
results in a movement upward and to the left along a demand curve.
c.
shifts the demand curve to the left.
d.
shifts the demand curve to the right.
4.
A movement upward and to the left along a demand curve is called a(n)
a.
increase in demand.
b.
decrease in demand.
c.
decrease in quantity demanded.
d.
increase in quantity demanded.
5.
A movement downward and to the right along a demand curve is called a(n)
a.
increase in demand.
b.
decrease in demand.
c.
decrease in quantity demanded.
d.
increase in quantity demanded.
6.
An increase in the price of a good will
a.
increase demand.
b.
decrease demand.
c.
increase quantity demanded.
d.
decrease quantity demanded.

7.
A decrease in the price of a good will
a.
increase demand.
b.
decrease demand.
c.
increase quantity demanded.
d.
decrease quantity demanded.
8.
When the price of a good or service changes,
a.
the supply curve shifts in the opposite direction.
b.
the demand curve shifts in the opposite direction.
c.
the demand curve shifts in the same direction.
d.
there is a movement along a given demand curve.
The Market Forces of Supply and Demand 783
9.
A decrease in the price of a good would
a.
increase the supply of the good.
b.
increase the quantity demanded of the good.
c.
give producers an incentive to produce more to keep profits from falling.
d.
shift the supply curve for the good to the left.
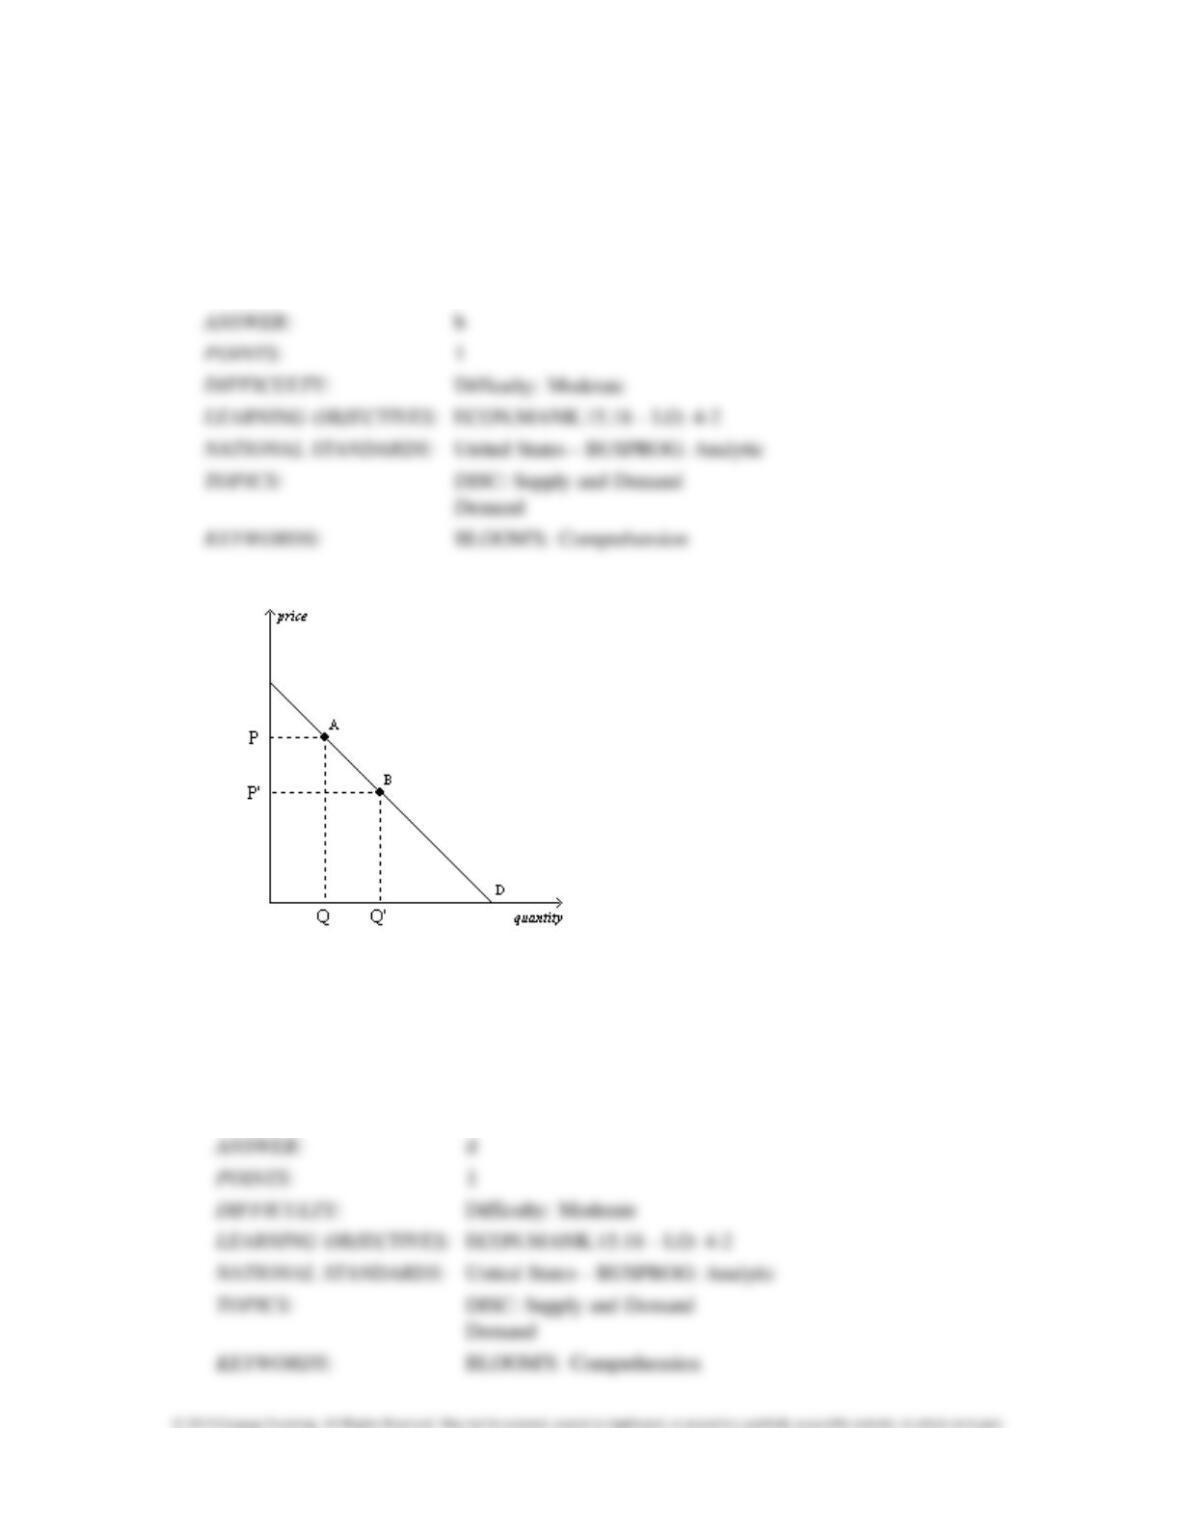
Figure 4-1
10.
Refer to Figure 4-1. The movement from point A to point B on the graph shows a(n)
a.
decrease in demand.
b.
increase in demand.
c.
decrease in quantity demanded.
d.
increase in quantity demanded.

11.
Refer to Figure 4-1. The movement from point A to point B on the graph is caused by a(n)
a.
increase in price.
b.
decrease in price.
c.
decrease in the price of a substitute good.
d.
increase in income.
12.
Refer to Figure 4-1. It is apparent from the figure that the
a.
good is inferior.
b.
demand for the good decreases as income increases.
c.
demand for the good conforms to the law of demand.
d.
All of the above are correct.
The Market Forces of Supply and Demand 785
13.
“Other things equal, when the price of a good rises, the quantity demanded of the good falls, and
when the price
falls, the quantity demanded rises.” This relationship between price and quantity
demanded
a.
applies to most goods in the economy.
b.
is represented by a downward-sloping demand curve.
c.
is referred to as the law of demand.
d.
All of the above are correct.
14.
“Other things equal, when the price of a good rises, the quantity demanded of the good falls, and
when the price
falls, the quantity demanded rises.” This relationship between price and quantity
demanded is referred to as
a.
equilibrium.
b.
the law of demand.
c.
the relationship between supply and demand.
d.
the definition of an inferior good.

15.
The law of demand states that, other things equal, when the price of a good
a.
falls, the demand for the good rises.
b.
rises, the quantity demanded of the good rises.
c.
rises, the demand for the good falls.
d.
falls, the quantity demanded of the good rises.
16.
The law of demand states that, other things equal, an increase in
a.
price causes quantity demanded to increase.
b.
price causes quantity demanded to decrease.
c.
quantity demanded causes price to increase.
d.
quantity demanded causes price to decrease.

The Market Forces of Supply and Demand 787
17.
Which of these statements best represents the law of demand?
a.
When buyers’ tastes for a good increase, they purchase more of the good.
b.
When income levels increase, buyers purchase more of most goods.
c.
When the price of a good decreases, buyers purchase more of the good.
d.
When buyers’ demands for a good increase, the price of the good increases.
18.
A downward-sloping demand curve illustrates
a.
that demand decreases over time.
b.
that prices fall over time.
c.
the relationship between income and quantity demanded.
d.
the law of demand.
19.
Kari downloads 7 songs per month when the price is $1.29 per song and 10 songs per month
when the price is $0.99 per song. Kari’s behavior demonstrates the law of
a.
price.
b.
supply.
c.
demand.
d.
income.
20.
Which of the following demonstrates the law of demand?
a.
After Jon got a raise at work, he bought more pretzels at $1.50 per pretzel than he did before
his raise.
b.
Melissa buys fewer muffins at $0.75 per muffin than at $1 per muffin, other things equal.
c.
Dave buys more donuts at $0.25 per donut than at $0.50 per donut, other things equal.
d.
Kendra buys fewer Snickers at $0.60 per Snickers after the price of Milky Ways falls to $0.50
per Milky
Way.
The Market Forces of Supply and Demand 789
21.
The following table contains a demand schedule for a good.
Price
Quantity Demanded
$10
100
$20
Q1
If the law of demand applies to this good, then Q1 could be
a.
0.
b.
100.
c.
200.
d.
400.
22.
The following table contains a demand schedule for a good.
Price
Quantity Demanded
$30
A
$50
300
If the law of demand applies to this good, then A could be
a.
0.
b.
100.
c.
200.
d.
400.
23.
The following table contains a monthly demand schedule for large, single-topping, carry–out pizzas.
Price
Quantity Demanded
$15
A
$20
25
If the law of demand applies to these pizzas, then A could be
a.
0.
b.
15.
c.
25.
d.
30.
24.
The following table contains a monthly demand schedule for large, single-topping, carry–out pizzas.
Price
Quantity Demanded
$15
A
$20
25
If the law of demand applies to these pizzas, then A could be
a. 40.
b.
35.
c.
30.
d.
All of the above could be correct.
25.
Suppose that when the price of a 16 oz. to-go cup of gourmet coffee is $4.25, students purchase
750 cups per day. If the price decreases to $3.75 per cup, which of the following is the most likely
outcome?
a.
Students would purchase fewer than 750 cups per day.
b.
Student would continue to purchase 750 cups per day.
c.
Students would purchase more than 750 cups per day.
d.
We do not have enough information to answer this question.
26.
If the price of ice cream rose to $30 per gallon, consumers would purchase fewer gallons of ice
cream than if the
price were $4 per gallon. If the price of chocolate sauce fell to $0.50 per can,
consumers would purchase more
chocolate sauce than if the price were $5 per can. These
relationships illustrate the
a.
law of supply.
b.
law of demand.
c.
difference between normal and inferior goods.
d.
difference between substitute and complement goods.
27.
A table that shows the relationship between the price of a good and the quantity demanded of that
good is called a
a.
price-quantity schedule.
b.
buyer schedule.
c.
demand schedule.
d.
demand curve.
28.
A demand schedule is a table that shows the relationship between
a.
quantity demanded and quantity supplied.
b.
income and quantity demanded.
c.
price and quantity demanded.
d.
price and income.
The Market Forces of Supply and Demand 793
29.
Which of the following is not held constant in a demand schedule?
a.
income
b.
tastes
c.
price
d.
expectations
30.
The demand curve for a good is a line that relates
a.
price and quantity demanded.
b.
income and quantity demanded.
c.
quantity demanded and quantity supplied.
d.
price and income.

31.
The line that relates the price of a good and the quantity demanded of that good is called the
demand
a.
schedule, and it usually slopes upward.
b.
schedule, and it usually slopes downward.
c.
curve, and it usually slopes upward.
d.
curve, and it usually slopes downward.
32.
When drawing a demand curve,
a.
demand is measured along the vertical axis, and price is measured along the horizontal axis.
b.
quantity demanded is measured along the vertical axis, and price is measured along the
horizontal axis.
c.
price is measured along the vertical axis, and demand is measured along the horizontal axis.
d.
price is measured along the vertical axis, and quantity demanded is measured along the
horizontal axis.