Chapter 4 – Cost-Volume-Profit Analysis: A Managerial Tool
119. The cost-volume-profit graph
a.
plots three separate lines.
b.
plots the total revenue line and the total cost line.
c.
measures the vertical axis in units sold and the horizontal axis in dollars.
d.
All of these are correct.
120. Fixed expenses that cannot be directly traced to individual segments are called
a.
cost structure.
b.
direct fixed expenses.
c.
operating leverage.
d.
common fixed expenses.
e.
indifference point.
121. Sales mix is the relative combination of
a.
inputs required to produce a product.
b.
outputs produced by a firm.
c.
products sold by a firm.
d.
distribution channels used by a firm.
e.
resources used to produce a product.
122. Sales mix can be expressed in terms of
a.
units but not revenues.
b.
either revenues or units.
c.
revenues but not units.
d.
neither units nor revenue.
123. In order for the break-even computation to be meaningful to management, sales mix should be computed using the
a.
expected mix.
b.
most desirable mix.
c.
least desirable mix.
d.
traditional mix.
e.
average mix over the past 5 years.
124. If sales remain the same and the margin of safety increases, which of the following is true?
a.
The break-even point has decreased.
b.
The common fixed costs have increased.
c.
The break-even point has remained constant.
d.
Variable costs have increased.
e.
None of these choices are correct.
Chapter 4 – Cost-Volume-Profit Analysis: A Managerial Tool
125. Information about the Harmon Company’s two products includes:
Product X
Product Y
Unit selling price
$9.00
$9.00
Unit variable costs:
Manufacturing
$5.25
$6.75
Selling
0.75
0.75
Total variable costs
$6.00
$7.50
Monthly fixed costs are as follows:
Manufacturing
$ 82,500
Selling and administrative
45,000
Total fixed costs
$127,500
What is the total monthly sales volume in units required to break even when the sales mix in units is 70% Product X and
30% Product Y?
a.
8,333 units
b.
50,000 units
c.
16,667 units
d.
56,667 units
$127,500 / $2.55 = 50,000 units
126. Product 1 has a contribution margin of $6.00 per unit, and Product 2 has a contribution margin of $7.50 per unit.
Total fixed costs are $300,000. Sales mix and total volume varies from one period to another. Which of the following is
true?
a.
At a sales volume in excess of 25,000 units of 1 and 25,000 units of 2, operations will be profitable.
b.
The ratio of net profit to total sales for 2 will be larger than the ratio of net profit to total sales for 1.
c.
Variable costs are $1.50 more for 2 than for 1.
d.
The ratio of contribution margin to total sales always will be larger for 1 than for 2.
127. The following data pertain to the three products produced by Alberts Corporation:
A
B
C
Selling price per unit
$5.00
$7.00
$6.00
Variable costs per unit
4.00
5.00
3.00
Contribution margin per unit
$1.00
$2.00
$3.00
Fixed costs are $90,000 per month.
60% of all units sold are Product A, 30% are Product B, and 10% are Product C.
What is the monthly break-even point for total units?
a.
45,000 units
b.
36,000 units
c.
60,000 units
d.
180,000 units
Chapter 4 – Cost-Volume-Profit Analysis: A Managerial Tool
$90,000 / $1.50 = 60,000 units
128. If actual sales equal break-even sales
a.
the margin of safety is negative.
b.
the margin of safety is positive.
c.
it is impossible to say anything about the margin of safety.
d.
the margin of safety equals zero.
e.
the margin of safety is negative or positive.
129. The units sold or expected to be sold or sales revenue earned or expected to be earned above the break-even volume
is called
a.
variable cost ratio.
b.
degree of operating leverage.
c.
break-even point.
d.
margin of safety.
e.
contribution margin ratio.
130. The margin of safety in dollars is
a.
expected sales minus expected profit.
b.
expected sales minus sales at break-even.
c.
costs at break-even minus expected profit.
d.
expected costs minus costs at break-even.
e.
expected profit minus actual profit.
131. ____ can be measured for a given level of sales by taking the ratio of contribution margin to operating income.
a.
Contribution margin ratio
b.
Degree of operating leverage
c.
Break-even point
d.
Sensitivity analysis
e.
Contribution margin
132. Which of the following can be considered a measure of risk in cost-volume-profit analysis?
a.
margin of safety
b.
contribution margin
c.
break-even point
d.
sales mix
Chapter 4 – Cost-Volume-Profit Analysis: A Managerial Tool
133. Sales can decline by how much before losses are incurred?
a.
contribution margin ratio
b.
variable cost ratio
c.
sales ratio
d.
common fixed costs
e.
margin of safety
e
134. Firm X and Firm Y are competitors within the same industry. Firm X produces its product using large amounts of
direct labor. Firm Y has replaced direct labor with investment in machinery. Projected sales for both firms are 15% less
than in the prior year. Which statement regarding projected profits is true?
a.
Firm X will lose more profit than Firm Y.
b.
Firm Y will lose more profit than Firm X.
c.
Firm X and Firm Y will lose the same amount of profit.
d.
Neither Firm X nor Firm Y will lose profit.
the lower sales.
135. Operating leverage is
a.
the difference between sales and variable expense.
b.
the use of fixed costs to extract higher percentage changes in profits as sales activity changes.
c.
the portion of each sales dollar available to cover fixed costs and provide for profit.
d.
visually portrays the relationship between profits and units sold.
e.
none of these
136. A “what-if” technique that examines the impact of changes in underlying assumptions on a result is
a.
margin of safety.
b.
sales mix.
c.
indifference point.
d.
cost structure.
e.
sensitivity analysis.
e
137. Biggers Company expects the following results for the next accounting period:
Sales
$240,000
Variable costs
135,000
Fixed costs
40,000
Expected production and sales in units
3,000 units
The sales manager believes sales could be increased by 400 units if advertising expenditures were increased by $10,000.
If advertising expenditures are increased and sales increase by 400 units, the effect on operating income will be a(n)
a.
decrease of $4,000.
b.
increase of $22,000.
c.
increase of $4,000.
Chapter 4 – Cost-Volume-Profit Analysis: A Managerial Tool
d.
increase of $30,000.
e.
cannot be determined from data given.
c
138. Degree of operating leverage is calculated as
a.
Variable costs / Sales
b.
Total sales / Common fixed costs
c.
Fixed costs / Variable costs
d.
Contribution margin / Operating income
e.
Operating income / Contribution margin
139. Operating leverage is the relative mix of
a.
revenues earned and manufacturing costs.
b.
fixed and variable costs.
c.
high-volume and low-volume products.
d.
manufacturing costs and period costs.
e.
revenues earned and variable costs.
Figure 4-6.
Shorter Company had originally expected to earn operating income of $130,000 in the coming year. Shorter’s degree of
operating leverage is 2.4. Recently, Shorter revised its plans and now expects to increase sales by 20% next year.
140. Refer to Figure 4-6. What is the percent change in operating income expected by Shorter in the coming year?
a.
8.33%
b.
48.0%
c.
20.0%
d.
54.17%
e.
30.0%
Percent change in operating income = 2.4 × 20% = 48%
141. Refer to Figure 4-6. What is Shorter’s revised expected operating income for the coming year?
a.
$192,400
b.
$156,000
c.
$312,000
d.
$130,000
e.
$62,400
$130,000 + (0.48 × $130,000) = $192,400
142. Dance Unlimited plans to sell 10,000 ballet shoes at $50 each in the coming year. Unit variable cost is $30 and total
fixed cost equals $65,000.
Required:
A.) Calculate the break-even in ballet shoes.
Chapter 4 – Cost-Volume-Profit Analysis: A Managerial Tool
B.) Calculate the break-even in sales dollars.
143. Shamrock Inc. plans to sell 3,000 Irish sweaters for $200 each in the coming year. Product costs include:
Direct materials per sweater
$ 40
Direct labor per sweater
10
Variable overhead per sweater
15
Total fixed factory overhead
20,000
Variable selling expenses are $5 per sweater and fixed selling and administrative expenses total $12,000.
Required:
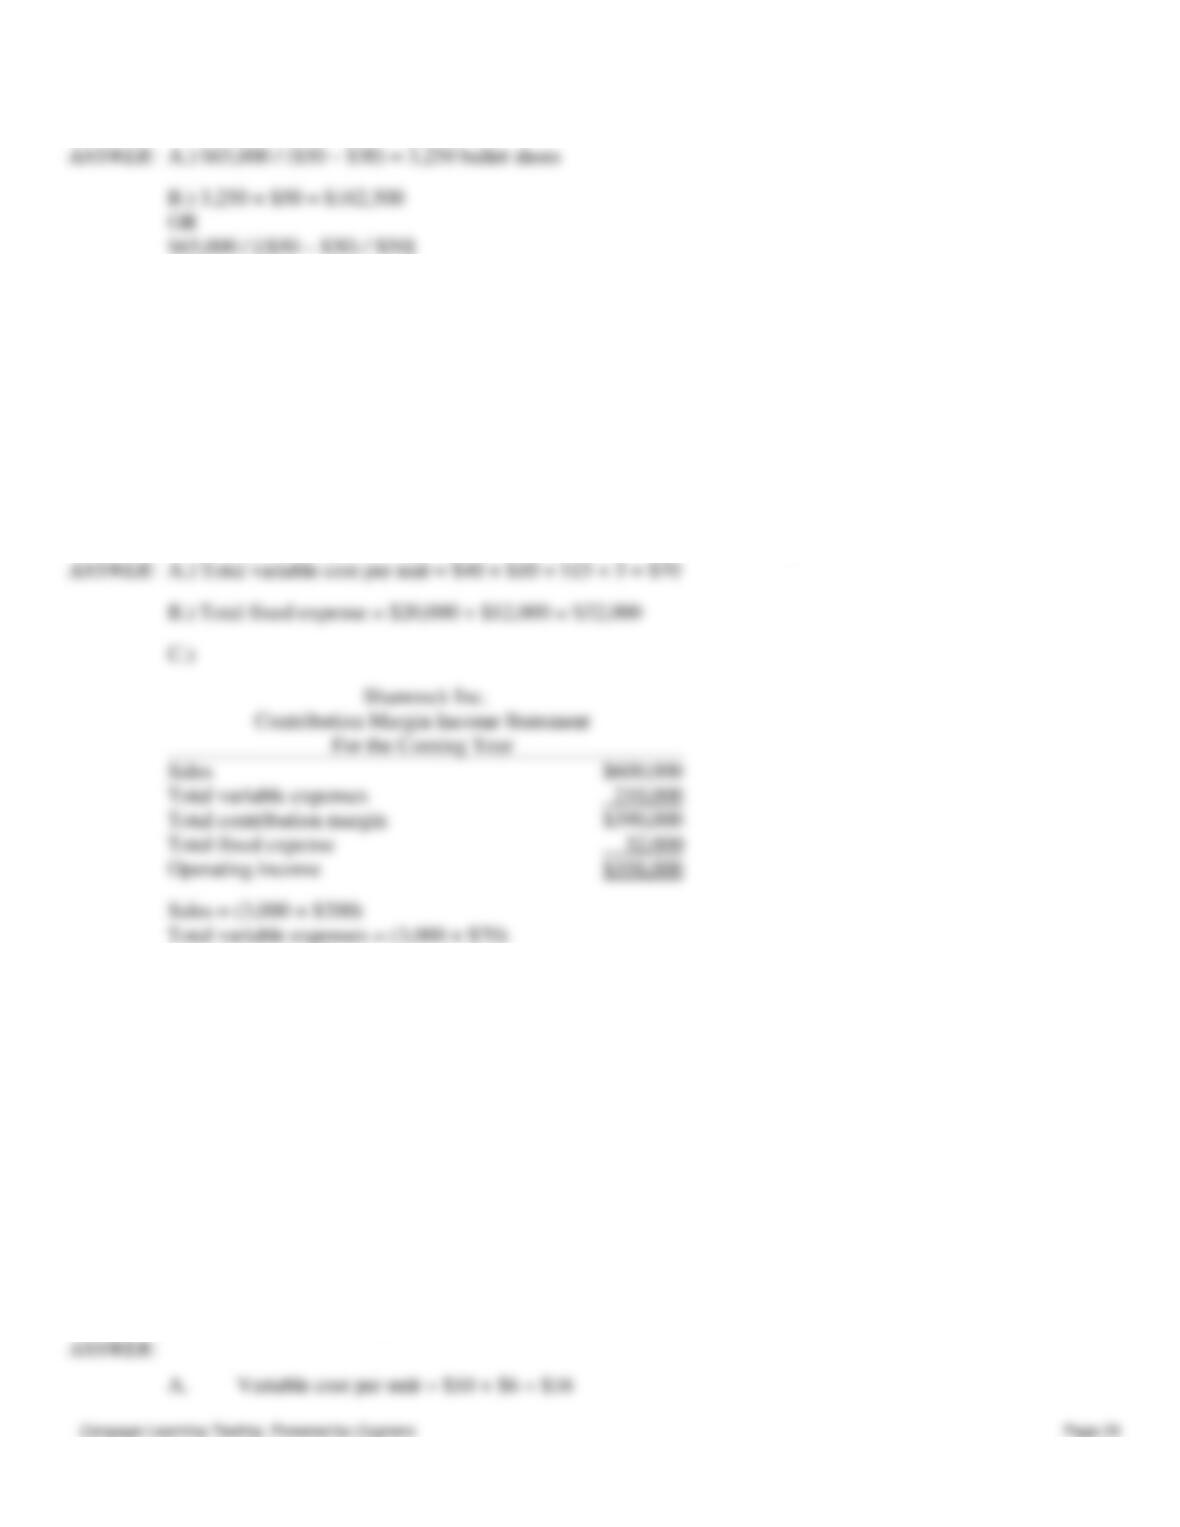
A.) Calculate the total variable cost per unit.
B.) Calculate the total fixed expenses for the year.
C.) Prepare a contribution margin income statement for Shamrock Inc. for the coming year.
Total contribution margin
Total fixed expense
Operating income
Total variable expenses = (3,000 × $70)
144. Newman Company expects to produce and sell 2,000 units next month. Data on costs follows:
Per unit costs:
Selling price
$40
Variable manufacturing costs
10
Variable selling costs
6
Total costs:
Fixed manufacturing costs
$16,000
Fixed selling costs
8,000
Required:
A.
What is the variable cost per unit?
B.
What is contribution margin per unit?
C.
What is the variable cost ratio?
D.
What is the contribution margin ratio?
A.
Variable cost per unit = $10 + $6 = $16
Chapter 4 – Cost-Volume-Profit Analysis: A Managerial Tool
145. McCallen Company expects to produce and sell 500 units next month. Data on costs follows:
Per unit costs:
Selling price
$8.00
Variable manufacturing costs
2.75
Variable selling costs
0.25
Total costs:
Fixed manufacturing costs
$1,000
Fixed selling costs
125
Required:
A.
What is the variable cost per unit?
B.
What is contribution margin per unit?
C.
What is the variable cost ratio?
D.
What is the contribution margin ratio?
A.
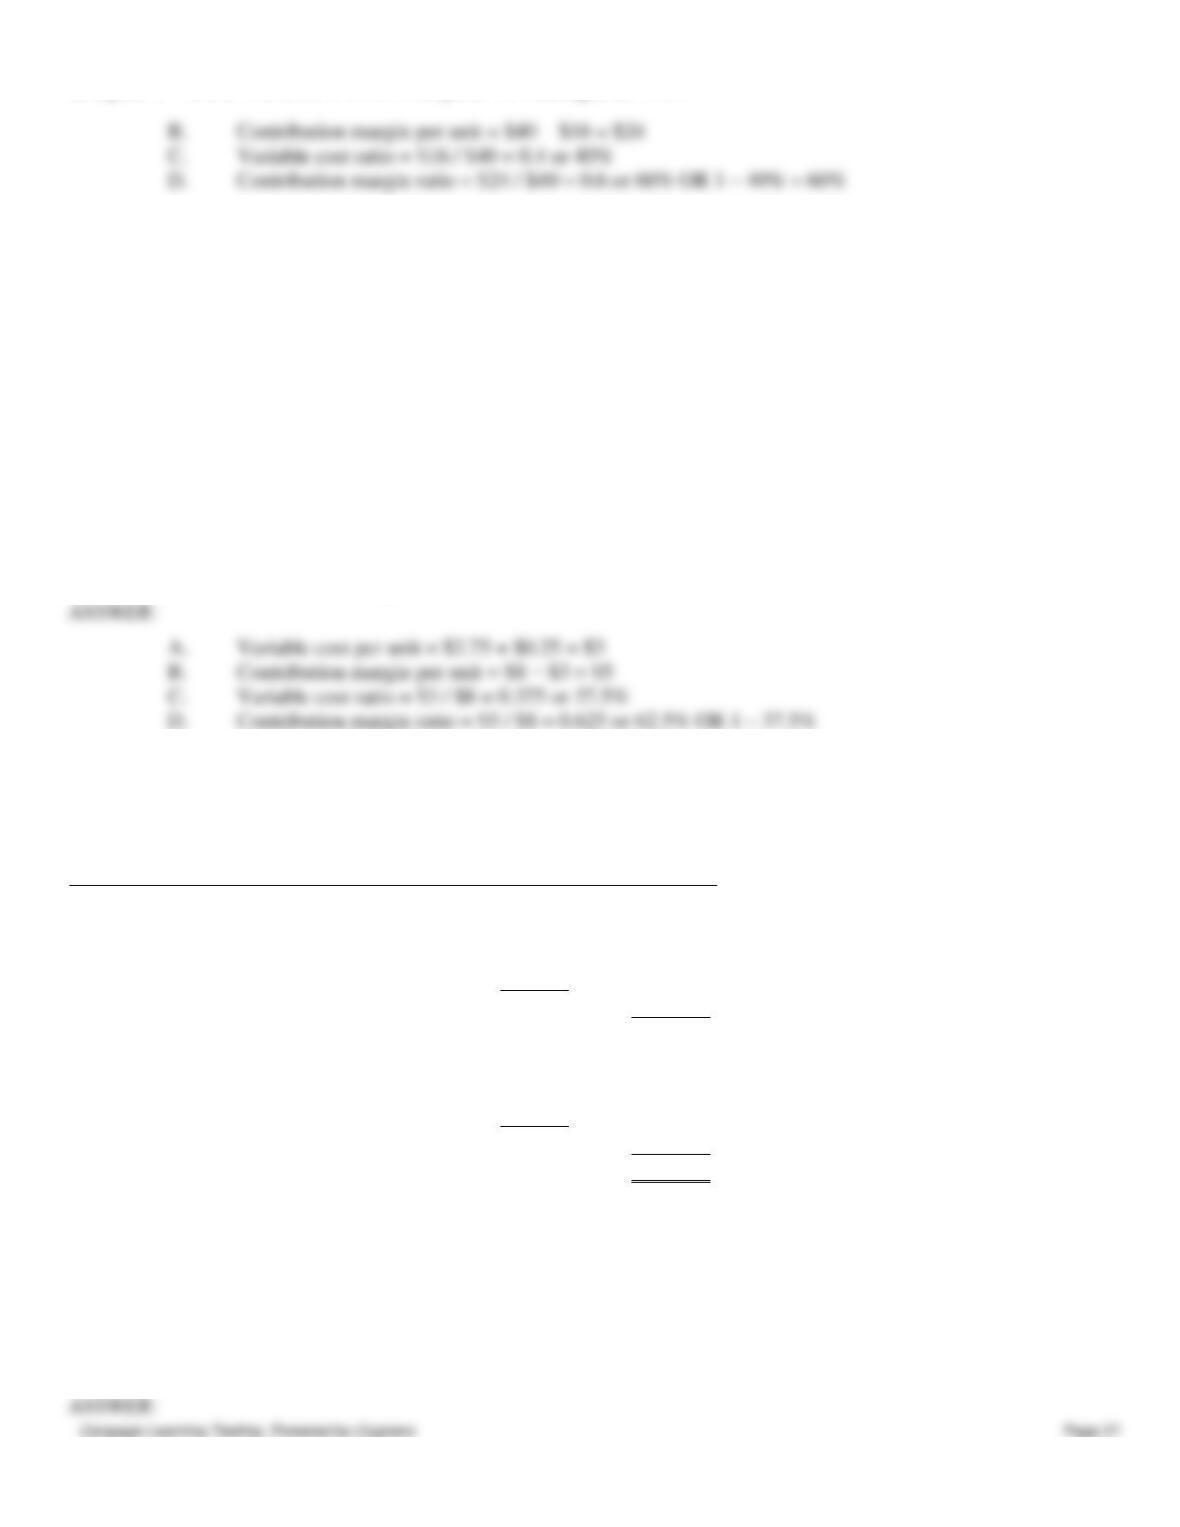
Variable cost per unit = $2.75 + $0.25 = $3
B.
Contribution margin per unit = $8 − $3 = $5
C.
Variable cost ratio = $3 / $8 = 0.375 or 37.5%
D.
Contribution margin ratio = $5 / $8 = 0.625 or 62.5% OR 1 – 37.5%
146.
Fry Company
Projected Income Statement
For the Current Year Ending December 31
Sales (12,000 units)
$240,000
Less variable costs:
Variable manufacturing costs
$60,000
Variable selling costs
36,000
Total variable costs
96,000
Contribution margin
$144,000
Less fixed costs:
Fixed manufacturing costs
$85,000
Fixed selling and administrative costs
35,000
Total fixed costs
120,000
Operating income
$ 24,000
Required:
A.
Determine the break-even point in sales dollars.
B.
The sales manager believed the company could increase sales by 1,000 units if
advertising expenditures were increased by $15,000. By how much will operating income
increase or decrease if the advertising is increased as suggested?
C.
What is the maximum amount the company could pay for advertising if the advertising
would increase sales by 1,000 units?
B.
Contribution margin per unit = $40 − $16 = $24
C.
Variable cost ratio = $16 / $40 = 0.4 or 40%
D.
Contribution margin ratio = $24 / $40 = 0.6 or 60% OR 1 – 40% = 60%
Chapter 4 – Cost-Volume-Profit Analysis: A Managerial Tool
A.
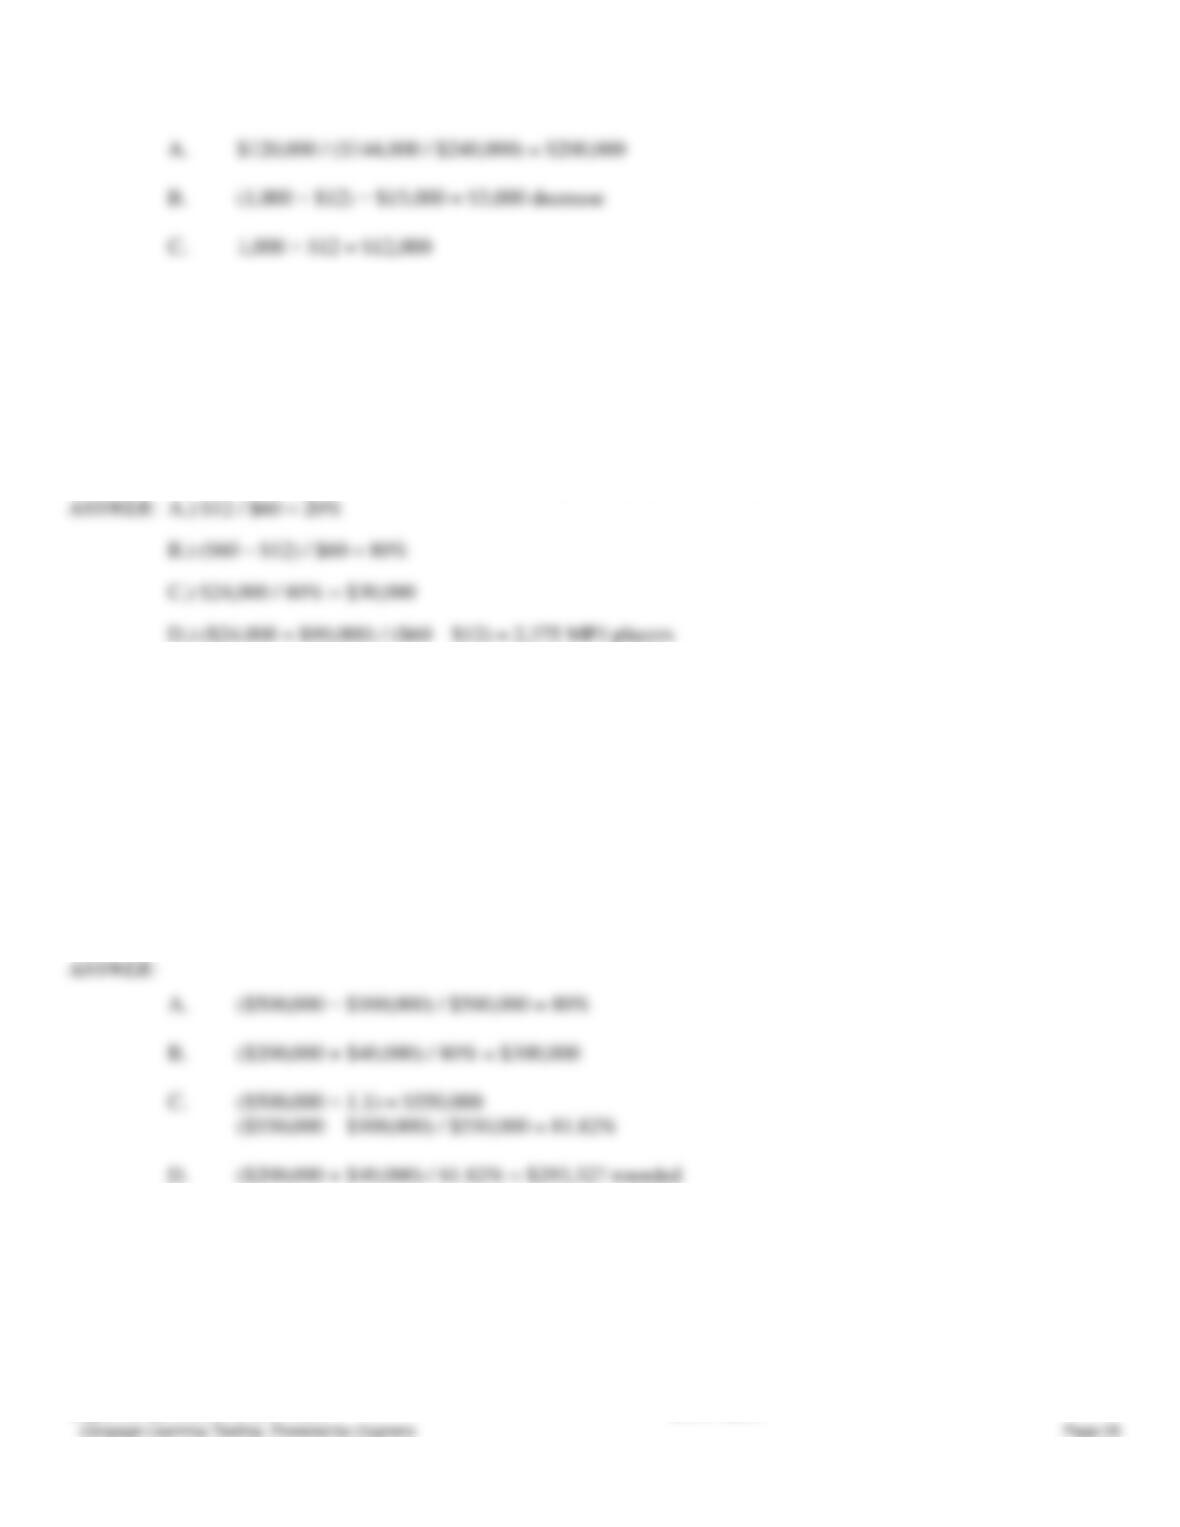
$120,000 / ($144,000 / $240,000) = $200,000
B.
(1,000 × $12) − $15,000 = $3,000 decrease
C.
1,000 × $12 = $12,000
147. Music Now plans to sell 6,000 MP3 players at $60 each in the coming year. Variable cost per unit is $12 and total
fixed cost is $24,000.
Required:
A.) Calculate the variable cost ratio.
B.) Calculate the contribution margin ratio.
C.) Calculate the break-even point in sales dollars.
D.) If Music Now has a target profit of $90,000, how many MP3 players will they have to sell?
148. A company provided the following information:
Sales
$500,000
Variable costs
100,000
Fixed costs
200,000
Required:
A.
What is the contribution margin ratio?
B.
What is the level of sales in dollars necessary to generate a profit of $40,000?
C.
What is the contribution margin ratio if the sales price is increased by 10%?
D.
Using the information in part C, what level of sales in dollars is necessary to generate a
profit of $40,000?
A.
($500,000 − $100,000) / $500,000 = 80%
B.
($200,000 + $40,000) / 80% = $300,000
C.
($500,000 × 1.1) = $550,000
($550,000 − $100,000) / $550,000 = 81.82%
D.
($200,000 + $40,000) / 81.82% = $293,327 rounded
149. Aaron Company provided the following data for next month:
Selling price per unit
$400
Variable manufacturing costs per unit
100
Fixed manufacturing costs per unit
80
Variable selling costs per unit
60
Fixed selling costs per unit
40
Expected production and sales
1,800 units
Chapter 4 – Cost-Volume-Profit Analysis: A Managerial Tool
Required:
A.
What is contribution margin per unit?
B.
What is the contribution margin ratio?
C.
What is the break-even point in units?
D.
What are the sales in dollars needed to obtain an operating income of $20,000?
A.
$400 − ($100 + $60) = $240
B.
$400 − ($100 + $60) = $240
$240 / $400 = 0.60 or 60%
C.
$400 − ($100 + $60) = $240
Fixed costs = ($80 + $40) × 1,800 = $216,000
$216,000 / $240 per unit = 900 units
D.
($216,000 + $20,000) / 60% = $393,333 rounded
150. Thomas Corporation developed the following income statement using a contribution margin approach:
Thomas Corporation
Projected Income Statement
For the Current Year Ending December 31
Sales
$750,000
Less variable costs:
Variable manufacturing costs
$280,000
Variable selling costs
120,000
Total variable costs
400,000
Contribution margin
$350,000
Less fixed costs:
Fixed manufacturing costs
$130,000
Fixed selling and administrative costs
80,000
Total fixed costs
210,000
Operating income
$140,000
The projected income statement was based on sales of 100,000 units. Thomas has the capacity to produce 120,000 units
during the year.
Required:
A.
Determine the break-even point in units.
B.
The sales manager believes the company could increase sales by 8,000 units if
advertising expenditures were increased by $22,000. By how much will income increase
or decrease if this plan is put into effect?
C.
What is the maximum amount the company could pay for advertising if the sales would
really increase by 8,000 units?
A.
$210,000 / ($7.5 − $4.00) = 60,000 units
OR $210,000 / ($350,000 / 100,000) = 60,000 units
C.
8,000 × $3.50 = $28,000
Chapter 4 – Cost-Volume-Profit Analysis: A Managerial Tool
151. The following information was extracted from the accounting records of MVP Corporation:
Selling price per unit
$ 60
Variable cost per unit
20
Total fixed costs
480,000
Required:
A.
What is MVP’s break-even point in units?
B.
How many units must be sold to earn operating income of $80,000?
C.
What is MVP’s break-even point in units if the selling price increases by 20% and the
variable costs decrease by 20%?
D.
Using the information in part C, what sales level in dollars is needed to earn an operating
income of $80,000?
A.
$480,000 / ($60 per unit − $20 per unit) = 12,000 units
B.
($480,000 + $80,000) / ($60 − $20) = 14,000 units
C.
($60 × 1.2) = $72 new sales price
($20 × 0.8) = $16 new variable cost
($72 − $16) = $56 new contribution margin
$480,000 / $56 = 8,571 units (rounded)
D.
$560,000 / 77.78% = $719,979
152. Information for Crisby Company is as follows:
Sales
$500,000
Variable costs
100,000
Fixed costs
200,000
Required:
A.
What is the break-even point in sales dollars?
B.
What sales (in dollars) are needed to generate operating income of $40,000?
A.
($500,000 − $100,000) / $500,000 = 80%
$200,000 / 80% = $250,000
B.
($500,000 − $100,000) / $500,000 = 80%
($200,000 + $40,000) / 0.80 = $300,000
153. The Noble Company manufactures two products. Information about the two products is as follows:
Product A
Product B
Selling price per unit
$80
$30
Variable costs per unit
45
15
Contribution margin per unit
35
15
The company expects fixed costs to be $189,000. The firm expects 60% of its sales (in units) to be Product A (a sales mix
of 3:2).
Required:
A.
Calculate the contribution margin per package.
Chapter 4 – Cost-Volume-Profit Analysis: A Managerial Tool
B.
Determine the break-even point in units for Products A and B.
C.
Determine the level of sales (in dollars) necessary to generate operating income of
$135,000.
Product A = $35 × 3 = $105
Product B = $15 × 2 = 30
Contribution margin per package = $105 + $30 = $135
B.
$189,000 / $135 per package = 1,400 packages
Product A units = 1,400 × 3 = 4,200 units
Product B units = 1,400 × 2 = 2,800 units
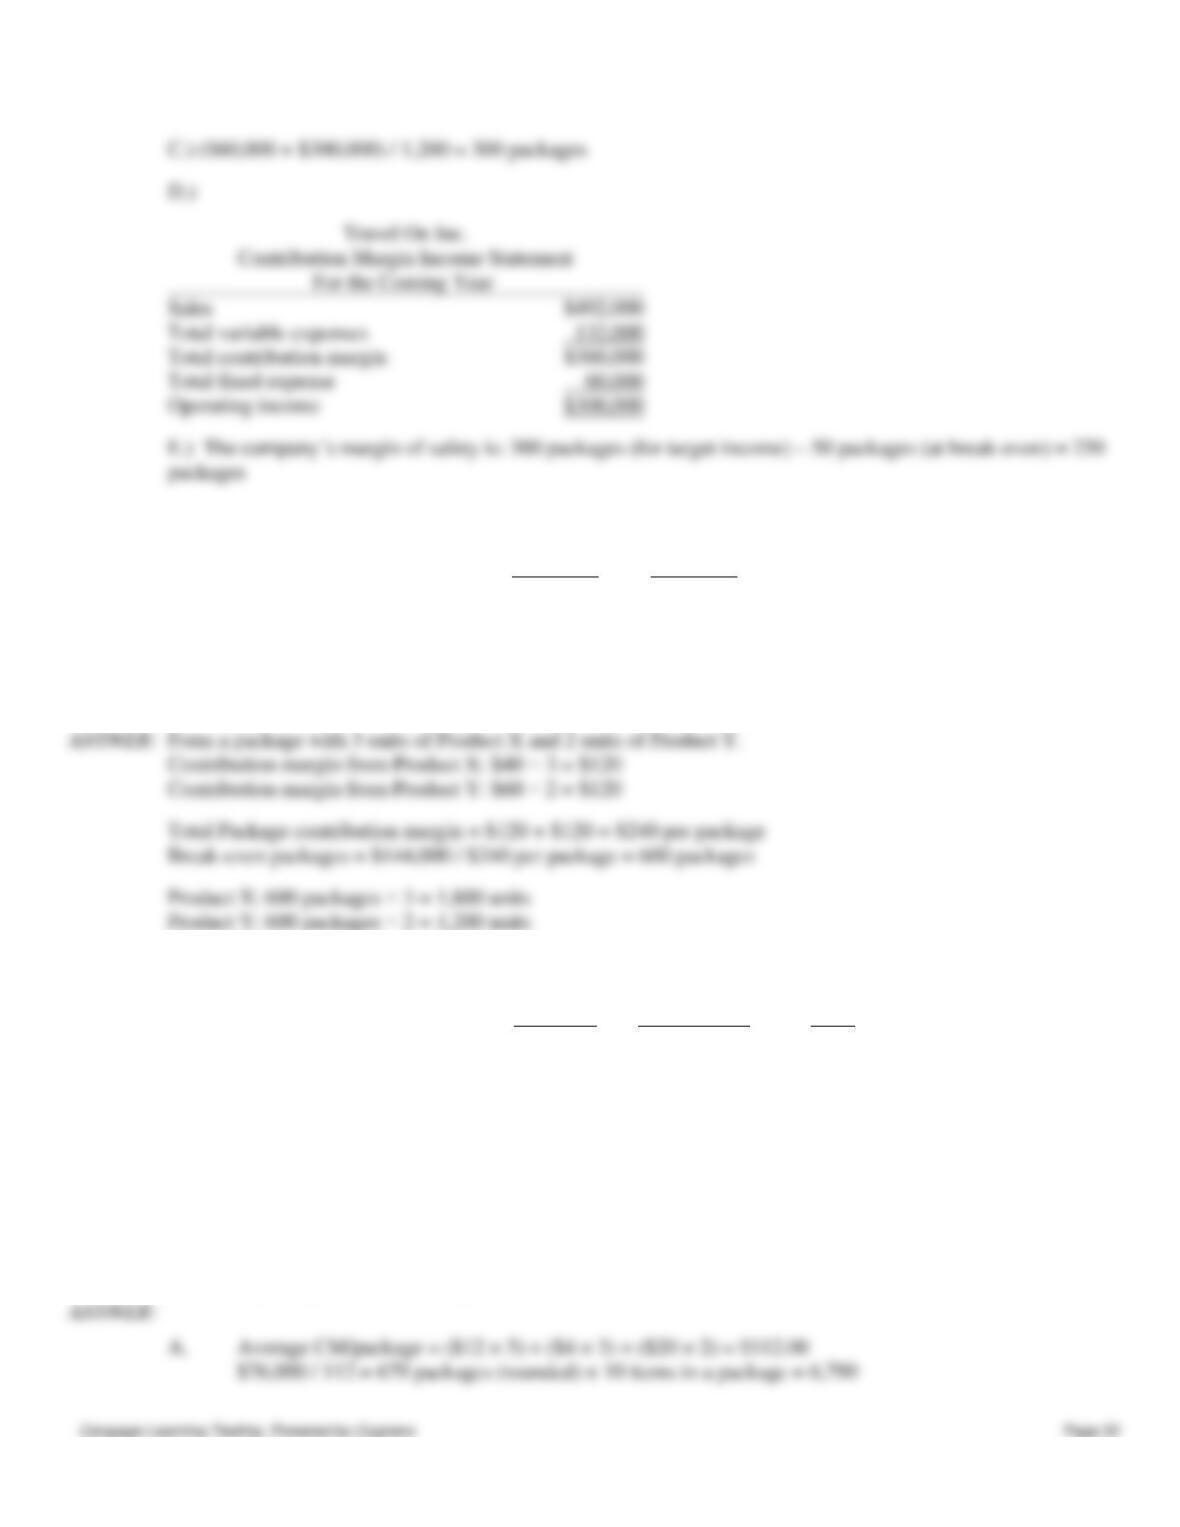
C.
($189,000 + $135,000) / $135 = 2,400 packages
Product A sales = 2,400 × 3 × $80 = $576,000
Product B sales = 2,400 × 2 × $30 = $144,000
Total sales = $576,000 + $144,000 = $720,000
$324,000 / 45% (CM% for package) = $720,000
154. Travel On Inc. sells luggage. They sell a duffle bag, a carry–on suitcase and a deluxe suitcase. The price and variable
cost for each type of luggage is listed below.
Price
Variable Cost
Duffle bag
$100
$ 25
Carry-on
180
40
Deluxe
300
120
The total fixed costs for Travel On Inc. equals $60,000. For every 8 duffle bags Travel On Inc sells it sells 3 carry-on
suitcases and 1 deluxe suitcase.
Required:
A.) Calculate the package contribution margin.
B.) Calculate the break-even point in units for duffle bags, carry-on suitcases and deluxe suitcases.
C.) If Travel On Inc. has a target income for the coming year of $300,000, how many packages will company have to sell?
D.) Based on your answer in Part C, prepare a contribution margin income statement for the coming year.
E.) What is the company’s margin of safety in packages?
Variable Cost
Package contribution
Duffle bag
Carry-on
Deluxe
Chapter 4 – Cost-Volume-Profit Analysis: A Managerial Tool
155. The Lauren Company manufactures two products. Information about the two product lines for the year is as follows:
Product X
Product Y
Selling price per unit
$70
$100
Variable costs per unit
30
40
Contribution margin per unit
40
60
The company expects fixed costs to be $144,000. The firm expects 60% of its sales (in units) to be Product X.
Required: Determine the break-even point in units for both Product X and Product Y.
156. The Young Manufacturing Company produces the following three products:
Hammers
Screwdrivers
Saws
Selling price per unit
$40
$16
$50
Variable costs per unit
28
12
30
Contribution per unit
12
4
20
Fixed costs are $76,000 per year.
50% of all sales in units are hammers, 30% are screwdrivers, and 20% are saws.
Required: Calculate the following values:
A.
Break-even point in total packages.
B.
Packages of hammers that will be sold at break-even.
C.
Total sales in packages to obtain a target income of $19,000.
A.
Average CM/package = ($12 × 5) + ($4 × 3) + ($20 × 2) = $112.00
$76,000 / 112 = 679 packages (rounded) × 10 items in a package = 6,790
Total variable expenses
132,000
Total contribution margin
Total fixed expense
60,000
Operating income
Chapter 4 – Cost-Volume-Profit Analysis: A Managerial Tool
157. Income statements for two different companies in the same industry are as follows:
Company A
Company B
Sales
$400,000
$400,000
Less: Variable costs
300,000
200,000
Contribution margin
$100,000
$200,000
Less: Fixed costs
50,000
150,000
Operating income
$ 50,000
$ 50,000
Required:
A.
Calculate the degree of operating leverage for each firm.
B.
Calculate the margin of safety in dollars for each firm.
C.
Determine the operating income for each firm if sales increase by 20%.
A.
Company A: $100,000 / $50,000 = 2
Company B: $200,000 / $50,000 = 4
B.
Company A:
Break-even sales = $50,000 / ($100,000 / $400,000) = $200,000
Margin of safety = $400,000 − $200,000 = $200,000
Company B:
Break-even sales = $150,000 / ($200,000 / $400,000) = $300,000
Margin of safety = $400,000 − $300,000 = $100,000
C.
Company A:
Increase in net income = (.20 × 2) × $50,000 = $20,000
Net income = $50,000 + $20,000 = $70,000
Company B:
Increase in net income = (.20 × 4) × $50,000 = $40,000
Net income = $50,000 + $40,000 = $90,000
158. Newman Company expects to produce and sell 2,000 units next month. Data on costs follows:
Per unit information:
Selling price
$40
Variable manufacturing costs
10
Variable selling costs
6
Fixed costs:
Fixed manufacturing costs
$16,000
Fixed selling costs
8,000
Required:
A.
What is the break-even point in units?
B.
What is the break-even point in sales dollars?
C.
What is the expected operating income for next month?
D.
What is the margin of safety in dollars?
B.
C.
($76,000 + $19,000) / $112 = 848 packages or 8,480 total items
Chapter 4 – Cost-Volume-Profit Analysis: A Managerial Tool
A.
Break-even units = ($16,000 + $8,000) / $24 = 1,000 units
B.
Break-even sales dollars = 1,000 × $40 = $40,000
OR
Break-even sales dollars = $24,000 / 0.6 = $40,000
C.
Expected operating income = $80,000 − $32,000 − $24,000 = $24,000
D.
Margin of safety = $80,000 − $40,000 = $40,000
159. McCallen Company expects to produce and sell 500 units next month. Data on costs follows:
Per unit information:
Selling price
$8.00
Variable manufacturing costs
2.75
Variable selling costs
0.25
Fixed costs:
Fixed manufacturing costs
$1,000
Fixed selling costs
125
Required:
A.
What is the break-even point in units?
B.
What is the break-even point in sales dollars?
C.
What is the expected operating income for next month?
D.
What is the margin of safety in dollars?
E.
What is the break-even point in units if fixed manufacturing costs increase by $500?
F.
What is the break-even point in units if variable manufacturing costs decrease by $0.75?
A.
Break-even units = $1,125 / $5 = 225 units
B.
Break-even sales dollars = $8 × 225 = $1,800
OR
Break-even sales dollars = $1,125 / 0.625 = $1,800
C.
Expected operating income = $4,000 − $1,500 − $1,125 = $1,375
D.
Margin of safety in dollars = $4,000 − $1,800 = $2,200
E.
($1,000 + $500 + $125) / $5 = 325 units
($1,000 + $125) / ($8 − $2 − $0.25) = $1,125 / $5.75 = 196 units (rounded)
160. At a monthly sales volume of $25,000, a company incurs variable costs of $19,000 and fixed costs of $6,000.
Required: Determine each of the following values:
A.
Variable cost ratio
B.
Contribution margin ratio
C.
Monthly break-even dollar sales volume
D.
Monthly margin of safety in dollars
Chapter 4 – Cost-Volume-Profit Analysis: A Managerial Tool
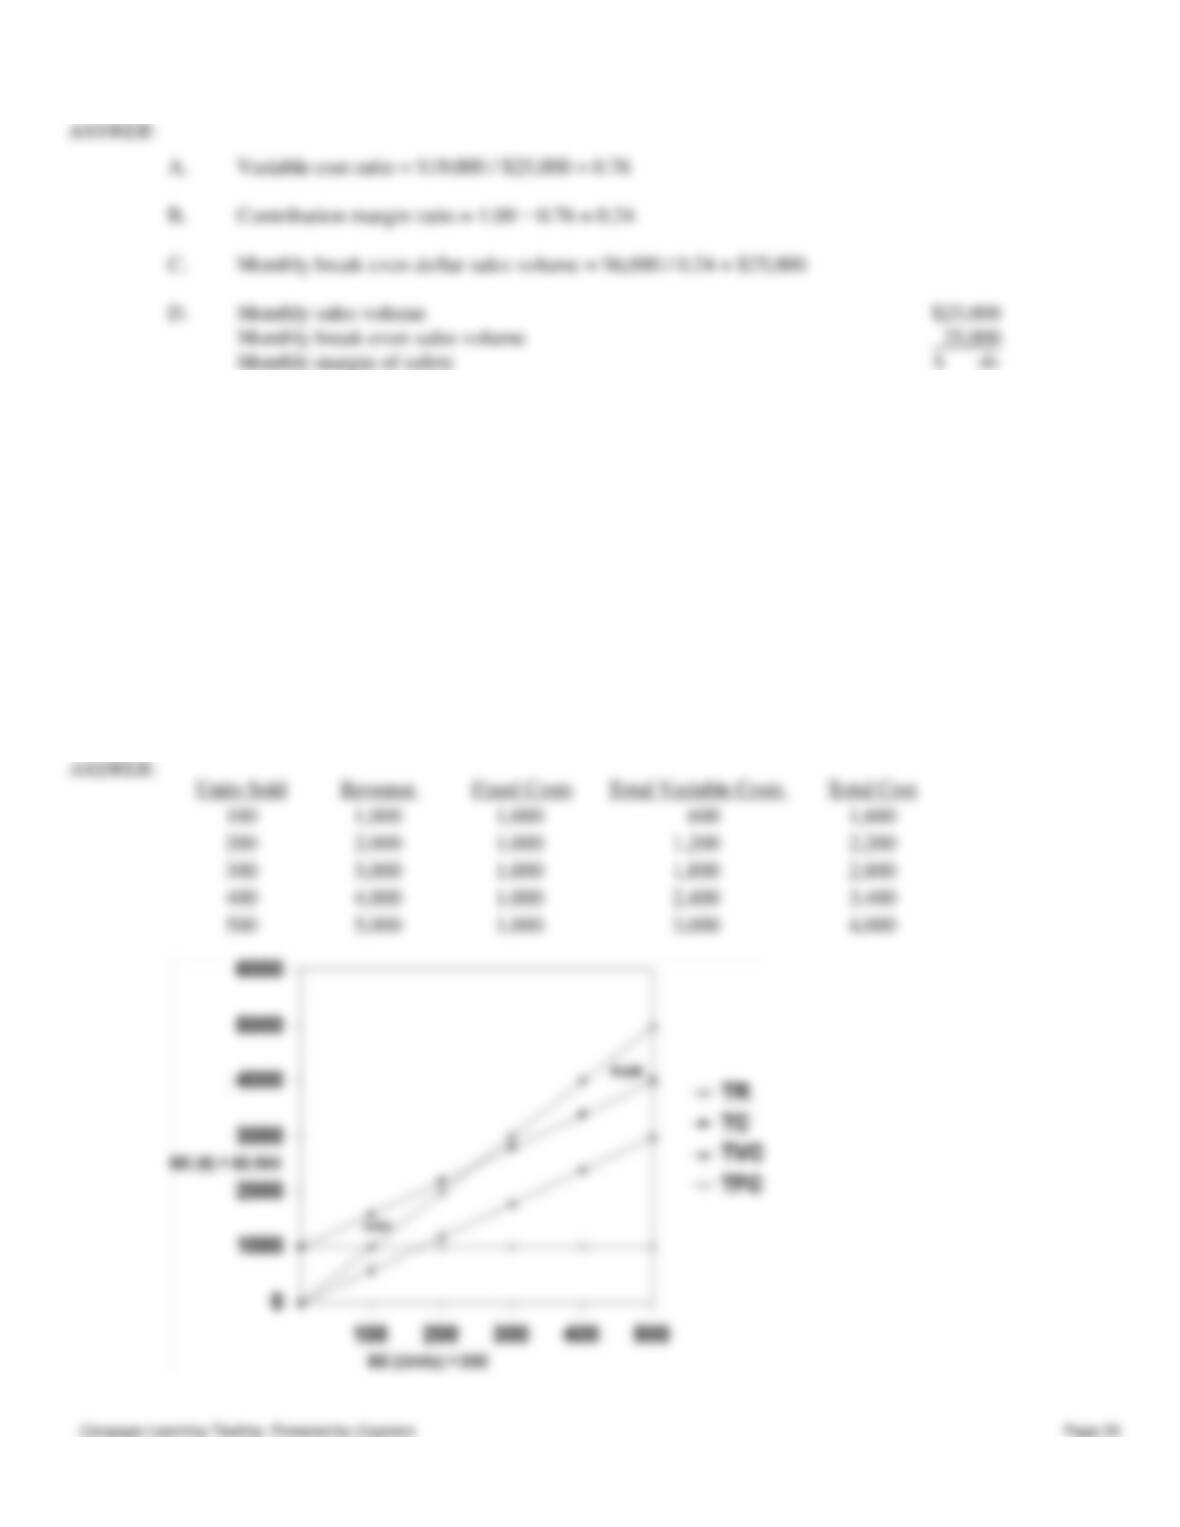
A.
Variable cost ratio = $19,000 / $25,000 = 0.76
B.
Contribution margin ratio = 1.00 − 0.76 = 0.24
C.
Monthly break-even dollar sales volume = $6,000 / 0.24 = $25,000
D.
Monthly sales volume
Monthly break-even sales volume
Monthly margin of safety
161. Arnold Corporation has the following information for the current year:
Selling price per unit
$ 10
Variable costs per unit
6
Fixed costs
1,000
Required: Prepare a cost-volume-profit graph identifying the following items:
A.
Total costs line
B.
Total fixed costs line
C.
Total variable costs line
D.
Total revenues line
E.
Break-even point in sales dollars, indicate the amount
F.
Break-even point in units, indicate the amount
G.
Profit area
H.
Loss area
Chapter 4 – Cost-Volume-Profit Analysis: A Managerial Tool
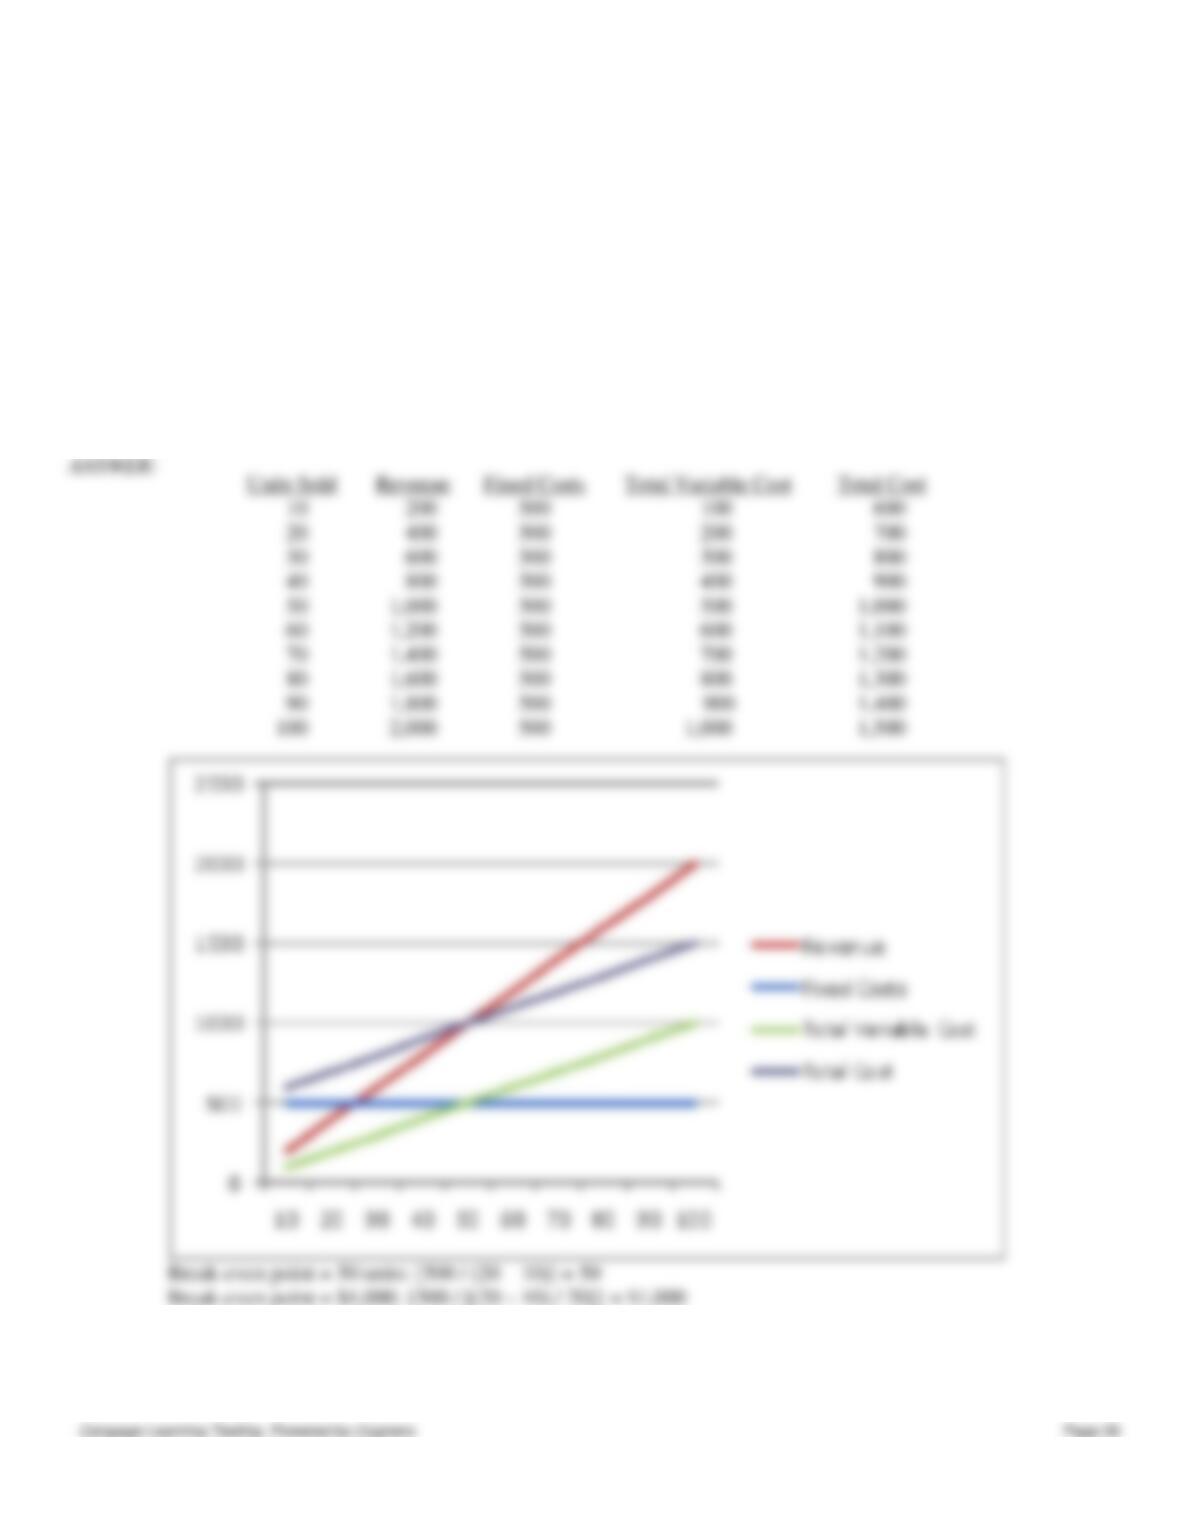
162. The following information has been provided for Walsh Corporation:
Sales price per unit
$ 20
Variable costs per unit
10
Fixed costs
500
Required: Prepare a cost-volume-profit graph identifying the following items:
A.) Total cost line
B.) Total fixed cost line
C.) Total variable cost line
D.) Total revenue line
E.) Loss area
F.) Profit area
G.) Compute the break-even point in units
H.) Compute the break-even point in sales dollars
163. Place Corporation had the following income statement for the current year:
Sales
$25,000
Chapter 4 – Cost-Volume-Profit Analysis: A Managerial Tool
Variable expenses
15,000
Contribution margin
$10,000
Fixed expenses
4,000
Operating income
$ 6,000
Required:
A.
Calculate the operating leverage ratio.
B.
If sales increase by 20%, what will be the percentage change in income?
C.
If sales increase by $15,000, how much will income increase?
A.
$10,000 / $6,000 = 1.6667
B.
1.6667 × 0.2 = 0.33333, or 33.33% increase
C.
$15,000 × 0.4 = $6,000
OR 60% × 1.6667 = 1.0000 and 1.0000 × $6,000 = $6,000
164. Explain why cost-volume-profit analysis can be useful to managers.
165. What are the assumptions underlying cost-volume-profit analysis?
identified and remain constant over the relevant range.
The analysis assumes that what is produced is actually sold.
For multiple-product analysis, the sales mix is assumed to be known and consistent.
The selling prices and costs are assumed to be known with certainty.
166. How can a multi-product firm determine its break-even point?
You Decide
167. As a cost accountant at A&E Company you have been given a set of data and have been asked to perform a break-
even analysis as well as a sensitivity analysis. Why are these analyses important?
A break-even analysis is important to a company for several reasons. First it tells a company at what level they
Chapter 4 – Cost-Volume-Profit Analysis: A Managerial Tool
Given the following numbers from Webster Company, match the correct value with its appropriate term.
Webster Company sells a product for $20. Unit cost information is as follows:
Direct materials
$7
Direct labor
$3
Variable overhead
$4
Fixed overhead
$1
Webster normally produces 50,000 units and the fixed overhead rate is based on this amount. Fixed selling and
administrative expense is $87,000.
a.
$6
b.
30%
c.
$14
d.
70%
e.
$290,000
f.
14,500
168. Variable cost per unit
c
169. Contribution margin per unit
a
170. break-even point (in units)
171. Variable cost ratio
172. Contribution margin ratio
173. break-even point (in dollars)
e
Match each item with the correct statement below.
a.
horizontal-axis of CVP graph
b.
vertical-axis of CVP graph
c.
slope of revenue line
Chapter 4 – Cost-Volume-Profit Analysis: A Managerial Tool
d.
slope of cost line
e.
point where the total revenue line and the total cost line intersect
174. variable cost per unit
175. the selling price per unit
176. measured in dollars
177. measured in units sold
178. break-even point
Match each item with the correct statement below.
a.
break-even point
b.
Common fixed expenses
c.
Contribution margin
d.
Direct fixed expenses
e.
Margin of safety
f.
Operating leverage
g.
Degree of operating leverage
h.
Sales mix
179. Fixed costs that are directly traceable to a given segment and, consequently, disappear if the segment is eliminated.
180. The relative combination of products (or services) being sold by an organization.
181. Sales revenue minus total variable cost or price minus unit variable cost.
182. The use of fixed costs to extract higher percentage changes in profits as sales activity changes.
183. The point where total sales revenue equals total cost.
184. A measure of the sensitivity of profit changes to changes in sales volume.
185. Fixed expenses that cannot be directly traced to individual segments and that are unaffected by the elimination of any
one segment.
Chapter 4 – Cost-Volume-Profit Analysis: A Managerial Tool
186. The units sold or expected to be sold or sales revenue earned or expected to be earned above the break-even volume.