Chapter 4
D)
Ans: B Learning Objectives: Find minimum average cost. difficulty: easy
section: 4.5
52.
The average cost per item to produce q items is given by
2
( ) 0.2 + 2 6a q q q= − +
.
A. What is the total cost,
()Cq
, of producing q items?
B. What is the marginal cost, MC, of producing q items?
C. At what production level does marginal cost equal average cost?
B.
C. 5
Learning Objectives: Find minimum average cost. difficulty: medium
section: 4.5
53.
The cost function, in dollars, is
( ) 5000 60C q q=+
. The average cost of producing 130
units is
(130)
130
C
.
A)
True
B)
False
Ans: B Learning Objectives: Find minimum average cost. difficulty: medium
section: 4.5
54.
If the cost function is
( ) 9000 4.5C q q=+
. For the 120th unit, find the marginal cost and
average cost, identify the units.
Learning Objectives: Find minimum average cost. difficulty: medium
section: 4.5
Chapter 4
55.
Given the cost function
2
( ) 4000 20 0.005C q q q= + +
and the demand function
100 0.015pq=−
, find the value of q (to the nearest whole number) for which average
cost is a minimum.
Ans:
894
Learning Objectives: Find minimum average cost. difficulty: medium
section: 4.5
56.
The Revenue is given by
( ) 350R q q=
and the Cost is given by
2
( ) 2000 7C q q=+
.
What value of q will maximize profit? What is the profit at that value?
q=________________________, P(q)= ___________________________
Ans:
Learning Objectives: Find maximum profit. difficulty: medium section: 4.4
57.
The elasticity for a good is E=1.3. What is the effect on demand of a 7% price
increase?
A)
9.1% decrease
B)
9.1% increase
C)
5.4% decrease
D)
5.4% increase
Ans: A Learning Objectives: Calculate elasticity of demand and understand its
interpretation. difficulty: easy section: 4.6
58.
There is only one barber in a small town. Would you expect the elasticity of demand
for the first barber to increase or decrease if a second barber moved into town?
Ans:
increase
Learning Objectives: Calculate elasticity of demand and understand its interpretation.
difficulty: easy section: 4.6
59.
The demand curve for a product is
2
1500 4qp=−
.
A. Find the elasticity of demand (to three decimal places) at a price of p=5.
B. Is demand elastic or inelastic at this price?
Ans:
A. 0.143
B. inelastic
Learning Objectives: Calculate elasticity of demand and understand its interpretation.
difficulty: medium section: 4.6
Chapter 4
60.
An amusement park finds that when it charges $24 for an all-day pass, attendance is
about 3700 per day. When it charges $27 , attendance is about 3400 per day.
A. Estimate the elasticity for the amusement park to two decimal places.
B. Is demand elastic or inelastic?
Ans:
A. 0.65
B. elastic
Learning Objectives: Calculate elasticity of demand and understand its interpretation.
difficulty: medium section: 4.6
61.
An amusement park finds that when it charges $15 for an all-day pass, attendance is
about 2400 per day. When it charges $19 , attendance is about 2200 per day. Is daily
revenue higher at a price of $15 or a price of $19?
Ans:
19
Learning Objectives: Understand the relationship between elasticity and revenue.
difficulty: medium section: 4.6
62.
A youth group wishes to hold a car wash as a fundraiser. Through past experience with
car washes, they have constructed the following table, which shows the price, p, charged
for a car wash and the quantity, q, of cars washed at that price.
p
$2.00
$2.50
$3.00
$3.50
$4.00
q
230
210
190
160
120
A. At what price is revenue maximized?
B. What is the elasticity at that price?
Ans:
A. $3.00
B. 0.95
Learning Objectives: Understand the relationship between elasticity and revenue.
difficulty: easy section: 4.6
63.
The demand equation for a product is
bp
q ae−
=
, where q is the number of units
produced, p is the price of each unit, and a and b are positive constants. Find a
formula, in terms of p, for the elasticity of demand.
Learning Objectives: Calculate elasticity of demand and understand its interpretation.
difficulty: hard section: 4.6
Chapter 4
64.
The demand equation for a product is
bp
q ae−
=
, where q is the number of units
produced, p is the price of each unit, and a and b are positive constants. Find the
critical point(s) of the revenue function.
difficulty: medium section: 4.6
65.
The demand for doughnuts at a bakery is given by
100 375qp=−
, where q is the
number of doughnuts sold at a price of p dollars each.
A. Find the elasticity of demand to two decimal places if the price is $0.80.
B. Will revenue be increased by raising or lowering the price?
B. lowering
difficulty: medium section: 4.6
66.
Raising the average price of an entree at a restaurant from $13 to $15 reduces the
number of customers per day from 225 to 175.
A. What is the elasticity of demand to two decimal places for entrees at a price of $13?
B. Would raising the price from $13 to $15 increase or decrease the profit?
B. decrease
difficulty: medium section: 4.6
67.
The demand curve for a product is given by
2
2700 5qp=−
.
A. Write revenue as a function of price and take its derivative to find the price (to the
nearest cent) that will maximize revenue.
B. Find the elasticity (to two decimal places) at the price you found in part A.
B. 1.00
difficulty: medium section: 4.6
Chapter 4
68.
A disease is released into a small town. The number of people infected is modeled by
the equation
0.16
200
() 1 199 t
It e−
=
+
. What is the population at t=0 of this disease?
Ans:
1
section: 4.7
69.
A disease is released into a town. The number of people, in thousands infected is
modeled by the equation
0.03
1000
() 1 982 t
It e−
=
+
. How many people are infected after
0
hours?
Ans:
1017 people
section: 4.7
70.
A disease is released into a town. The number of people infected each day is modeled
by the equation
0.04
1300
() 1 1297 t
n I t e−
==
+
. Estimate when
( ) 0.It
=
Estimate the value of
n at this time.
Ans:
179 days, 650 people
formula or graph or table. difficulty: medium section: 4.7
Chapter 4
71.
The rabbit population, P, in a wilderness area is approximated by the function
0.34
200
1 26 t
Pe−
=
+
,
where t is the number of weeks since the rabbits were introduced into the area.
A. How many rabbits were initially introduced into the area (to the nearest rabbit)?
B. How many rabbits were in the area after 5 weeks (to the nearest rabbit)?
C. What is the carrying capacity of rabbits in the area?
B. 35
C. 200
72.
A biologist found that the number of Drosophila fruit flies, N(t), assumes the following
growth pattern if the food source is limited:
0.4
500
() 1 38 t
Nt e−
=
+
.
A. How many fruit flies were there in the beginning (to the nearest fly)?
B. At what time was the population increasing most rapidly (to the nearest day)?
C. At what rate does the number of fruit flies increase after 5 days (to the nearest fly
per day)?
Chapter 4
73.
The following table gives the number of students who have joined a new school club t
days after it was formed.
A. Estimate the value of t where concavity changes in this function.
B. Use your answer from part (a) to estimate the maximum membership in the club.
t (days)
1
2
3
4
5
6
7
8
9
10
P
(number of students)
4
9
18
36
70
126
208
290
355
413
74.
The following table shows the total sales, in thousands, since a new DVD was released.
A. Estimate the point of diminishing returns.
B. Using your answer from part (A), predict the total possible sales for the DVD.
week
0
1
2
3
4
5
6
7
8
sales
0
9
24
60
141
294
509
691
807
Chapter 4
75.
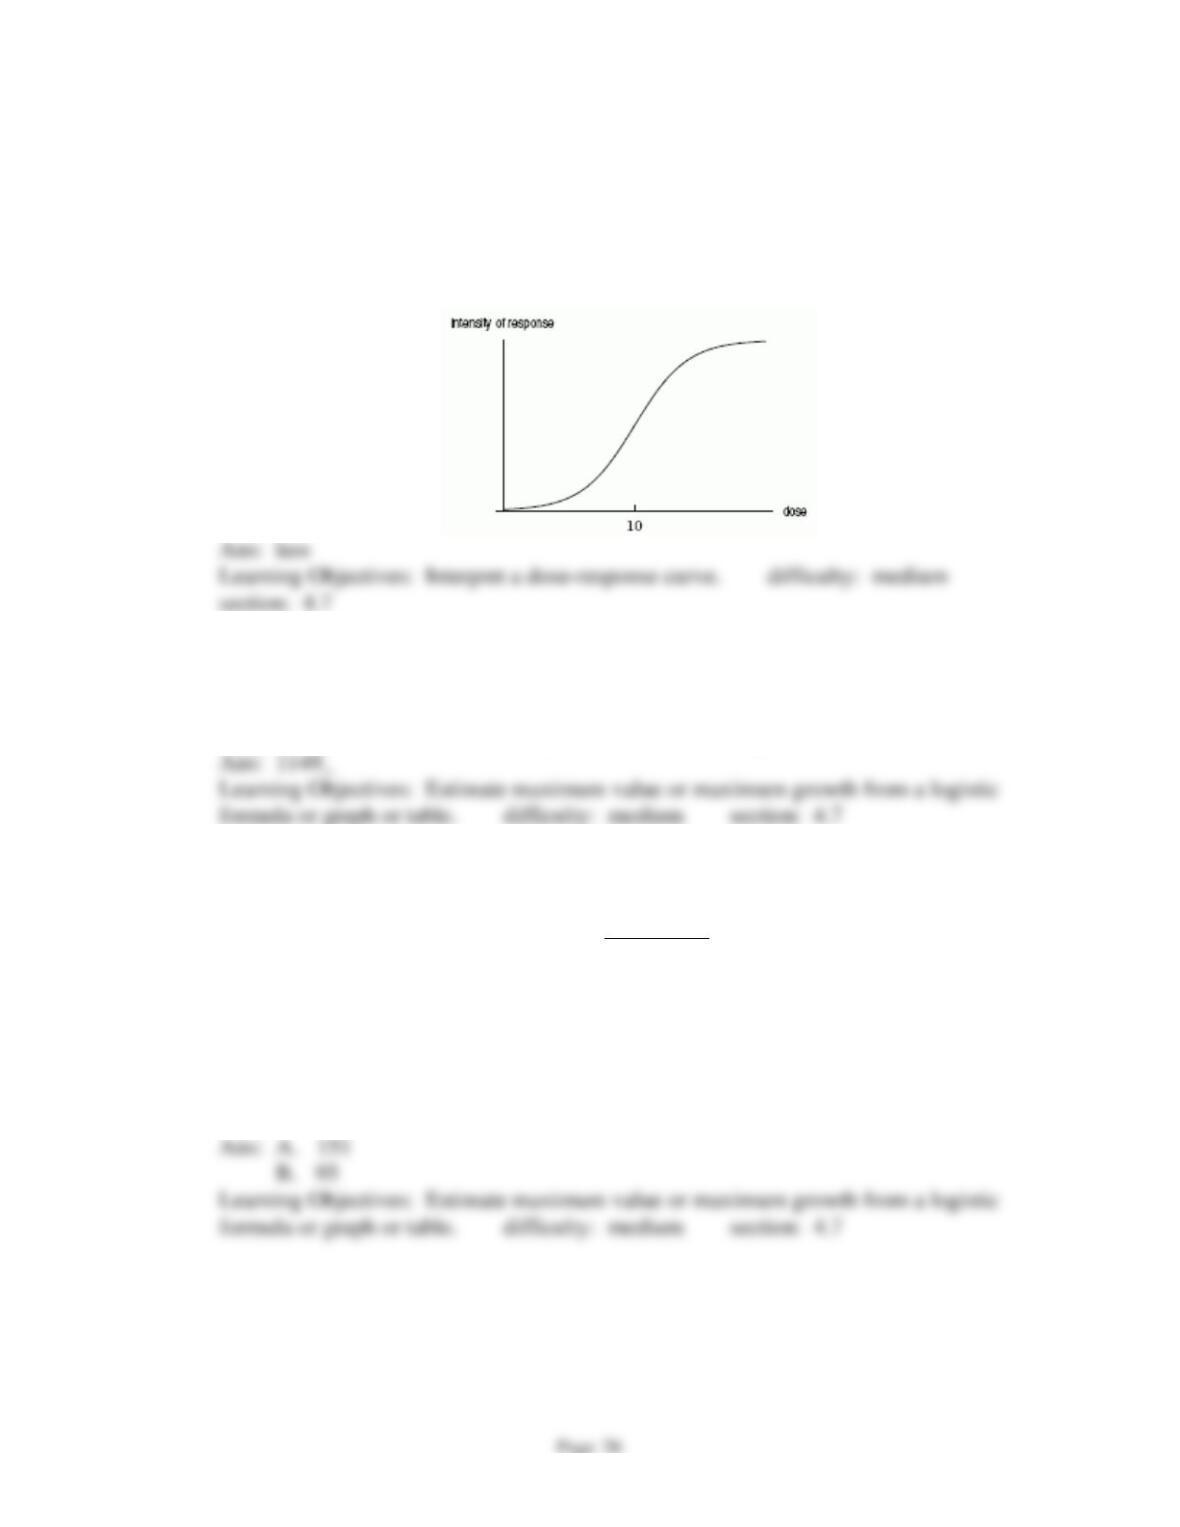
The dose response curve in the following figure is given by
()R f x=
, where R is
percent of maximum response and x is the dose of the drug in mg. The inflection point
is at (10,50) and
‘(10) 7f=
. Would
()fx
be greater or less than 7 for values of x less
than 10?
Ans:
Learning Objectives: Interpret a dose-response curve. difficulty: medium
76.
In Wilson corners, population 2000, a rumor spreads according to the logistic model. If
5 people know the rumor at 4 PM and 110 people have heard it by 5 PM, how many
people will have heard the rumor by 6 PM (to the nearest person)?
Ans:
1149_
77.
A flu epidemic spreads amongst a group of people according to the formula
0.8
700
() 1 199 t
Pt e−
=
+
,
where
()Pt
represents the number of people that are infected by the end of day t.
A. How many people are infected by the end of the fifth day (to the nearest person)?
B. At what rate do the people become infected on day 5 (to the nearest person per
day)?
Ans:
A. 151
B. 95
Learning Objectives: Estimate maximum value or maximum growth from a logistic
formula or graph or table. difficulty: medium section: 4.7
Chapter 4
78.
The drug concentration curve for a drug after t hours is given by
0.3
11.5 t
C te−
=
ng/ml.
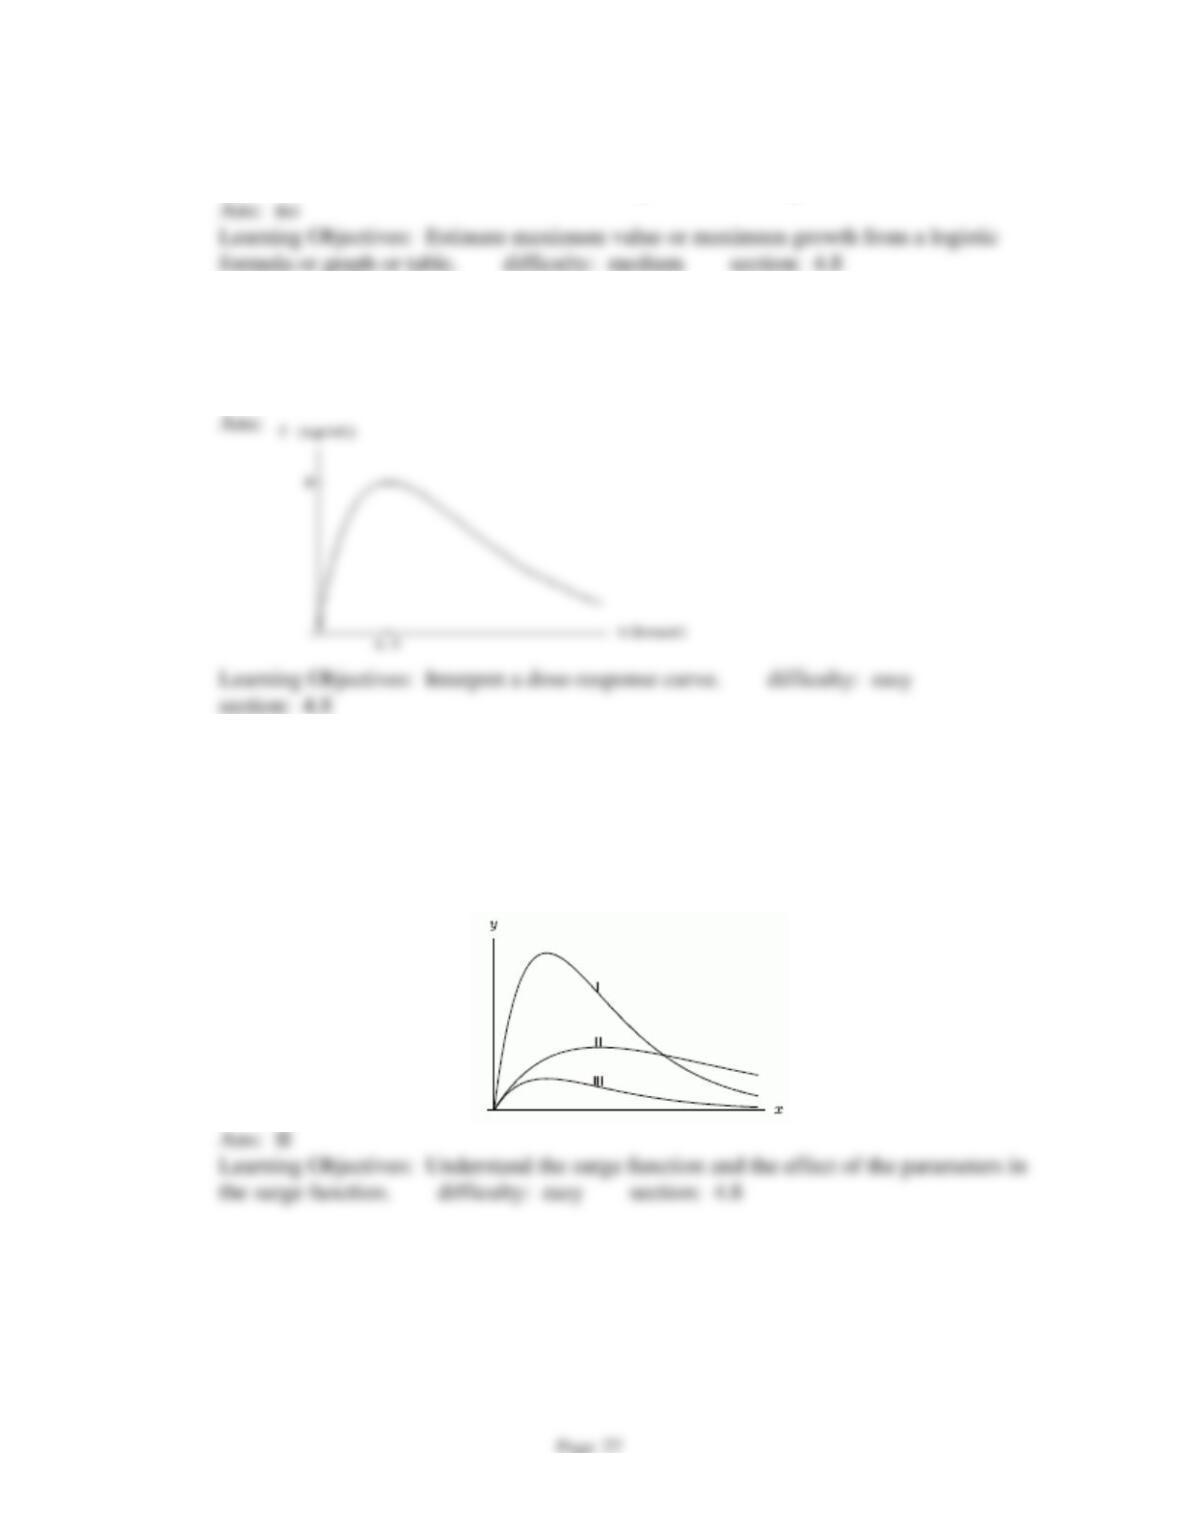
The minimum effective concentration is 10 ng/ml. Is the drug effective at t = 10 hours?
Learning Objectives: Estimate maximum value or maximum growth from a logistic
79.
The peak concentration of 9 ng/ml for a drug occurs 1.5 hours after a 7 mg dose is
administered. Sketch a graph that represents the concentration, C, as a function of time,
t.
Learning Objectives: Interpret a dose-response curve. difficulty: easy
80.
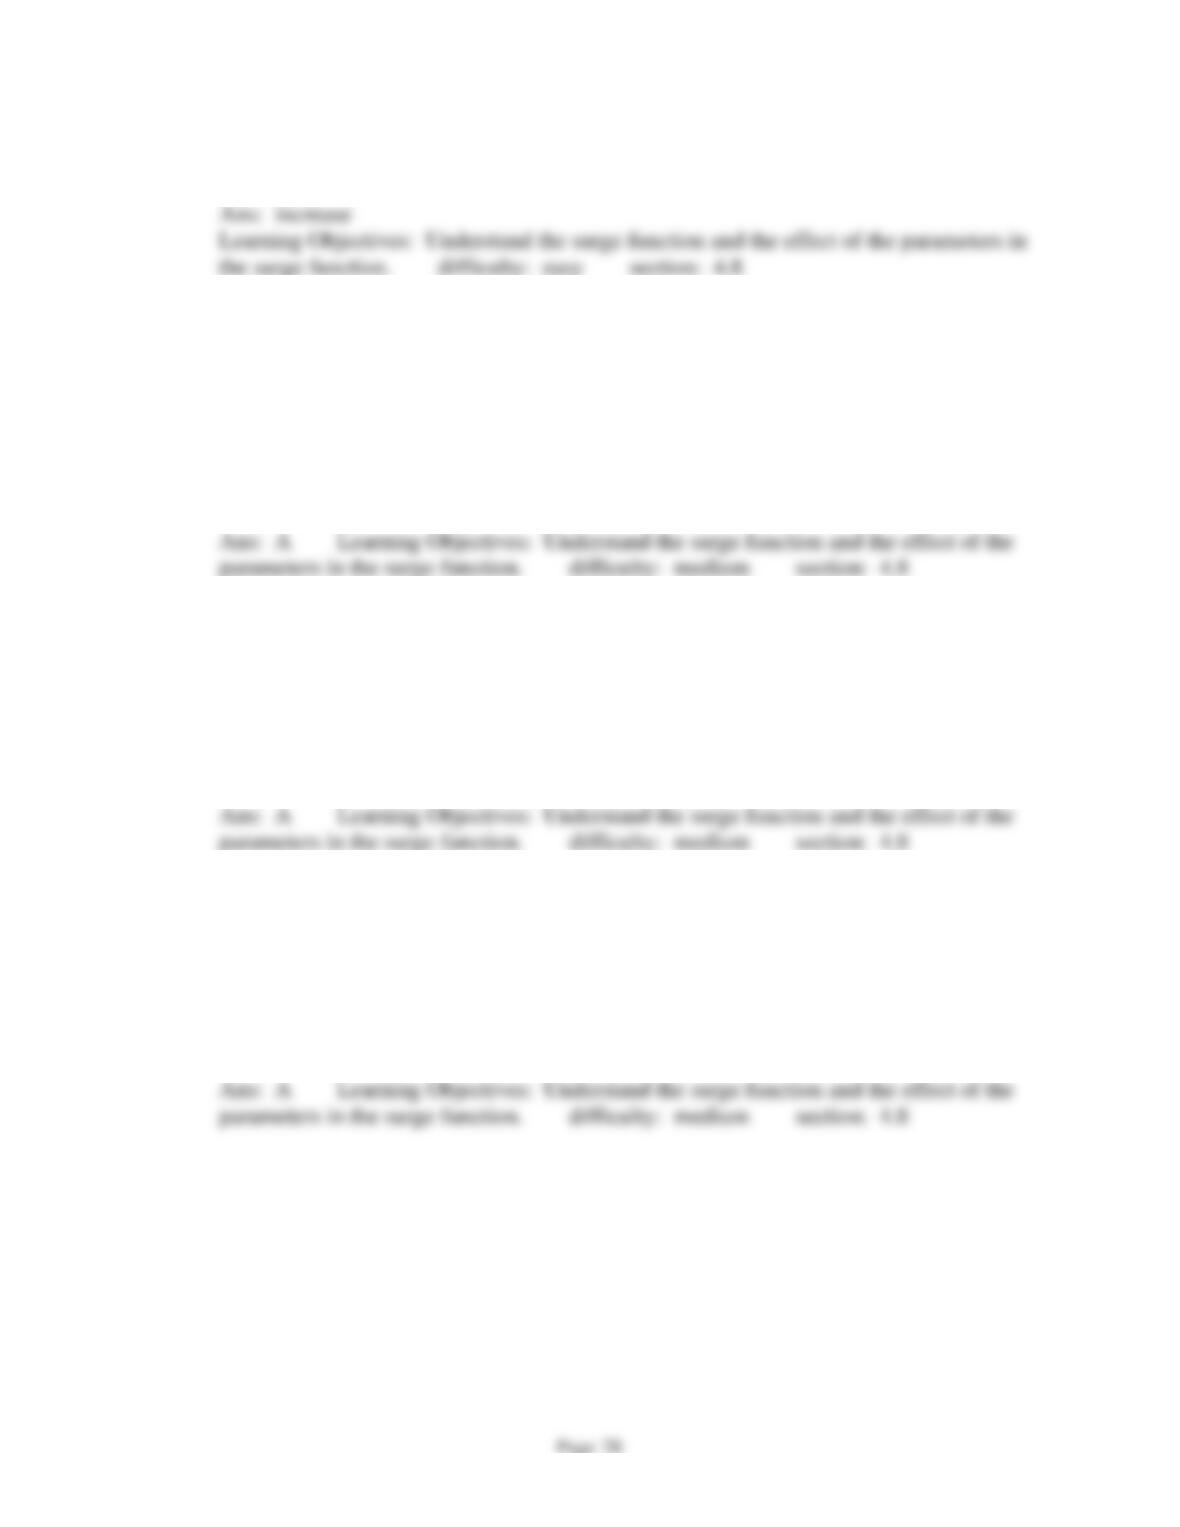
The following three equations are graphed in the figure. Which graph corresponds to
equation C?
A.
x
y xe−
=
B.
3x
y xe−
=
C.
0.7 x
y xe−
=
Learning Objectives: Understand the surge function and the effect of the parameters in
Chapter 4
81.
Does the maximum value of the surge function
bt
y ate−
=
increase or decrease when a
is increased and b is held constant?
Ans:
increase
Learning Objectives: Understand the surge function and the effect of the parameters in
the surge function. difficulty: easy section: 4.8
82.
If time, t, is in hours and concentration, C, is in ng/ml, the drug concentration curve for
a drug is given by
0.4
( ) 8.5 t
C t te−
=
. About how many hours does it take for the drug to
reach peak concentration? .
A)
2.5 hours
B)
8.5 hours
C)
0.4 hours
D)
3.4 hours
Ans: A Learning Objectives: Understand the surge function and the effect of the
parameters in the surge function. difficulty: medium section: 4.8
83.
If time, t, is in hours and concentration, C, is in ng/ml, the drug concentration curve for
a drug is given by
0.4
( ) 6.5 t
C t te−
=
. What is the peak concentration of the drug?
A)
6.0 mg
B)
6.5 mg
C)
2.6 mg
D)
16.3 mg
Ans: A Learning Objectives: Understand the surge function and the effect of the
parameters in the surge function. difficulty: medium section: 4.8
84.
If time, t, is in hours and concentration, C, is in ng/ml, the drug concentration curve for
a drug is given by
0.5
( ) 9 t
C t te−
=
. Suppose scientists wish to alter the drug so that it is
effective for more hours. Would the coefficient of 9 in its concentration curve equation
increase or decrease?
A)
increase
B)
decrease
Ans: A Learning Objectives: Understand the surge function and the effect of the
parameters in the surge function. difficulty: medium section: 4.8
Chapter 4
85.
The following table gives the concentration C, of a drug in ng/ml, at time t, in hours,
after it is administered to 2 different people.
A. If the concentration for Person A is given by
A
bt
C ate=
and the concentration for
Person B is given by
B
bt
C ate=
, would you expect bA to be larger or smaller than bB?
B. If the minimum effective concentration is 5 ng/ml, until what time is the drug
effective for person A?
C. If the minimum effective concentration is 5 ng/ml, until what time is the drug
effective for person B?
t (hours)
1
2
3
4
5
Person A
15
10
5
4
3
Person B
20
22
8
5
4
C. 4
the surge function. difficulty: medium section: 4.8
86.
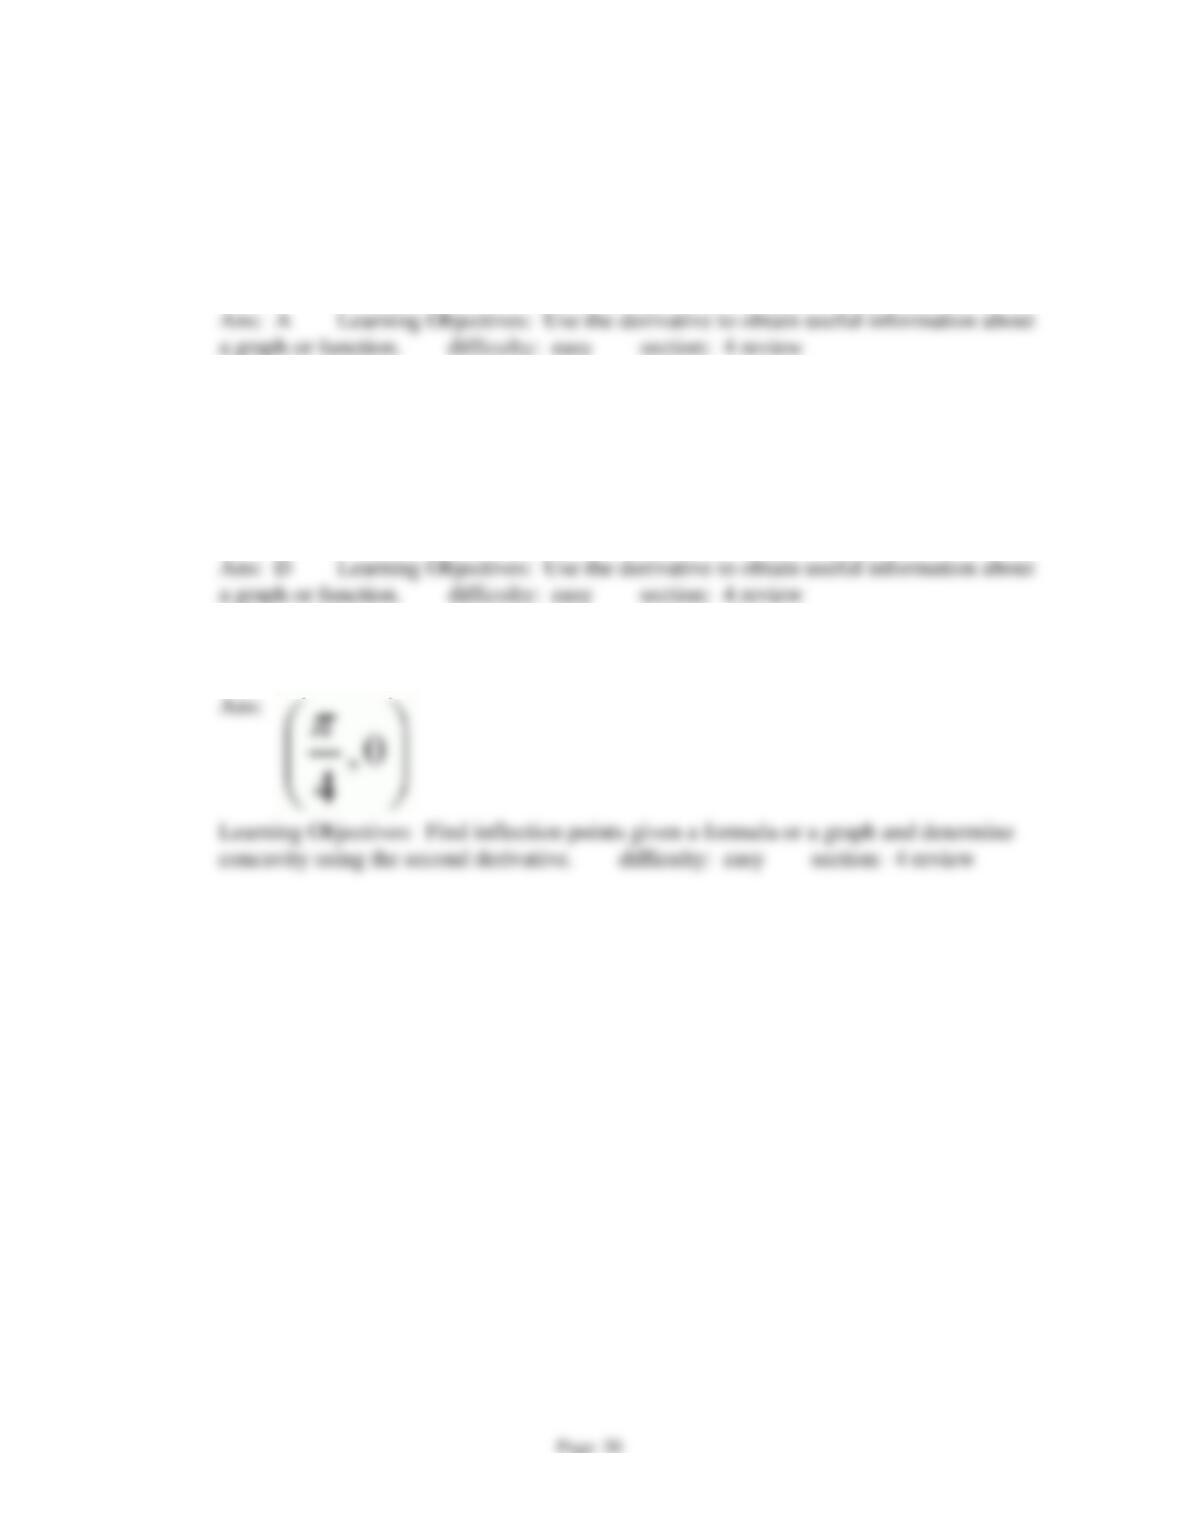
On the following graph, the point (4,3.5) is a
A)
inflection point
B)
local minimum
C)
local maximum
D)
local and global maximum
E)
local and global minimum
Chapter 4
87.
Given
() x
f x e x
−
=+
. Which of the following are critical points of f?
A)
(0,1)
B)
(1,1.37)
C)
(-1,1.72)
D)
none
a graph or function. difficulty: easy section: 4 review
88.
Given
() x
f x e x
−
=+
. Which of the following are inflection points of f?
A)
(-1,1.72)
B)
(0,1)
C)
(1,1.37)
D)
none
a graph or function. difficulty: easy section: 4 review
89.
For
( ) cos(2 )f x x=
, determine the horizontal intercept.
concavity using the second derivative. difficulty: easy section: 4 review
Chapter 4
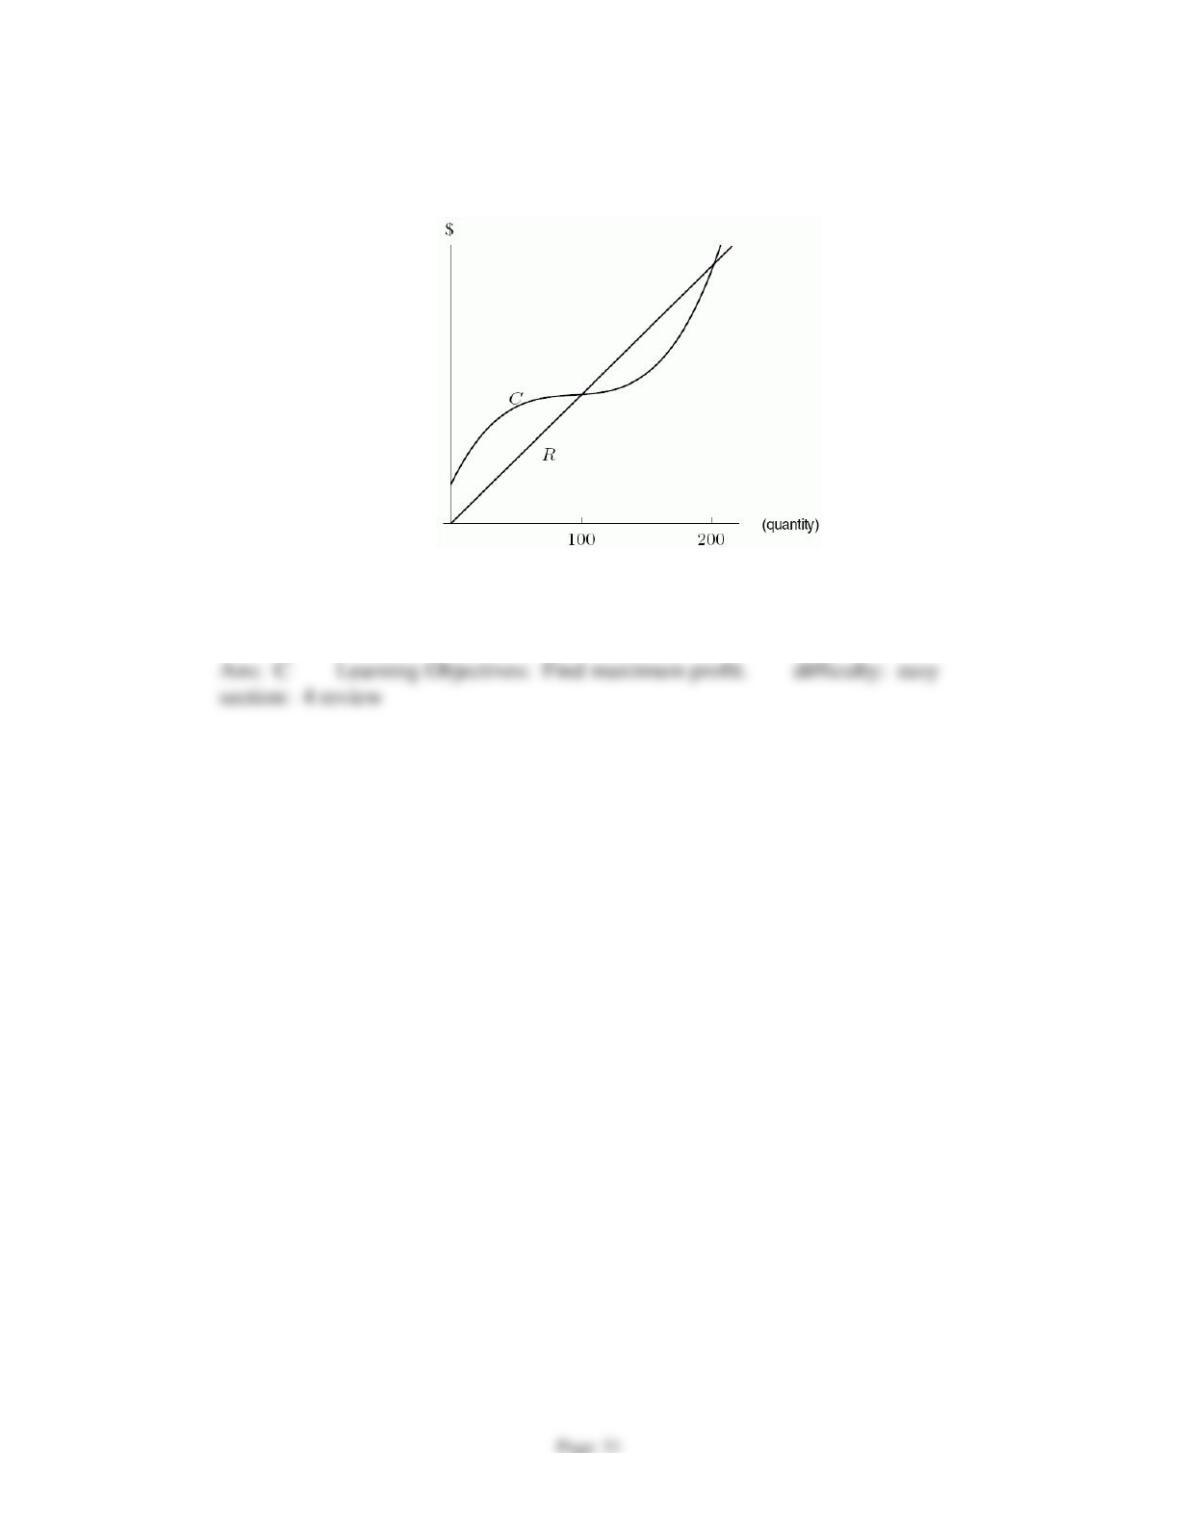
90.
The total revenue and cost curves for a product are shown in the following figure.
Estimate the production level P that maximizes profit.
A)
50
B)
100
C)
150
D)
200
section: 4 review
Chapter 4
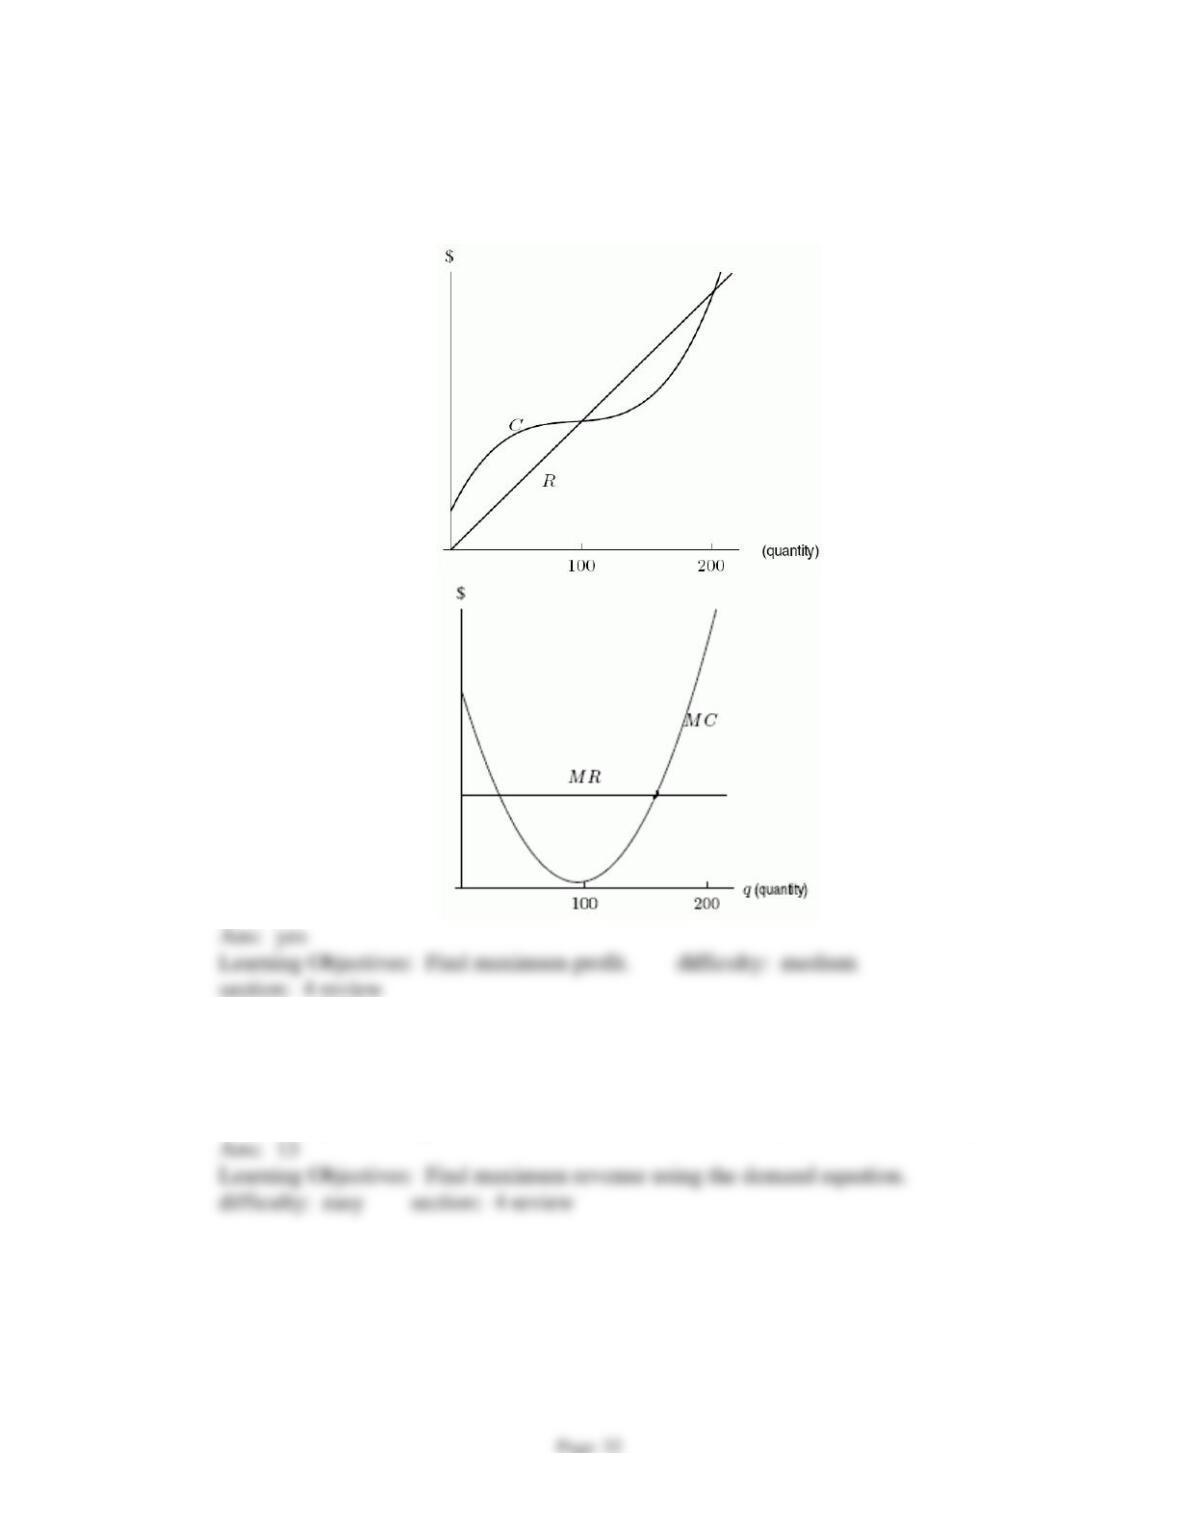
91.
The total revenue and cost curves for a product are shown in the first figure. Does the
second figure accurately show the corresponding marginal cost and marginal revenue
functions?
92.
A water park finds that at an admission price of $20, attendance is 300 per day. For
every $1 decrease in price, 50 more people visit the park per day. How many dollars
should the park chanrge for admission to maximize revenue (to the nearest dollar)?
Chapter 4
93.
The average cost per item to produce q items is given by
2
( ) 0.1 0.4 12a q q q= − +
for
q>0. What is the total cost, C, of producing q goods?
A)
32
0.1 0.4 12q q q−+
B)
12
0.1 0.4qq
−+
C)
0.2 0.4q−
D)
2
0.3 0.8 12qq−+
94.
The average cost per item to produce q items is given by
2
( ) 0.3 0.7 11a q q q= − +
for
q>0. What is the marginal cost, MC, of producing q goods?
A)
32
0.3 0.7 11q q q−+
B)
11
0.3 0.7qq
−+
C)
0.6 0.7q−
D)
2
0.9 1.4 11qq−+
95.
The average cost per item to produce q items is given by
2
( ) 0.3 0.5 17a q q q= − +
for
q>0. At what point q (to two decimal places) does marginal cost equal average cost?
Chapter 4
96.
Rank the following products from 1 to 4 according to their elasticity, with 1 being the
highest.
A. high performance automobile
B. cellular phone
C. laundry detergent
D. movie theater tickets
Learning Objectives: Calculate elasticity of demand and understand its interpretation.
difficulty: easy section: 4 review
97.
The concentration of alcohol in the blood (as a function of time since drinking a glass of
wine) is most likely to be modeled by which of the following types of functions?
A)
surge
B)
exponential
C)
periodic
D)
logistic
E)
linear
Ans: A Learning Objectives: Understand the surge function and the effect of the
parameters in the surge function. difficulty: easy section: 4 review
Chapter 4
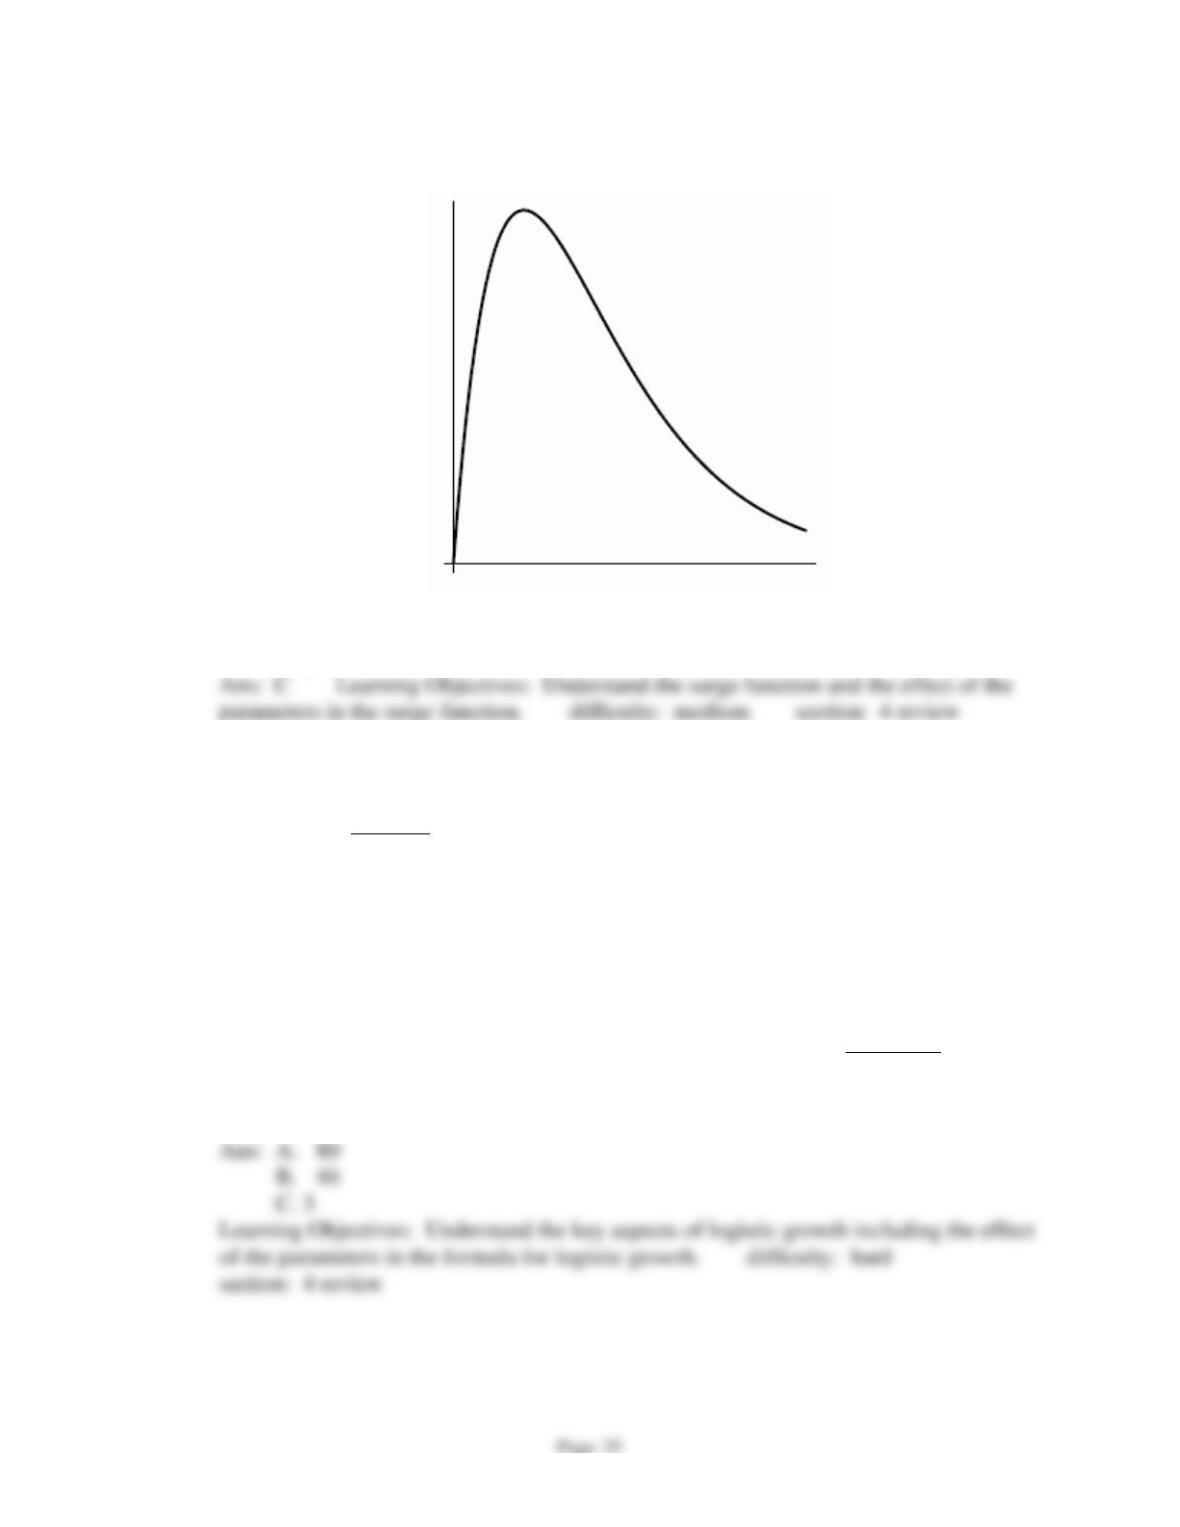
98.
Classify the following graph as a probable logistic, polynomial, or surge function
A)
logistic
B)
polynomial
C)
surge
parameters in the surge function. difficulty: medium section: 4 review
99.
Suppose the spread of a cold virus in an elementary school can by modeled by the
equation
80
1 45 t
Pe−
=
+
,where P is the number of children with the virus and t is time in
days.
A. How many children will eventually catch the virus?
B. At the inflection point of the graph of P, how many children have caught the virus?
C. If a different strain of the virus is found to fit the equation
1.5
80
1 45 t
Pe−
=
+
, will it
eventually infect (1) more children, (2) fewer children, or (3) the same number of
children?
C. 3
section: 4 review