
CHAPTER 4: ACTIVITY-BASED COSTING
1. Unit based costing first assigns overhead costs to departmental pools and then assigns these costs to products using
predetermined overhead rates.
a. True
b. False
2. Management information systems can be divided into a unit-based type and activity–based type.
a. True
b. False
3. Predetermined overhead rates are calculated at the end of each year using the formula: overhead rate = budgeted
annual driver level/budgeted annual driver level.
a. True
b. False
4. Unit-level drivers are factors that measure the demands placed on unit-level activities by products.
a. True
b. False
5. If applied overhead is greater than actual overhead it is called overapplied overhead.
a. True
b. False
6. Unit-based product costing assigns manufacturing and selling costs to products.
a. True
b. False
7. The difference between actual overhead and applied overhead is an underapplied overhead.
a. True
b. False

Chapter 4: Activity-Based Costing
8. Overhead assignments should reflect the amount of overhead demanded by each product.
a. True
b. False
9. The justification for not using a departmental rate for overhead cost assignment is that it increases accuracy.
a. True
b. False
10. Non-unit-based drivers are factors that measure the demands that cost objects place on activities.
a. True
b. False
11. If overhead is a significant proportion of the unit manufacturing costs, the distortion caused by using multi-level
drivers can be serious.
a. True
b. False
12. Activity–based costing uses only unit–level drivers for costing.
a. True
b. False
13. The activity-based cost assignment is the most accurate method of costing because it follows a cause-and-effect
pattern of overhead consumption.
a. True
b. False
14. An activity-based costing system traces costs to activities and then to products and other cost objects.
a. True
b. False
15. The first step in designing an activity–based costing system is to identify activities.
a. True
b. False

Chapter 4: Activity-Based Costing
16. A list of the activities identified in the design of an activity-based system is called an activity inventory.
a. True
b. False
17. Activity attributes are nonfinancial and financial information items that describe individual activities.
a. True
b. False
18. Product classification attributes define and describe activities and are the basis for product classification.
a. True
b. False
19. After identifying and describing activities, the next step is to determine the cost of the performance of each activity.
a. True
b. False
20. Classifying activities into four general categories facilitates product costing by associating the response to different
types of activity drivers.
a. True
b. False
21. Efforts to simplify activity-based costing systems (ABC) involve either before-the–fact simplification or after–the-
fact simplification.
a. True
b. False
22. Time driven activity-based costing (TDABC) requires the need to identify resource drivers to assign costs to
activities.
a. True
b. False

Chapter 4: Activity-Based Costing
23. Using the before–the-fact simplification method TDABC eliminates the need for detailed interviewing and surveying
to determine resource drivers.
a. True
b. False
24. After-the–fact simplification includes two approaches: the approximately relevant reduced ABC system and the
equally accurate enhanced ABC system.
a. True
b. False
25. There are many two-driver combinations that may be used to reduce the ABC system without sacrificing
accuracy.
a. True
b. False
26. A(n) method first traces costs to a department and then to products.
27. Offering greater product accuracy than an activity-based costing system is not a characteristic of a costing
system.
28. The formula Budgeted annual overhead/Budgeted annual driver level is used to calculate a __________ rate.
29. For labor-intensive operations, the most appropriate activity driver would be the hours.
30. The proportion of an overhead activity consumed by a product is the ratio.
31. drivers create distortions when different products utilize resources differently.
32. The use of activity drivers to assign costs tends to high-volume products.

Chapter 4: Activity-Based Costing
33. A(n) costing system first traces costs to activities and then to products.
34. Activity are nonfinancial and financial data that describe individual activities.
35. The activity is a simple list of activities identified in an ABC system.
36. Activity helps management achieve objectives such as product or customer costing and continuous
improvement.
37. Materials handling would be classified as a activity when using activity–level costing.
38. An costing database is the collected data sets that are organized and interrelated for use in a
company’s ABC information system.
39. A(n) is a grouping of logically related information.
40. In the ABC systems, managers directly estimate the resource demands imposed by each product.
41. Unit-level product costing assigns
a. direct materials and direct labor directly to products and assigns overhead to departmental pools which are
assigned to products using predetermined overhead rates based on unit-level drivers.
b. direct materials, direct labor and overhead to departmental cost pools which are assigned to products using
predetermined overhead rates based on unit-level drivers.
c. direct materials and direct labor directly to products and assigns overhead to departmental pools which are
assigned to products using predetermined overhead rates based on non-unit level drivers.
d. direct materials, direct labor and overhead to departmental cost pools which are assigned to products using
predetermined overhead rates based on non-unit level drivers.

Chapter 4: Activity-Based Costing
42. Which is NOT a characteristic of a unit-based costing system?
a. It uses traditional product costing definitions.
b. It uses unit-based activity drivers to assign overhead to products.
c. It offers greater product costing accuracy than an activity-based costing system.
d. It is cheaper than an activity-based costing system.
43. Unit-based product costing uses which of the following procedures?
a. All overhead costs are expensed as incurred.
b. Overhead costs are traced to departments, then costs are traced to products.
c. Overhead costs are traced directly to products.
d. Overhead costs are traced to activities, then costs are traced to products.
44. The method that first traces costs to a department and then to products is called:
a. direct costing
b. absorption costing
c. unit–based costing
d. indirect costing
45. A predetermined overhead rate is calculated using which of the following formulas?
a. Actual annual overhead / budgeted annual driver level
b. Budgeted annual overhead / budgeted annual driver level
c. Budgeted annual overhead / actual annual driver level
d. Actual annual overhead / actual annual driver level
46. The overhead rates of the traditional functional–based product costing use
a. non–unit–based activity drivers.
b. unit–based activity drivers.
c. process costing.
d. job order costing.

Chapter 4: Activity-Based Costing
47. A costing system that uses actual costs for direct materials and labor and predetermined overhead rates to apply
overhead is called a(n)
a. actual costing system.
b. standard costing system.
c. normal costing system.
d. activity–based costing system.
48. Common measures of production activity include
a. units produced.
b. direct labor hours.
c. machine hours.
d. all of these.
49. If unit-based product costing is used, which of the following would be traced directly to the product?
a. setup costs
b. direct labor
c. maintenance of machinery
d. inspection costs
50. Product costs can be distorted if a unit-based activity driver is used and
a. non–unit-based overhead costs are a significant proportion of total overhead.
b. the consumption ratios differ between unit-based and non-unit-based input categories.
c. both a and b.
d. neither a nor b.
51. All of the following are non-unit-based activity drivers EXCEPT
a. number of direct labor hours.
b. number of inspections.
c. number of setups.
d. number of material moves.

Chapter 4: Activity-Based Costing
52. For a labor-intensive manufacturing operation, which of the following would be the most appropriate activity driver?
a. machine hours
b. direct labor hours
c. number of employees
d. units of output
53. In a department that is drilling holes in materials, which activity base is likely to be most appropriate for assigning
overhead costs?
a. units produced
b. direct labor hours
c. machine hours
d. number of batches
54. All of the following are unit–based activity drivers EXCEPT
a. number of setups.
b. machine hours.
c. number of units.
d. direct labor hours.
55. A department that is capital-intensive most likely would use a predetermined departmental overhead rate based on
which of the following activity bases?
a. units of direct material used
b. direct labor hours
c. direct labor cost
d. machine hours

Chapter 4: Activity-Based Costing
Figure 4-1
The Foremost Company predicted factory overhead for 2016 and 2017 would be $120,000 for each year. The
predicted activity for 2016 and 2017 were 30,000 and 20,000 direct labor hours, respectively. Additional data are as
follows:
2016
2017
Sales in units
25,000
25,000
Selling price per unit
$20
$20
Direct materials and direct labor per unit
$10
$10
The company assumes that the long–run normal production level is 20,000 direct labor hours per year. The actual
factory overhead cost for the end of 2016 and 2017 was $120,000. Assume that it takes one direct labor hour to
make one finished unit.
56. Refer to Figure 4-1. When the annual estimated factory overhead rate is used, the gross profits for 2016 and 2017,
respectively, are
a. $150,000 and $150,000.
b. $150,000 and $100,000.
c. $250,000 and $250,000.
d. $100,000 and $150,000.
57. Refer to Figure 4-1. When the normal factory overhead rate is used, the gross profits for 2016 and 2017,
respectively, are
a. $80,000 and $80,000.
b. $200,000 and $200,000.
c. $120,000 and $140,000.
d. $100,000 and $100,000.
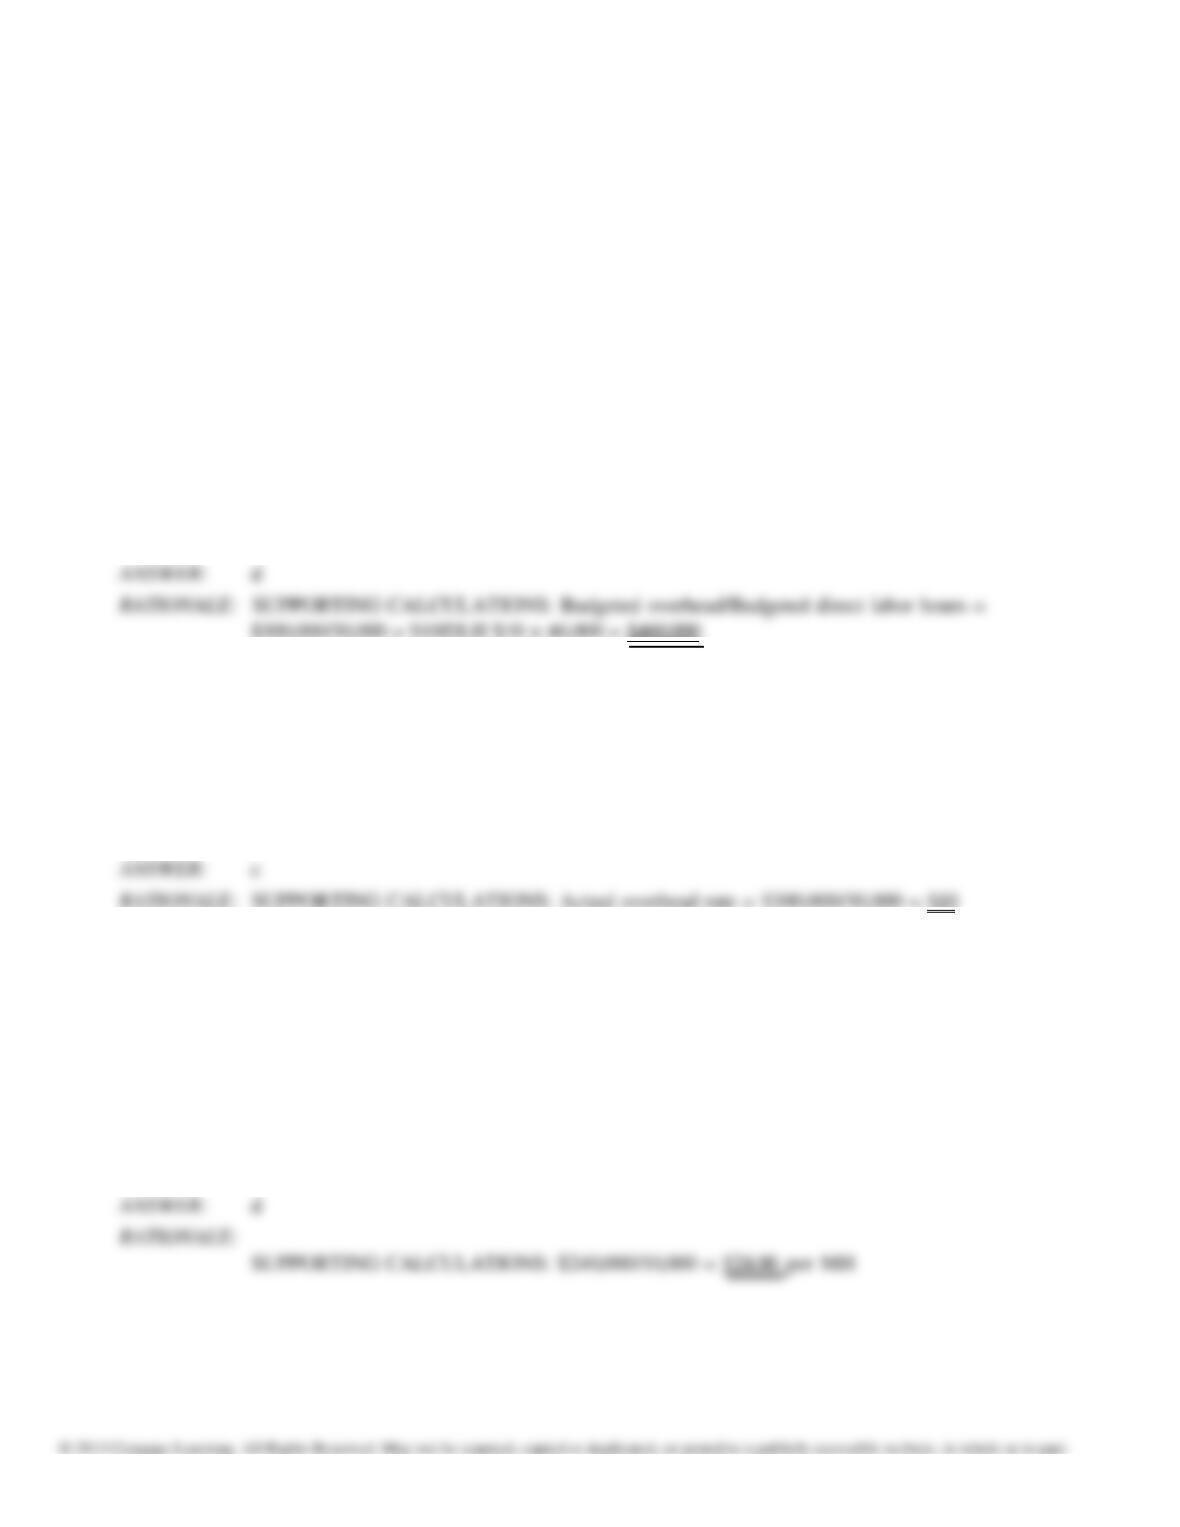
RATIONALE: SUPPORTING CALCULATIONS:
Rate = $120,000/20,000 = $6
2013:
($20 – $10 – $6) × 25,000 = $100,000
2014:
($20 – $10 – $6) × 25,000 = $100,000
Chapter 4: Activity-Based Costing
Figure 4-2
The following information is provided by the Sandman Corporation for the year:
Actual direct labor hours worked
46,00
Budgeted overhead
$300,00
Budgeted direct labor hours
30,00
Actual overhead costs incurred
$460,00
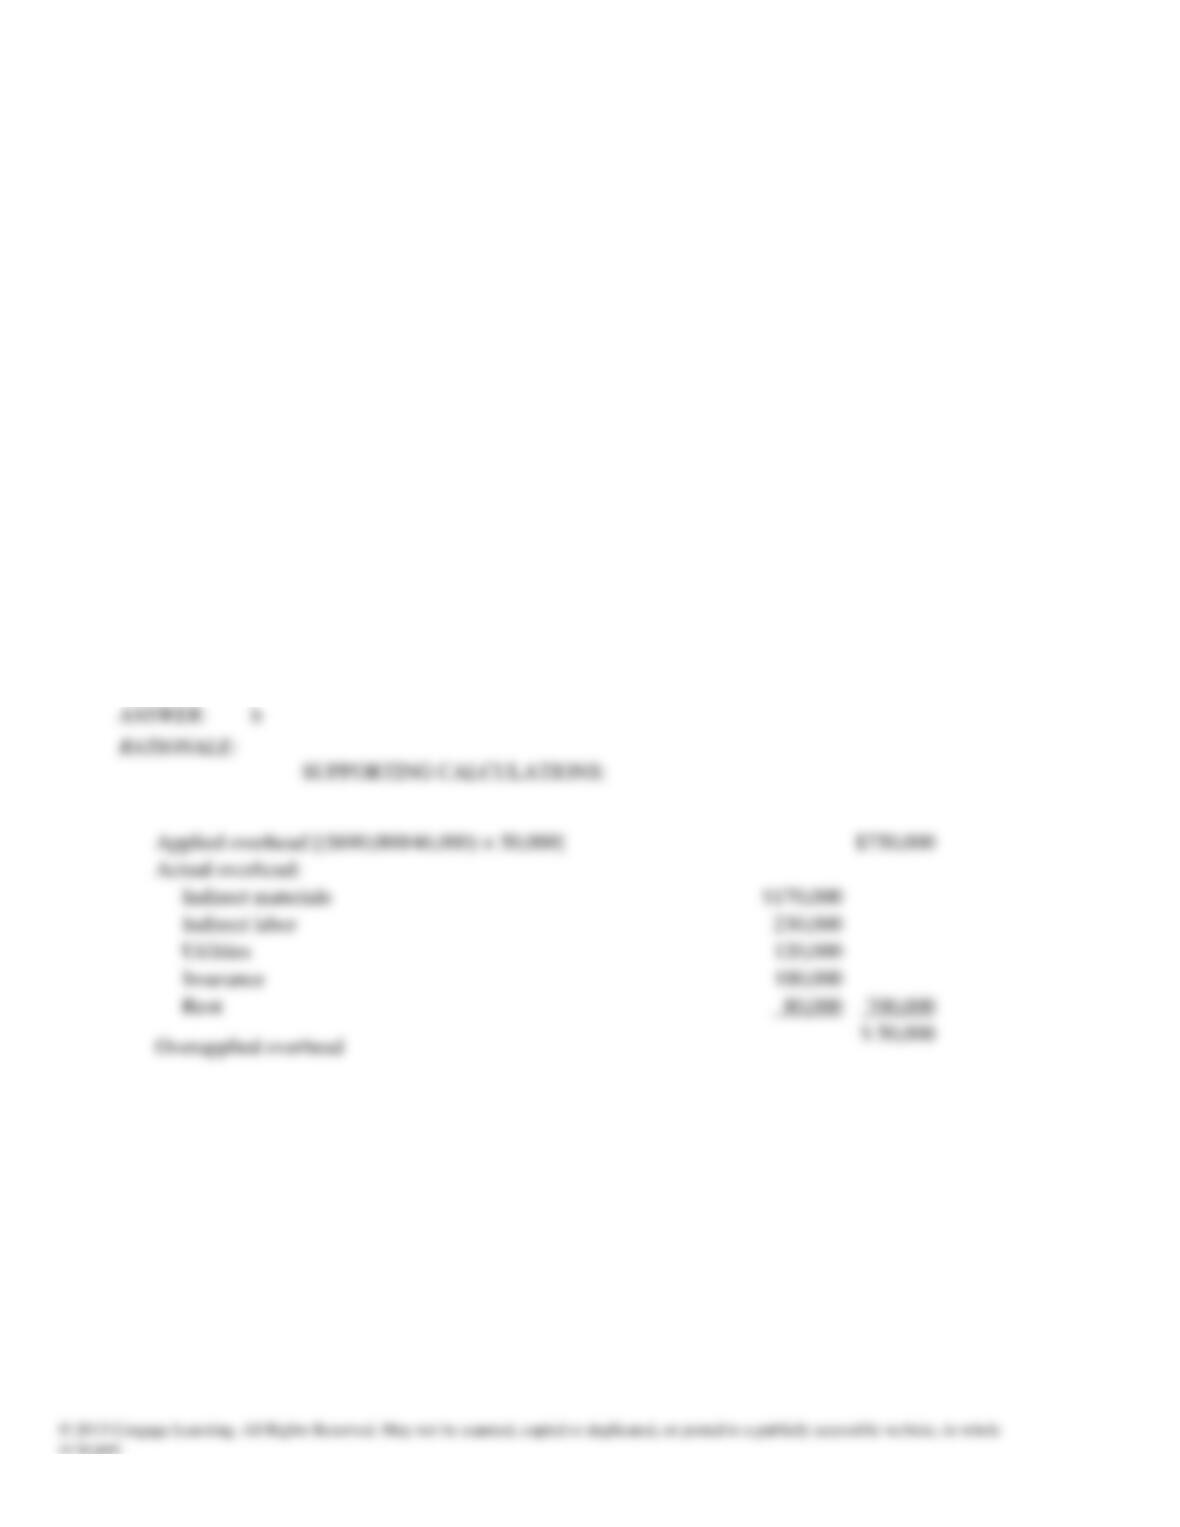
58. Refer to Figure 4-2. If normal costing is used, the amount of overhead applied for the year is
a. $414,000.
b. $400,000.
c. $480,000.
d. $460,000.
59. Refer to Figure 4-2. The actual overhead rate for applying manufacturing overhead is
a. $7.14.
b. $7.50.
c. $10.00.
d. $10.50.
60. Avatar Corporation uses a predetermined rate to apply overhead. At the beginning of the year, Avatar estimated its
overhead costs at $240,000, direct labor hours at 40,000, and machine hours at 10,000. Actual overhead costs
incurred were $249,280, actual direct labor hours were 41,000, and actual machine hours were 11,000.
What is the predetermined overhead rate per machine hour for Avatar?
a. $6.08
b. $5.85
c. $22.66
d. $24.00
Chapter 4: Activity-Based Costing
Figure 4 – 3
The records of Family Manufacturing show the following information:
Estimated manufacturing overhead
$690,000
Estimated machine hours
46,000
Actual machine hours worked
50,000
Actual costs incurred: Indirect materials
$170,000
Indirect labor
230,000
Utilities
120,000
Insurance
100,000
Rent
80,000
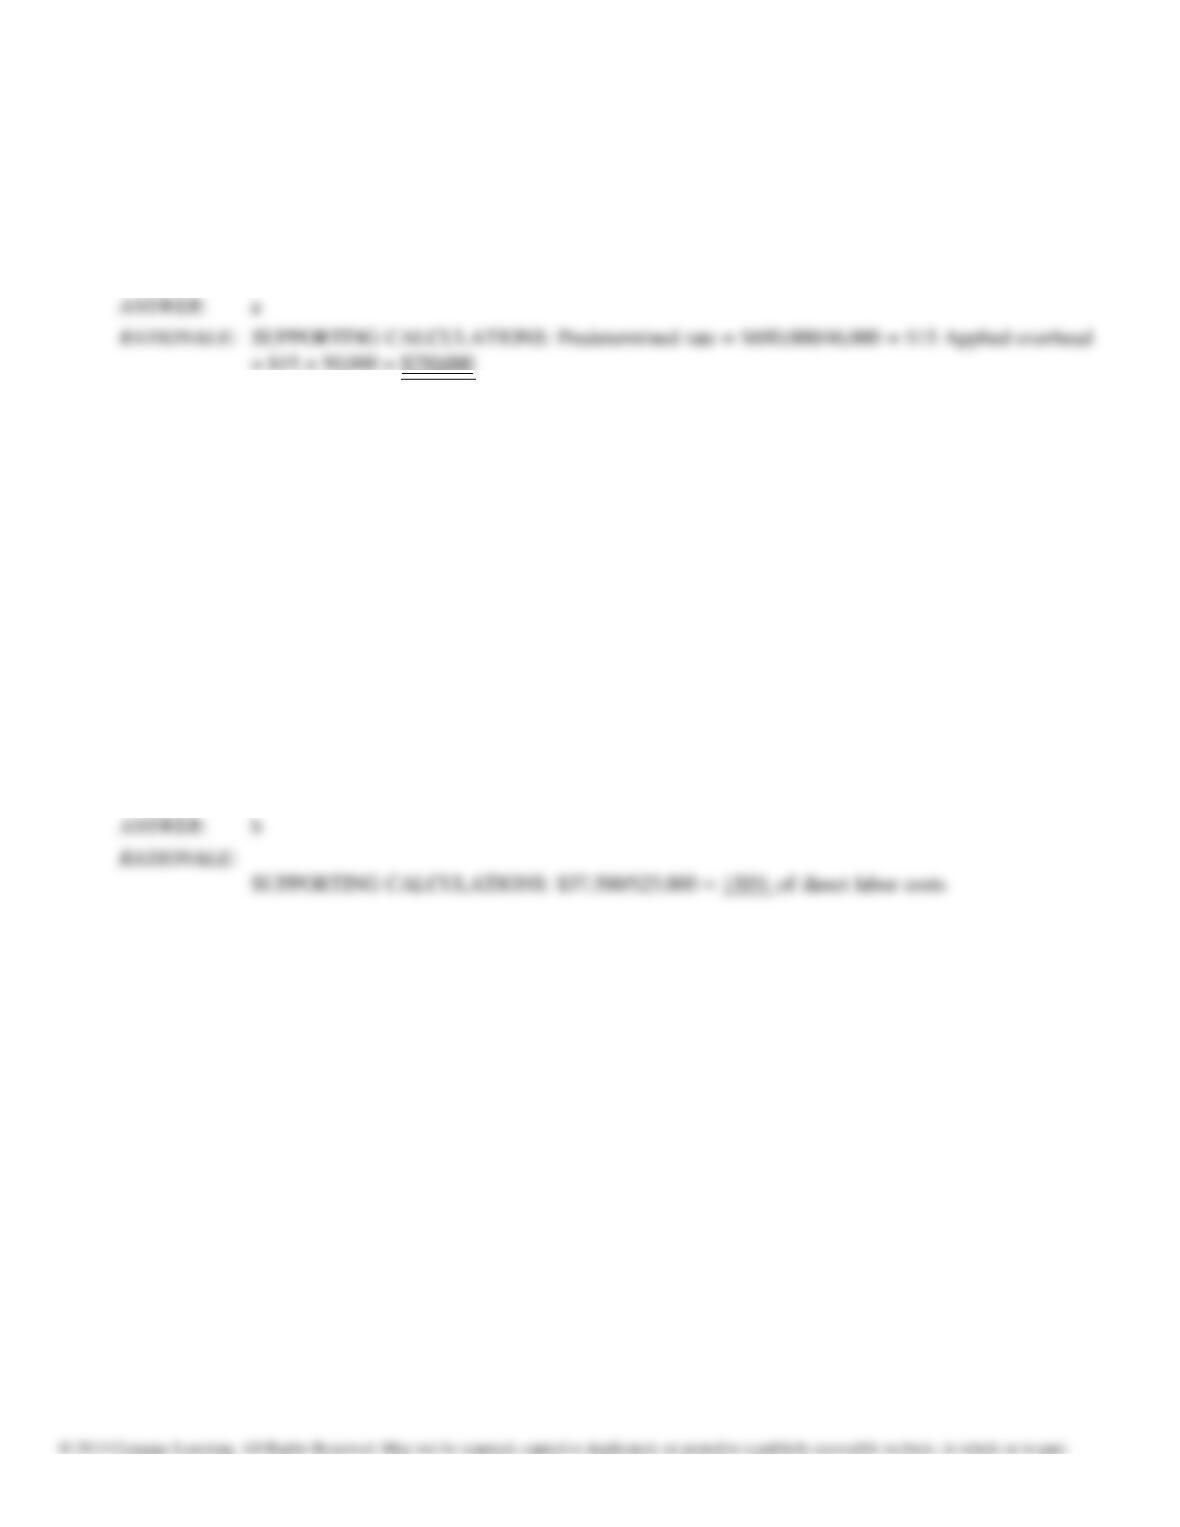
61. Refer to Figure 4-3. The amount of overapplied or underapplied overhead is
a. $10,000 underapplied.
b. $50,000 overapplied.
c. $60,000 overapplied.
d. $65,200 underapplied.
Chapter 4: Activity-Based Costing
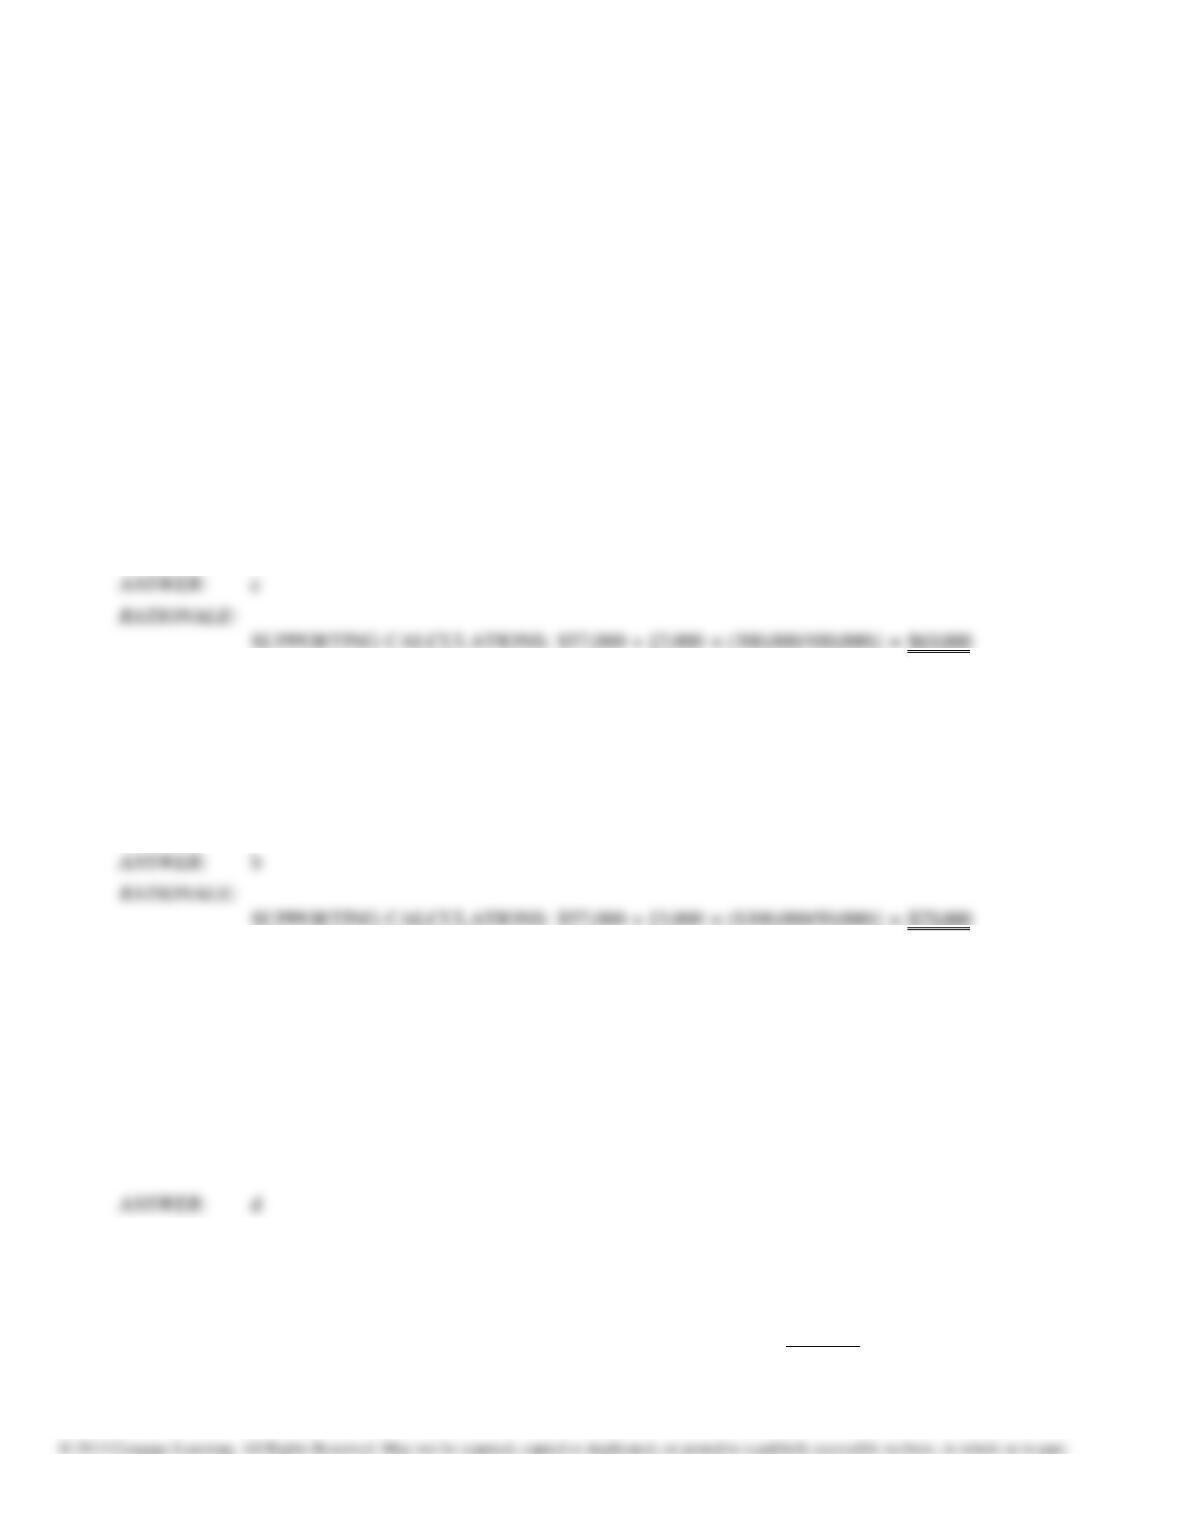
62. Refer to Figure 4-3. The company uses a predetermined overhead rate to apply overhead. Manufacturing overhead
applied is
a. $750,000.
b. $700,000.
c. $690,000.
d. $648,000.
63. The following information pertains to Whitestone Industries for 2016:
Estimated total overhead costs for 2014
$37,500
Estimated direct labor costs for 2014
25,000
Actual direct labor costs
22,500
Actual overhead costs
36,000
Activity base
Direct labor costs
What is the predetermined overhead rate for Whitestone Industries for 2016?
a. 66.7%
b. 150%
c. 160%
d. 62.5%
Chapter 4: Activity-Based Costing
Figure 4-4
Mannitou Company made the following predictions for 2016:
Factory overhead costs $300,000
Direct labor hours 50,000 hours
Machine hours 100,000 hours
Job A2 (which was started and completed in June) used 3,000 direct labor hours, 2,000 machine hours, and
$57,000 of prime costs.
64. Refer to Figure 4-4. If factory overhead is applied based on machine hours, the cost of Job A2 for the Mannitou
Company is
a. $69,000.
b. $75,000.
c. $63,000.
d. $66,000.
65. Refer to Figure 4-4. If factory overhead is applied based on direct labor hours, the cost of Job A2 for the
Mannitou Company is
a. $60,000.
b. $75,000.
c. $63,000.
d. $66,000.
66. The Magnanimous Company uses a predetermined overhead rate of $12 per direct labor hour to apply overhead.
During the year, 30,000 direct labor hours were worked. Actual overhead costs for the year were $320,000. The
overhead variance is
a. $40,000 underapplied.
b. $35,560 underapplied.
c. $36,000 overapplied.
d. none of the above.
RATIONALE: SUPPORTING CALCULATIONS:
Applied overhead ($12 × 30,000)
$360,000
Actual overhead
320,000
Overapplied overhead
$40,000
Chapter 4: Activity-Based Costing
67. The following information is provided for the year:
Actual direct labor hours worked
27,500
Budgeted overhead
$525,000
Budgeted direct labor hours
30,000
Actual overhead costs incurred
$481,250
If normal costing is used, the amount of overhead applied for the year is
a. $568,750.00.
b. $441,031.25.
c. $481,250.00.
d. $525,000.00.
68. The following information is provided by the Sutton Corporation for the year:
Actual overhead
$450,000
Actual machine hours worked
25,000
Budgeted machine hours
27,500
Applied overhead
$487,500
If normal costing is used, budgeted overhead used to calculate the predetermined rate would be
a. $443,250. b. $450,000. c. $487,500. d. $536,250.
69. Assume the following: Actual overhead costs equaled estimated overhead. Actual direct labor hours exceeded
estimated direct labor hours used to calculate the predetermined overhead rate. If overhead is applied using the
predetermined overhead rate, then overhead is
a. $-0-.
b. underapplied.
c. overapplied.
d. indeterminable from the information given.
Chapter 4: Activity-Based Costing
Manufacturing overhead cost
$700,000
$400,000
Machine hours
10,000
4,000
Direct labor hours
12,000
16,000
70. Bear Claw Industries uses a job-order costing system. The Molding Department applies overhead based on
machine hours, while the Assembly Department applies overhead based on direct labor hours. The company
made the following estimates at the beginning of the current year:
Molding Assembly
The following information was available for Job No. 7-29, which was started and completed during August:
Job No. 7-29
Molding
Assembly
Direct materials
$3,500
$ 7,500
Direct labor
$9,000
$12,500
Direct labor hours
900
1,250
Machine hours
500
400
The predetermined overhead rate for the molding department is
a. $100.
b. $83.
c. $70.
d. $50.
Chapter 4: Activity-Based Costing
71. Lonestar Corporation uses a job-order costing system to account for product costs. The following information
pertains to 20160:
Materials Placed into Production
$140,00
Indirect Labor
40,000
Direct Labor (10,000 hours)
160,000
Depreciation of Factory Building
60,000
Other Factory Overhead
100,000
Increase in Work-in–Process Inventory
30,000
Factory overhead rate is $18 per direct labor hour.
What is the amount of under- or overapplied overhead for Lonestar Corporation in 2016?
a. $40,000 overapplied
b. $20,000 overapplied
c. $40,000 underapplied
d. $20,000 underapplied
72. Material amounts of underapplied or overapplied overhead should be
a. treated as an adjustment to cost of goods sold.
b. treated as an adjustment to work in process.
c. allocated to direct materials, work in process, and finished goods.
d. allocated to work in process, finished goods, and cost of goods sold.
Chapter 4: Activity-Based Costing
73. Account balances from the Boilermakers Company are as follows:
Manufacturing Overhead $240,000 underapplied
Work in Process 100,000
Finished Goods 300,000
Cost of Goods Sold 800,000
If underapplied or overapplied overhead is material and is allocated to Work in Process, Finished Goods, and Cost
of Goods Sold (based on ending account balances), Cost of Goods Sold after adjustment would have a balance of
a. $ 960,000.
b. $ 640,000.
c. $1,040,000.
d. $1,440,000.
Figure 4-5
The Brookstone Company produces 9 volt batteries and AAA batteries. The Brookstone Company uses a
plantwide rate to apply overhead based on direct labor hours. The following data is given:
Actual overhead
$325,000
Estimated Overhead
$350,000
Estimated activity:
9 volt battery
100,000 direct labor hours
AAA battery
400,000 direct labor hours
Actual activity:
9 volt battery
125,000 direct labor
hours
AAA battery
400,000 direct labor
hours
Units produced:
9 volt battery
500,000
AAA battery
250,000
Chapter 4: Activity-Based Costing
74. Refer to Figure 4-5. What is the predetermined overhead rate? (round to 2 decimal places)
a. $0.62
b. $0.65
c. $0.67
d. $0.70
75. Refer to Figure 4-5. How much overhead is applied to each 9 volt batteries and AAA batteries respectively?
(round to 2 decimal places)
a. $87,500; $280,000
b. $70,000; $280,00
c. $81,250; $260,000
d. none of these
76. Refer to Figure 4-5. How much was overhead over/underapplied?
a. $25,000
b. $17,500
c. $42,500
d. none of these
77. Refer to Figure 4-5. If the accounts had the following balances, how much will cost of goods sold be adjusted?
Raw Materials Inventory
$200,00
Work in Process Inventory
$100,00
Finished Goods Inventory
$200,00
Cost of Goods Sold
$500,00
a. debit $12,500
b. debit $21,250
c. credit $26,562.50
d. none of these
Chapter 4: Activity-Based Costing
Figure 4-6
The Fast & Furious Company produces two products: toy planes and toy race cars. They use departmental
overhead rates for the two production departments: molding and finishing. Molding uses machine hours to assign
overhead and Finishing uses direct labor hours. 50,000 planes and 250,000 race cars are produced. Please find
the following data:
Molding
Finishing
Total
Estimated Overhead
$250,000
$100,000
$350,000
Actual Overhead
$240,000
$120,000
$360,000
Expected Direct Labor Hours
planes
5,000
5,000
10,000
race cars
5,000
35,000
40,000
Expected Machine Hours
planes
17,000
3,000
20,000
race cars
3,000
7,000
10,000
Actual Direct Labor Hours
planes
4,500
5,300
10,000
race cars
5,500
34,500
40,000
Actual Machine Hours
planes
16,500
3,500
20,000
race cars
3,200
6,800
10,000
78. Refer to Figure 4-6. What are the departmental overhead rates for the molding and finishing department
respectively?
a. $25; $2.50
b. $8.33; $2
c. $25; $10
d. $12.50; $2.50
79. Refer to Figure 4-6. How much overhead is applied to the planes?
a. $ 60,000
b. $250,000
c. $219,500
d. $225,000
Chapter 4: Activity-Based Costing
80. Refer to Figure 4-6. What is the overhead per unit for race cars? (round to 3 decimal places)
a. $0.50
b. $0.505
c. $0.32
d. $1.40
81. Refer to Figure 4-6. How much was overhead over or underapplied?
a. $14,250
b. $10,000
c. $ 4,250
d. none of these
82. Motorsports, Inc. had a predetermined overhead rate of $2 per direct labor hour. The direct labor hours were
estimated to be 25,000. The actual manufacturing overhead incurred was $47,000 and 24,000 actual direct labor
hours were worked. How much was overhead over/under applied last year?
a. $1,000 underapplied
b. $2,000 underapplied
c. $1,000 overapplied
d. $3,000 overapplied
83. Tarot Company has a predetermined overhead rate of $6 per direct labor hour. Last year the company incurred
$156,600 of actual manufacturing overhead cost and the account was $12,600 underapplied. How many direct
labor hours were worked during the year?
a. 24,000 direct labor hours
b. 25,000 direct labor hours
c. 26,000 direct labor hours
d. 28,200 direct labor hours