Exam
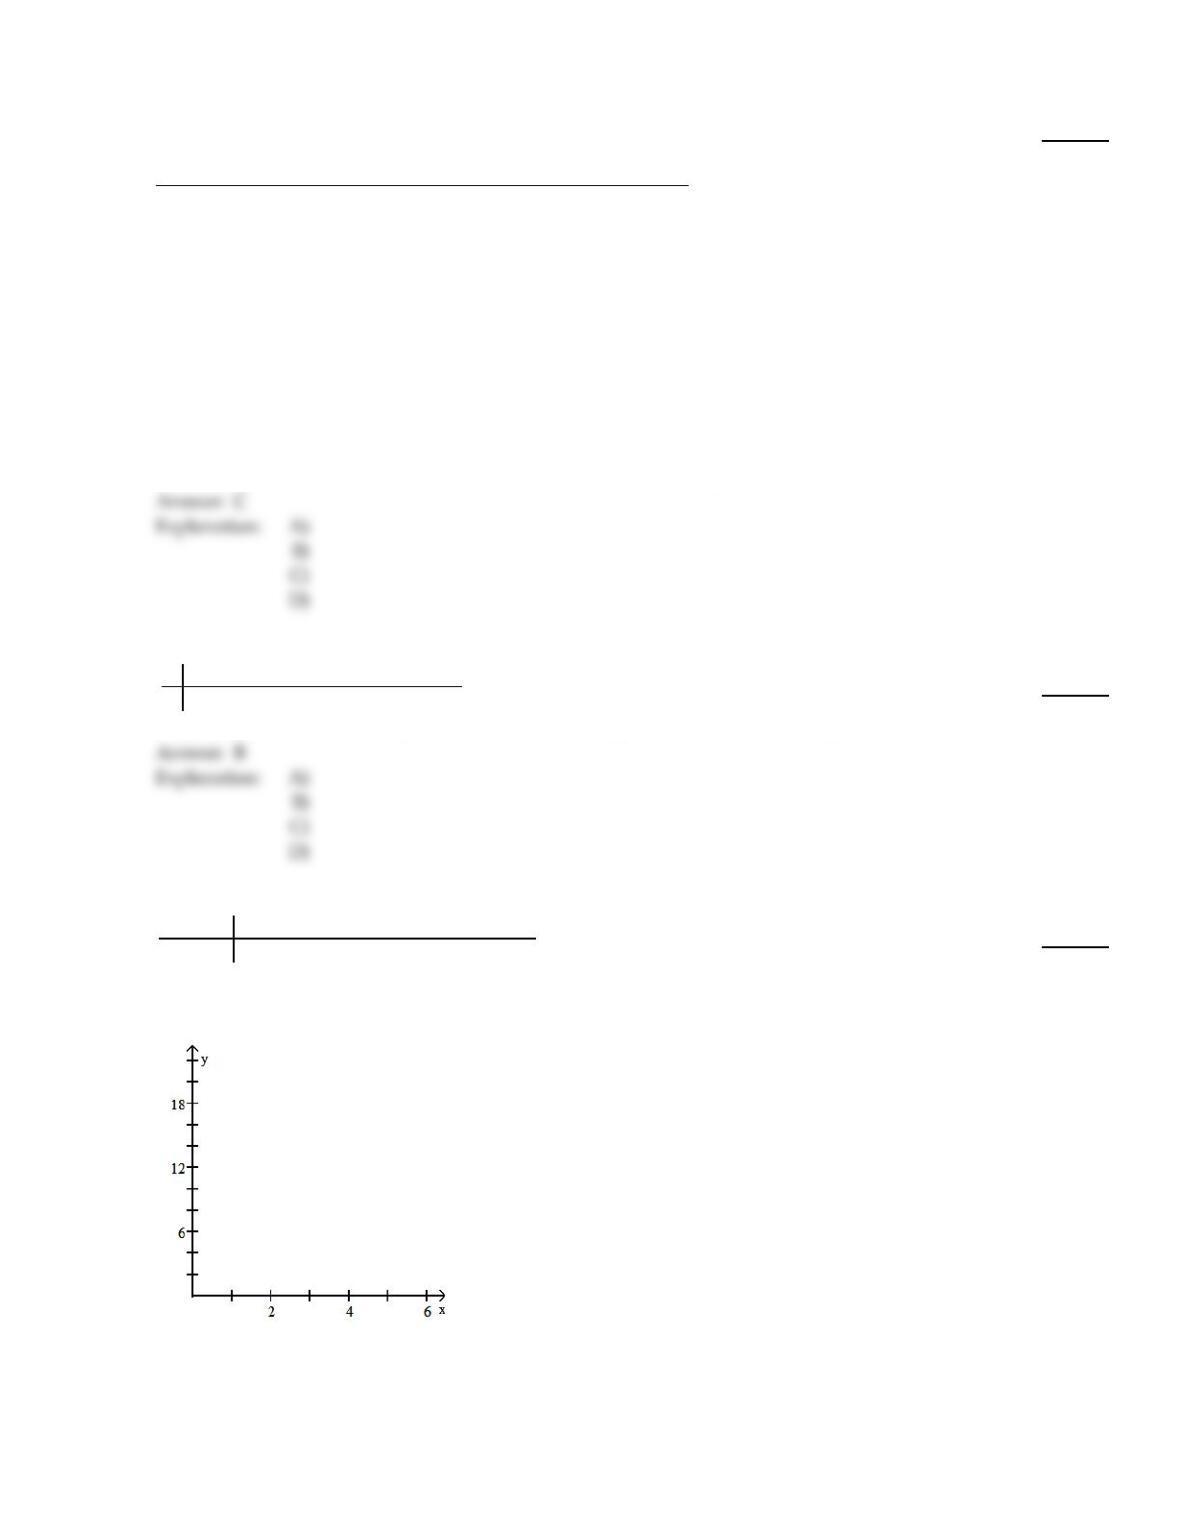
Name___________________________________
MULTIPLE CHOICE. Choose the one alternative that best completes the statement or answers the question.
Provide an appropriate response.
1)
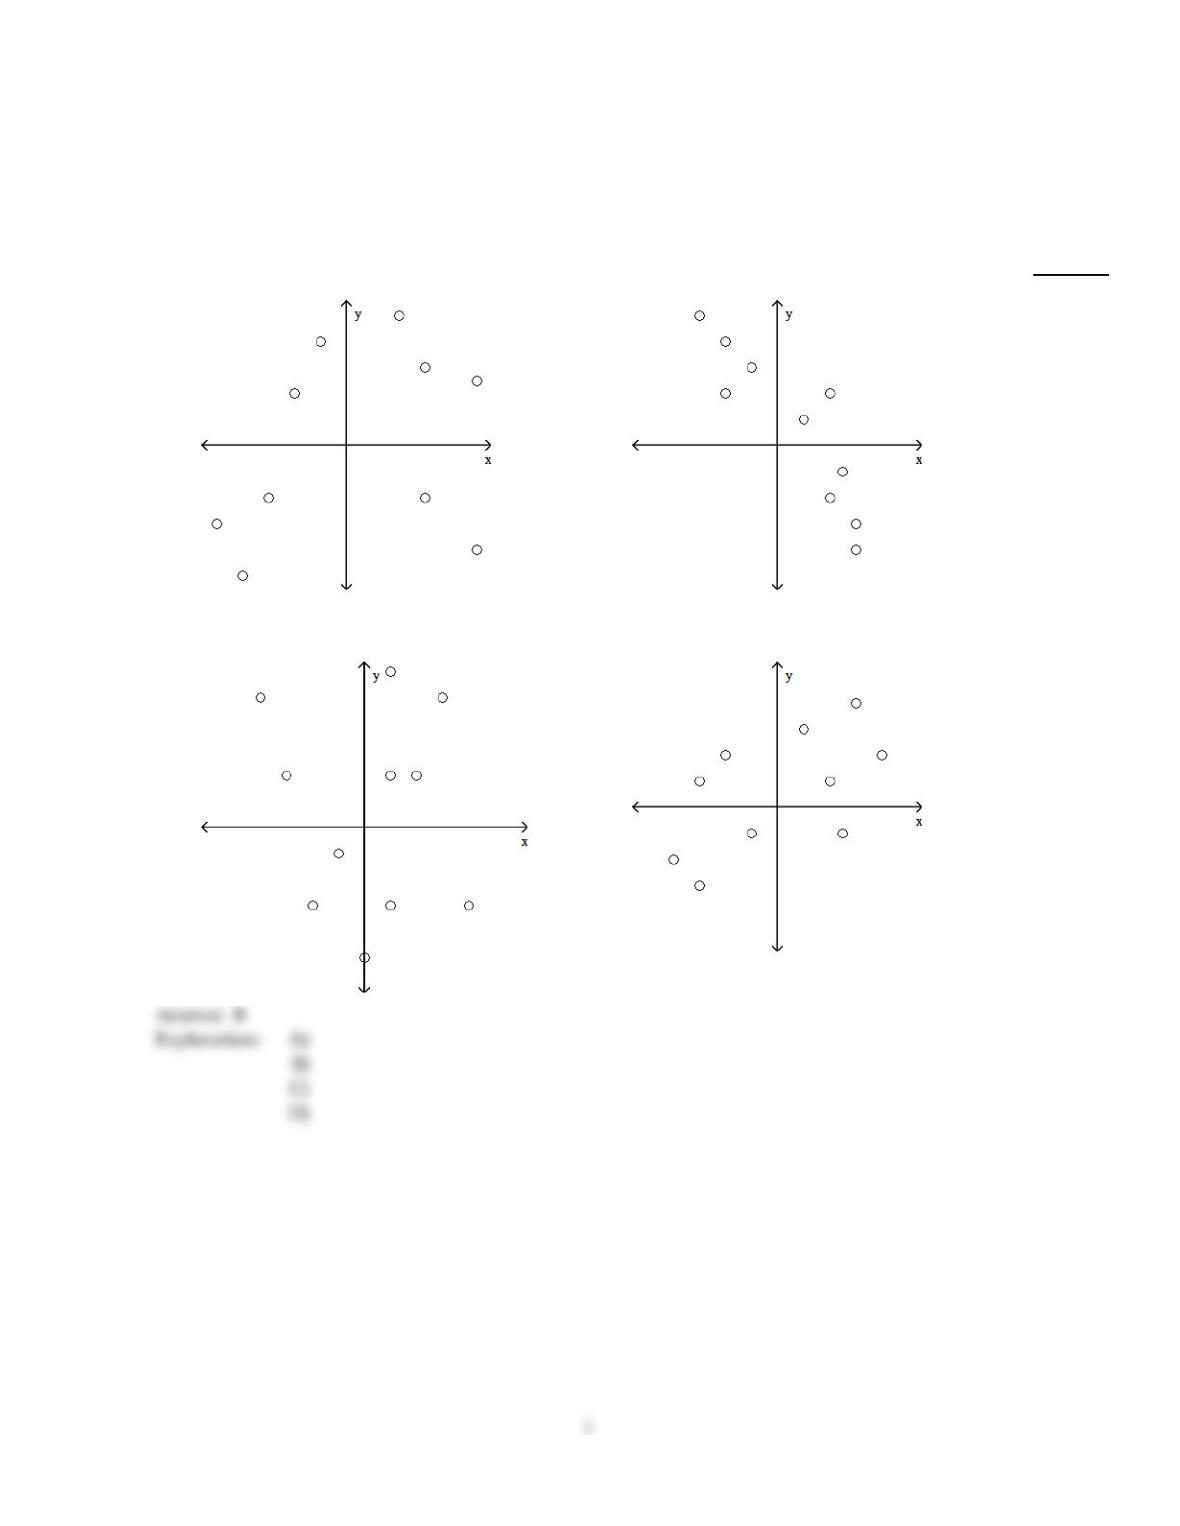
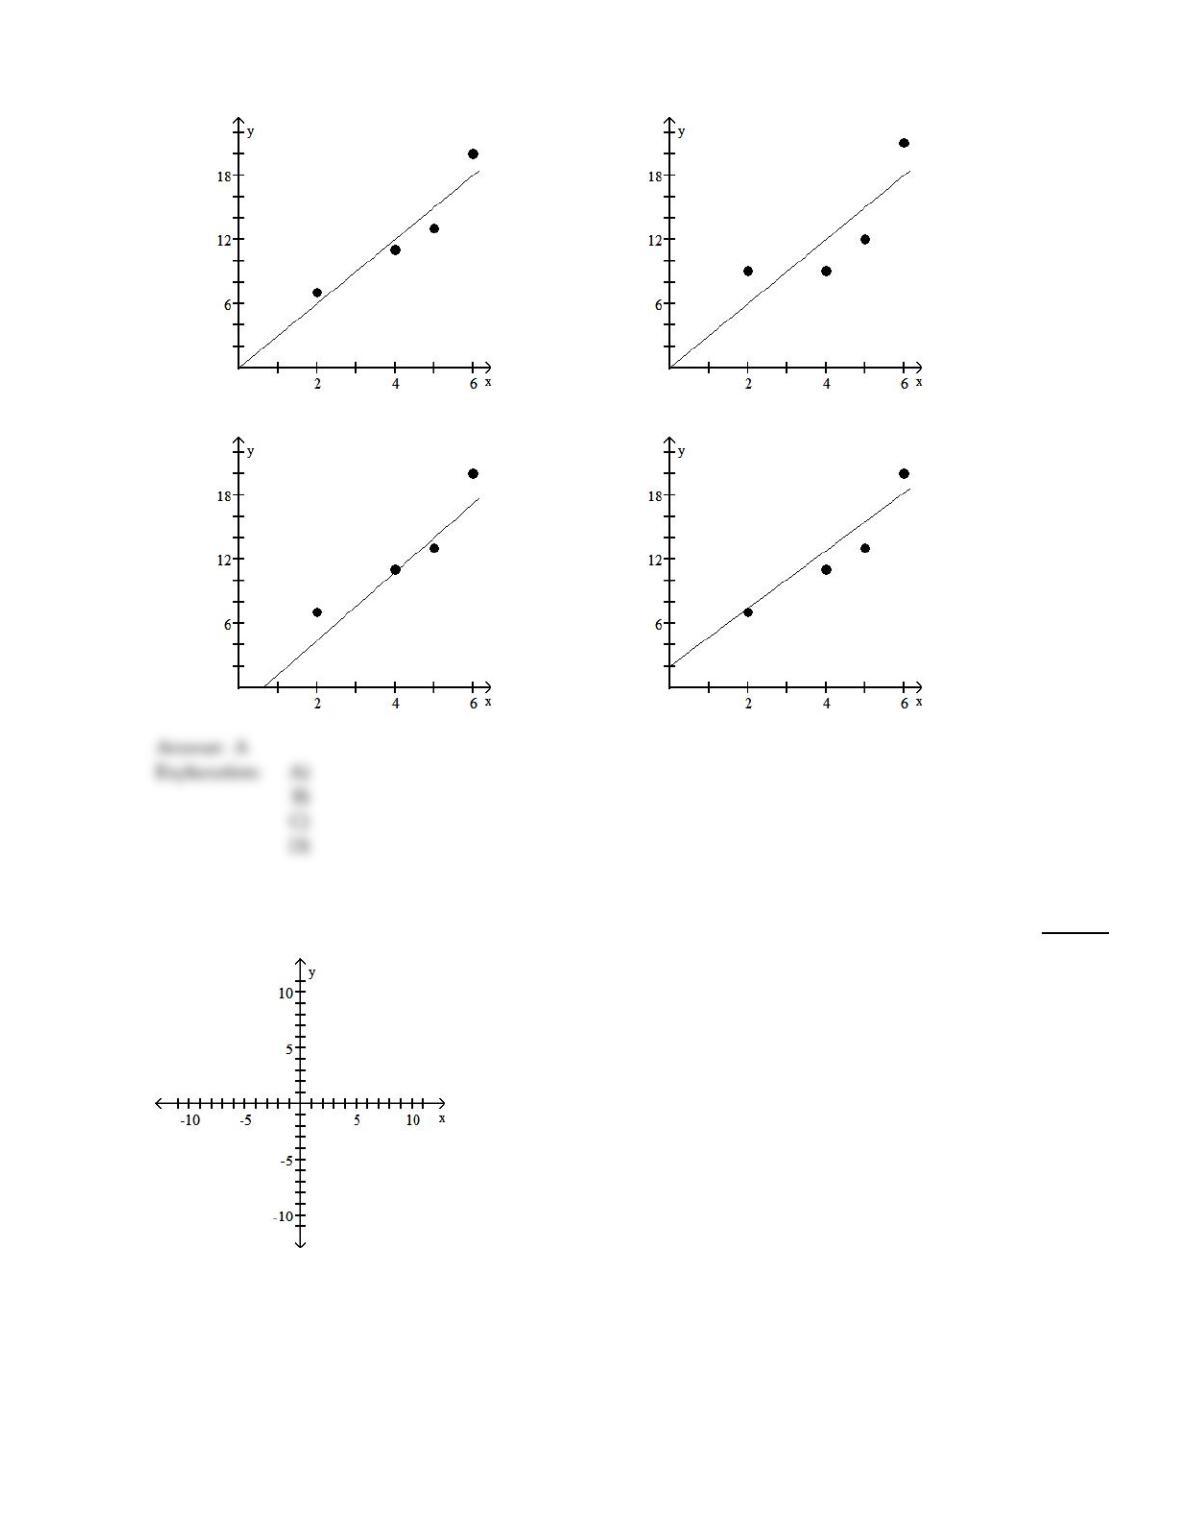
Determine which scatterplot shows the strongest linear correlation.
1)
A)
B)
C)
D)
SHORT ANSWER. Write the word or phrase that best completes each statement or answers the question.
2)
When performing regression analysis, how can you evaluate how useful the regression
equation is for making predictions?
2)
3)
^
A set of data consists of the number of years that applicants for foreign service jobs have
studied German and the grades that they receive on a proficiency test. The following
regression equation is obtained:
y= 31.6 + 10.9x, where x represents the number of years of study and y represents the
grade on the test. Identify the predictor and response variables.
3)
4)
A regression equation is obtained for the following set of data.
x 2 4 6 9 10 12
y 28 33 39 45 47 52
For what range of x–values would it be reasonable to use the regression equation to predict
the y–value corresponding to a given x–value? Why?
4)
5)
Explain how to obtain the straight–line graph of the linear equation y = 3 – 4x. Be sure to
specify which x–values you would use and what the corresponding points on the line are.
Would this method work for an equation whose graph is not a straight line? Why or why
not?
5)
6)
For each of 200 randomly selected cities, Pete compared data for the number of churches in
the city (x) and the number of homicides in the past decade (y). He calculated the linear
correlation coefficient and was surprised to find a strong positive linear correlation for the
two variables. Does this suggest that when a city builds new churches this will tend to
cause an increase in the number of homicides? Why do you think that a strong positive
linear correlation coefficient was obtained?
6)
Solve the problem.
7)
A car mechanic tells a client that it will cost $120 for parts plus $50 per hour for labor to fix
her car. Let x denote the number of hours of labor and let y denote the total cost to fix the
car. Obtain the equation that expresses y in terms of x. Construct a table of values using the
x–values 2, 3, and 5 hours. Draw the graph of the equation by plotting the points from the
table and connecting them with a straight line. Use the graph to estimate visually the total
cost of fixing the car if the number of hours of labor is 3.5.
7)
8)
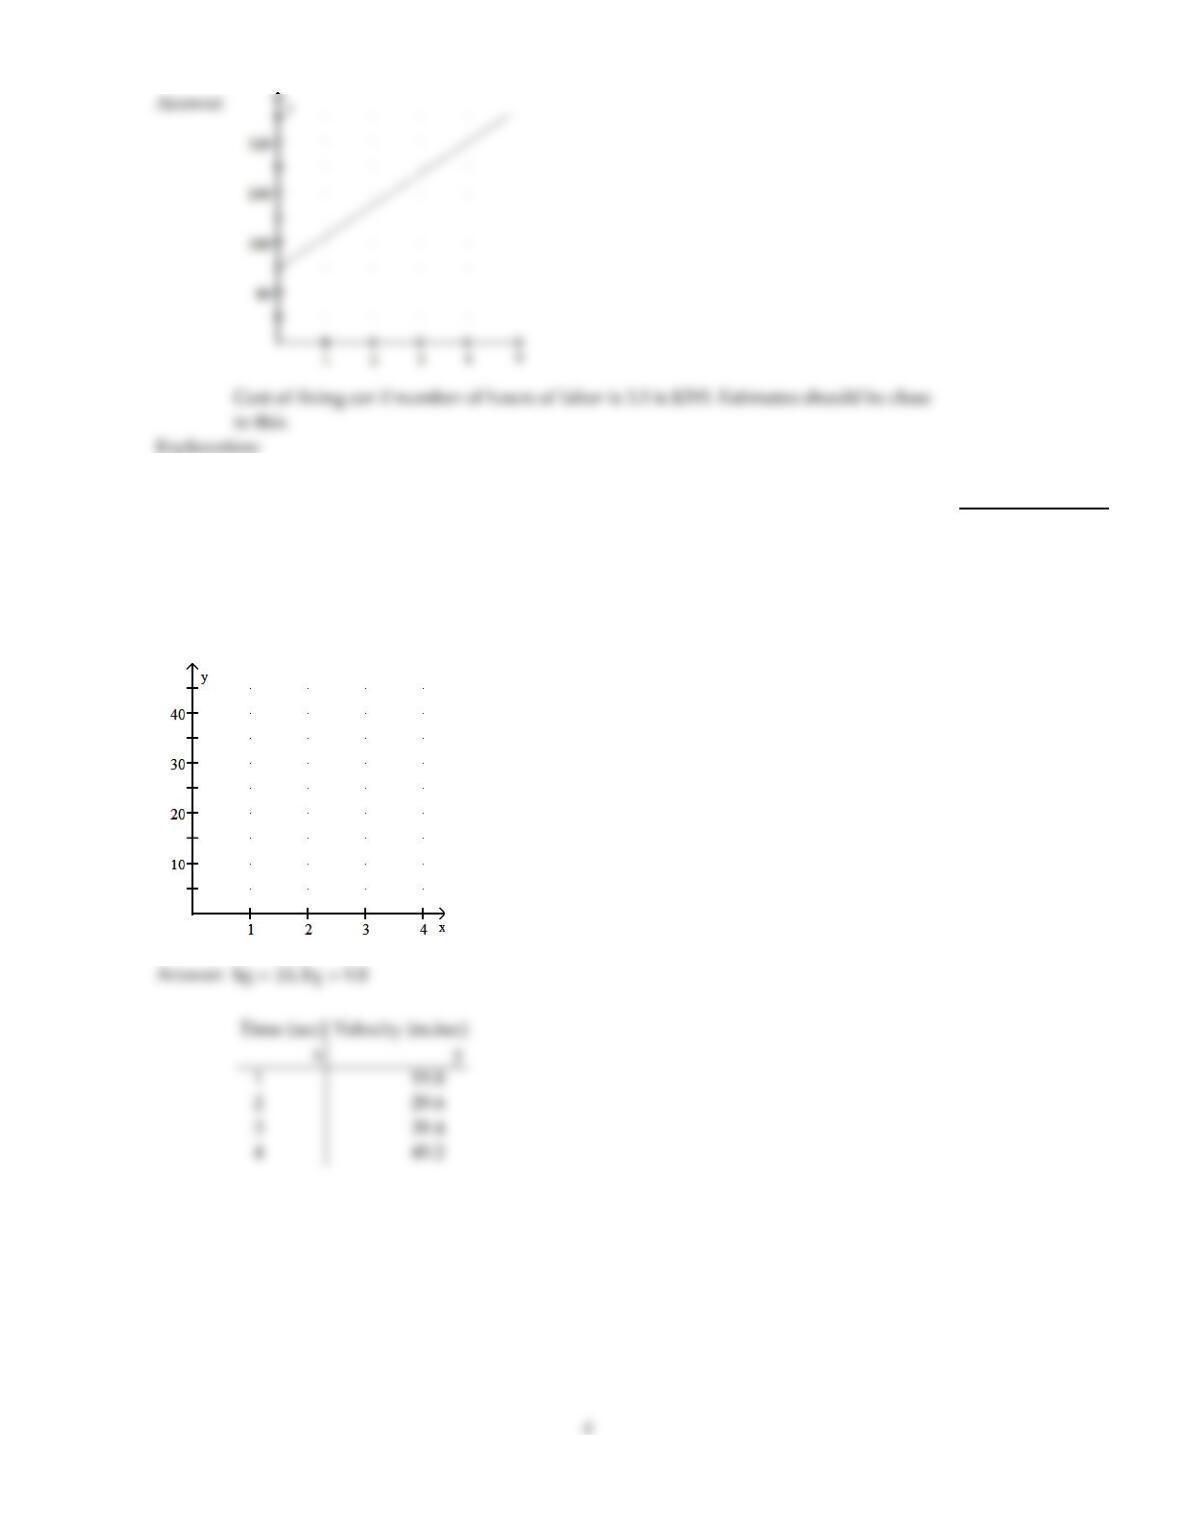
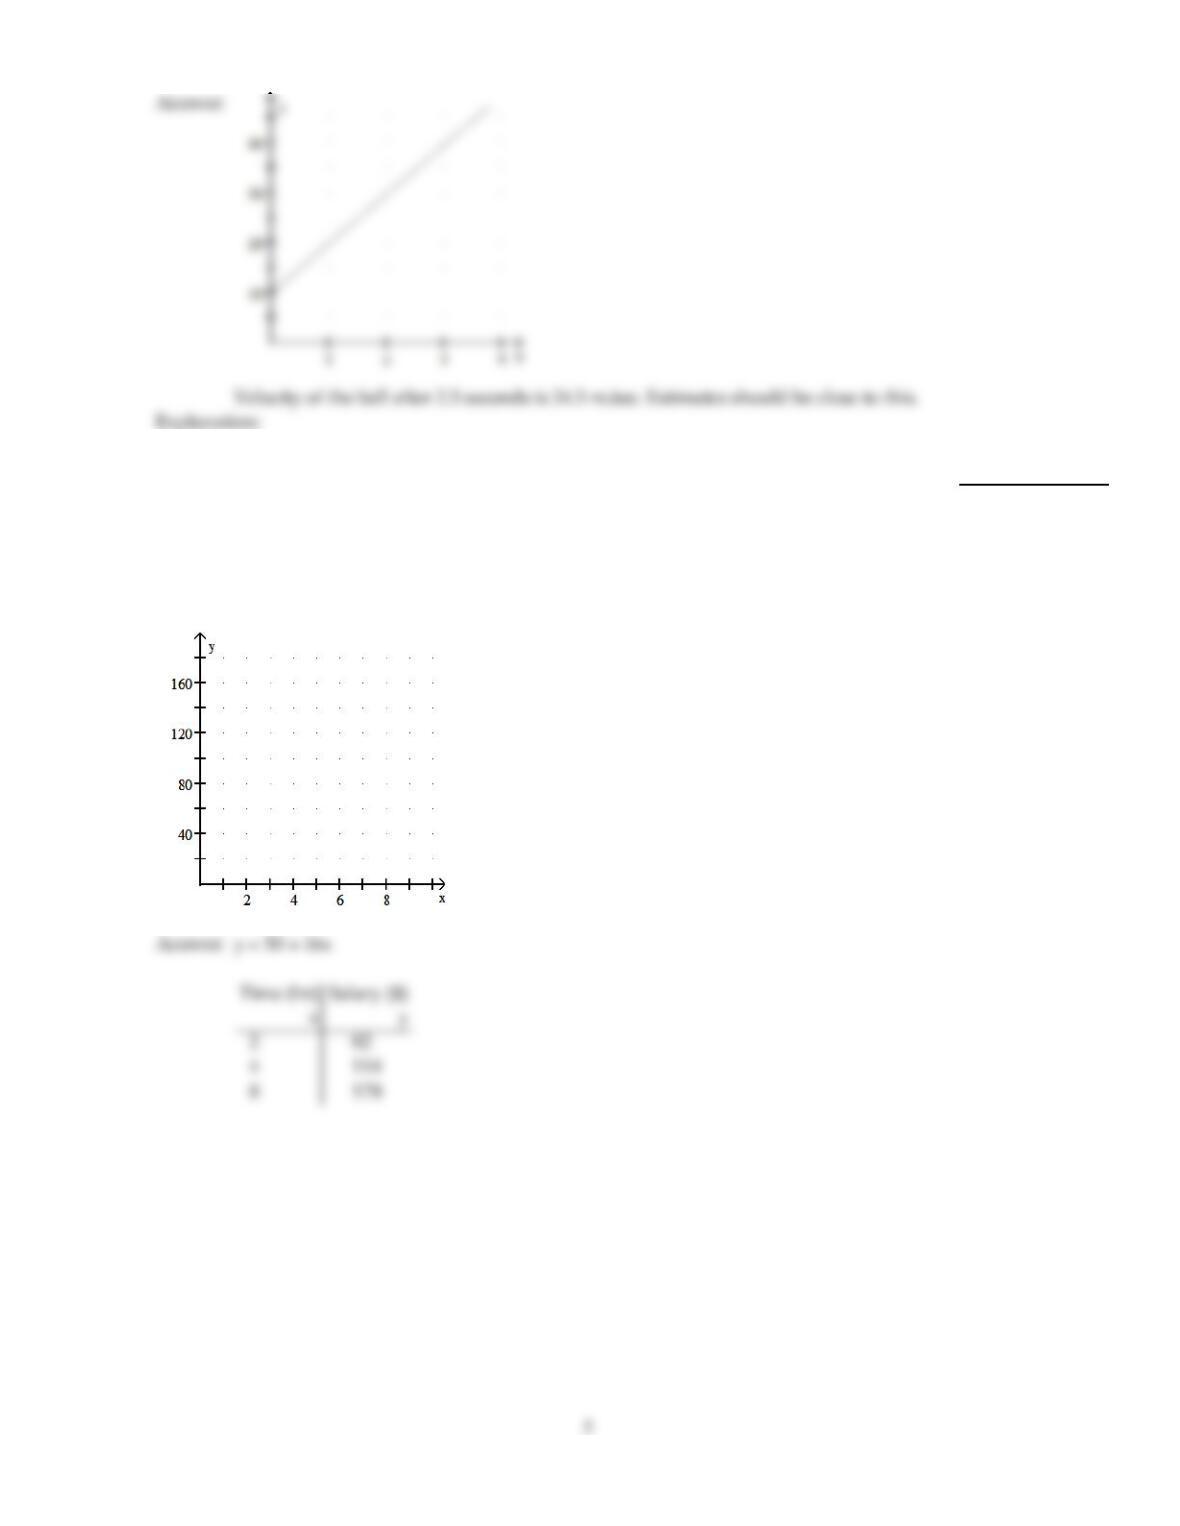
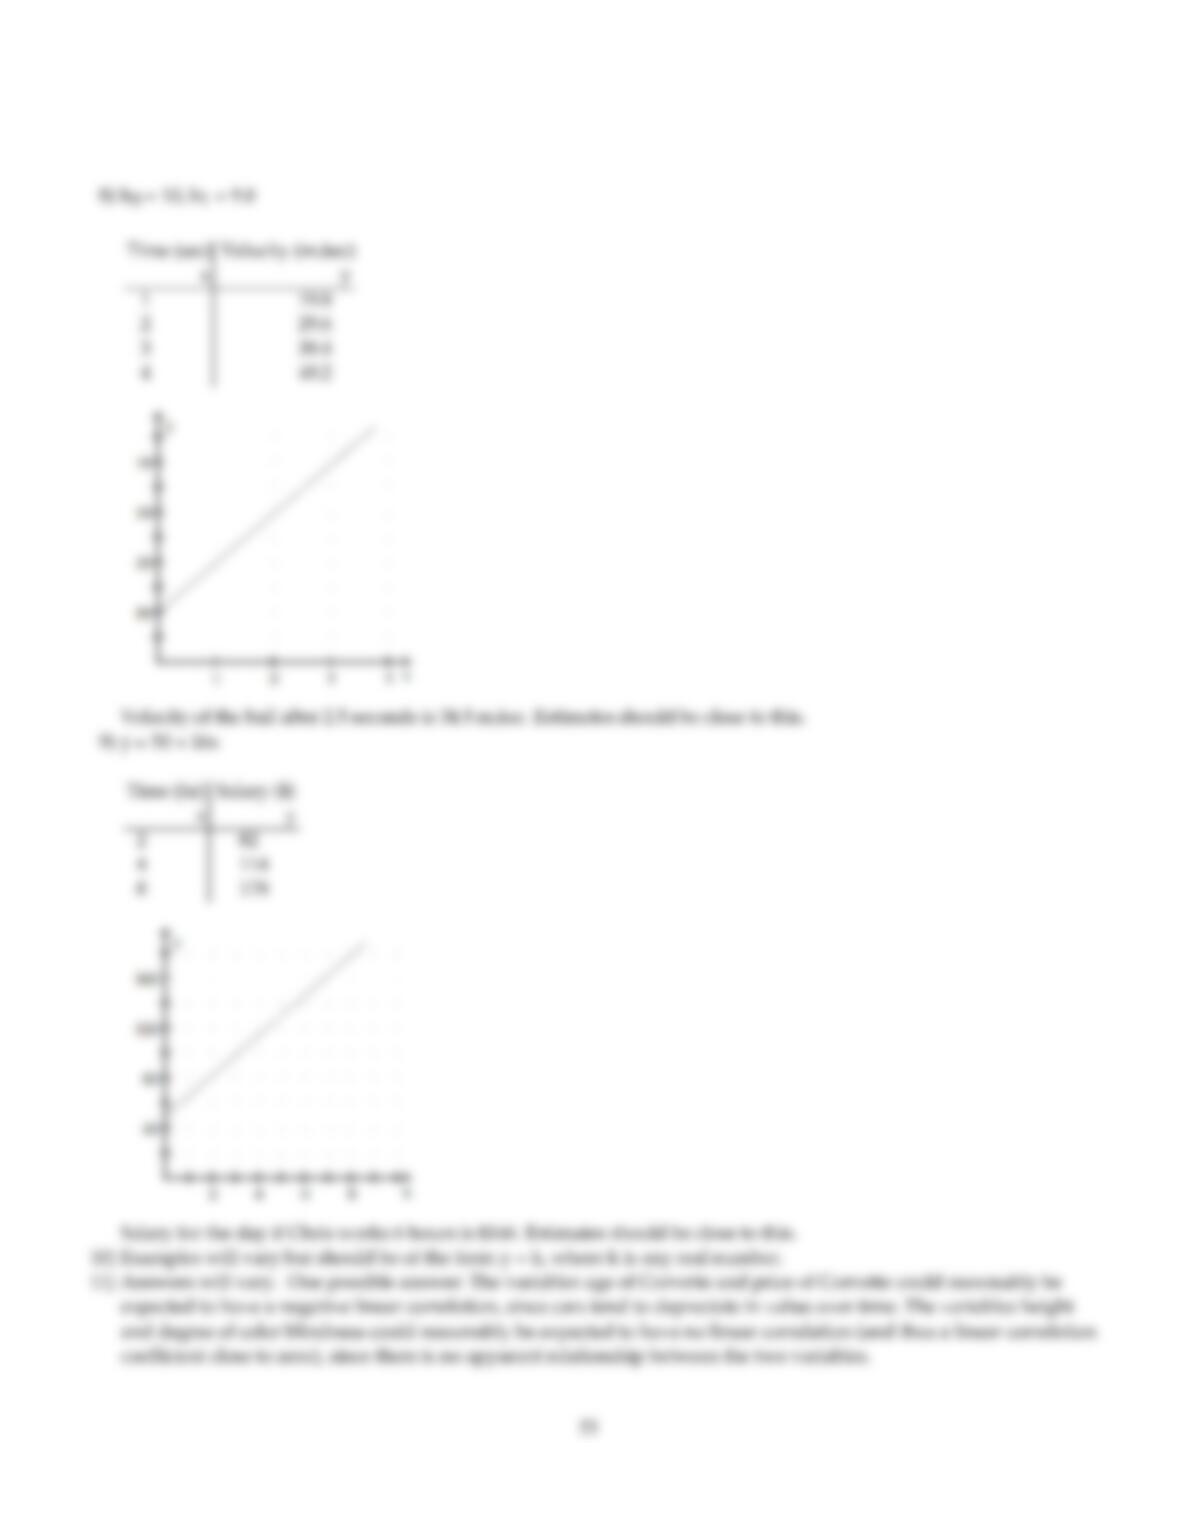
A ball is thrown downward from a tall building with an initial velocity of 10 meters per
second (m/sec). According to the laws of physics, if you let y denote the velocity of the ball
after x seconds, y = 10 + 9.8x. Determine b0 and b1 for this linear equation. Determine the
velocity of the ball after 1, 2, 3, and 4 seconds. Use these four points to graph the linear
equation y = 10 + 9.8x. Use the graph to estimate visually the velocity of the ball after 2.5
seconds.
8)
9)
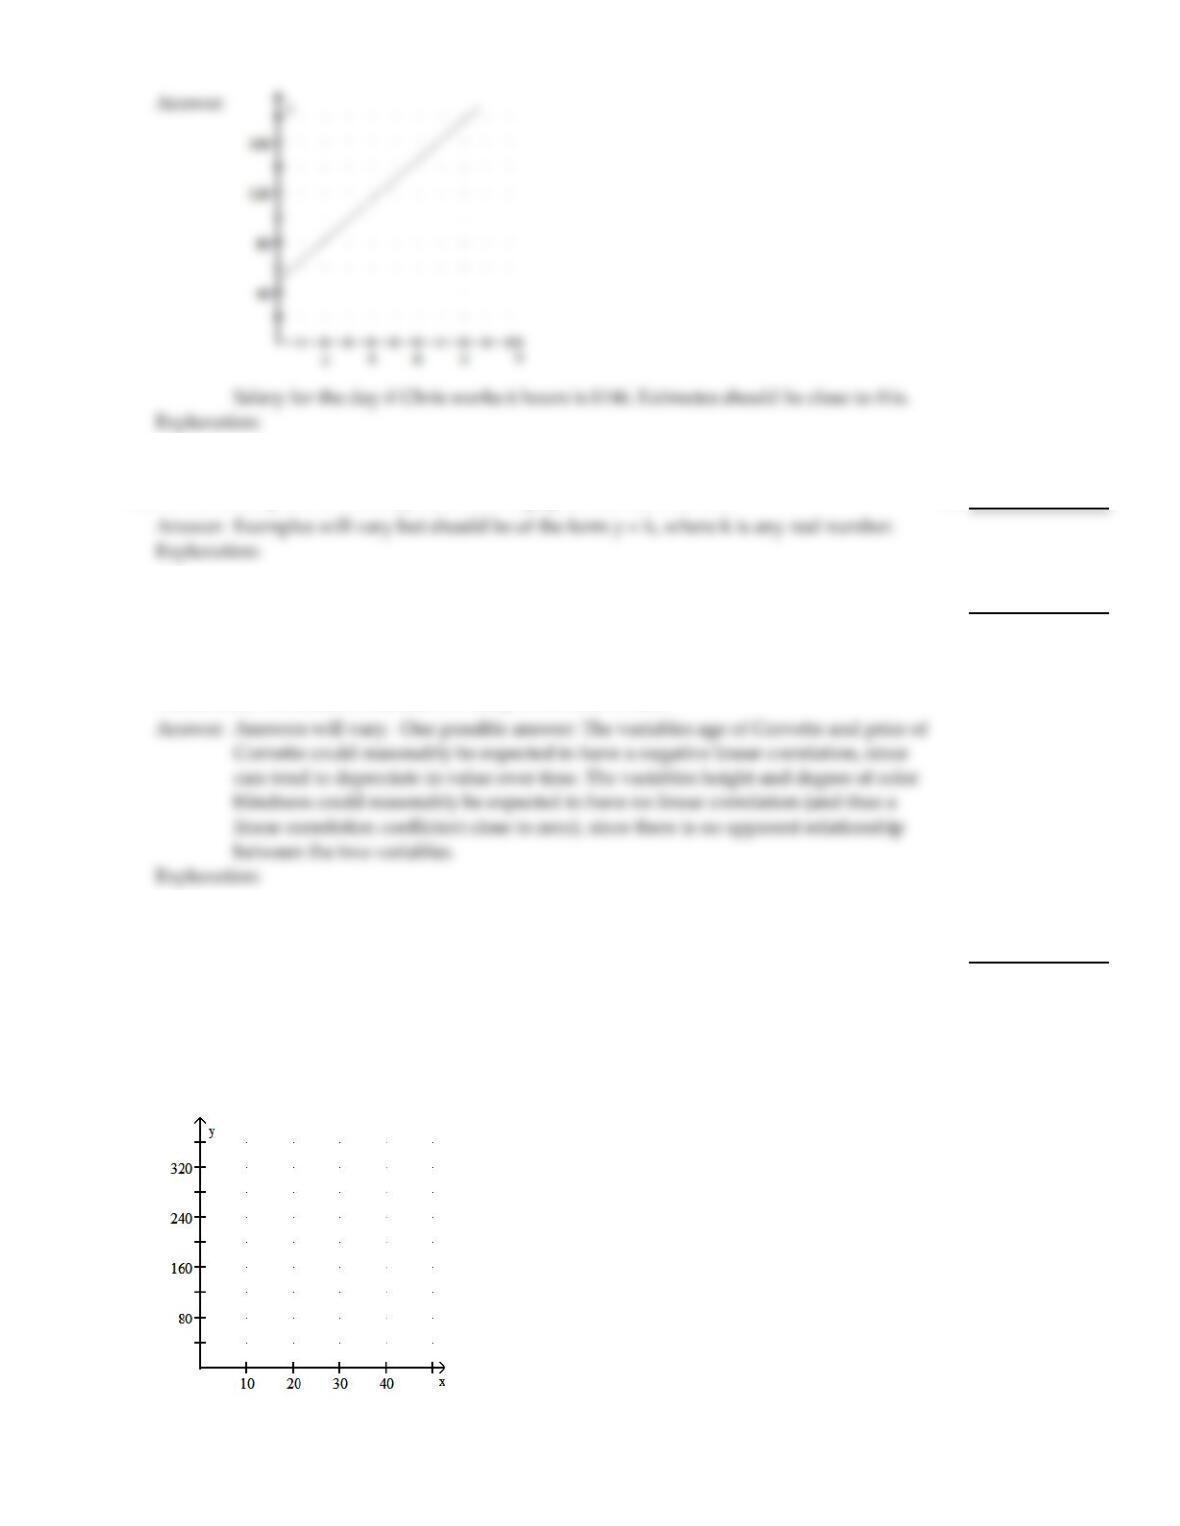
For a day’s work, Chris is paid $50 to cover expenses plus $16 per hour. Let x denote the
number of hours Chris works in a day and let y denote Chris’s total salary for the day.
Obtain the equation that expresses y in terms of x. Construct a table of values using the
x–values 2, 4, and 8 hours. Draw the graph of the equation by plotting the points from the
table and connecting them with a straight line. Use the graph to estimate visually Chris’s
salary for the day if he works 6 hours.
9)
Provide an appropriate response.
10)
Give an example of a linear equation whose graph is a horizontal line.
10)
11)
The variables height and weight could reasonably be expected to have a positive linear
correlation coefficient, since taller people tend to be heavier, on average, than shorter
people. Give an example of a pair of variables which you would expect to have a negative
linear correlation coefficient and explain why. Then give an example of a pair of variables
whose linear correlation coefficient is likely to be close to zero.
11)
Solve the problem.
12)
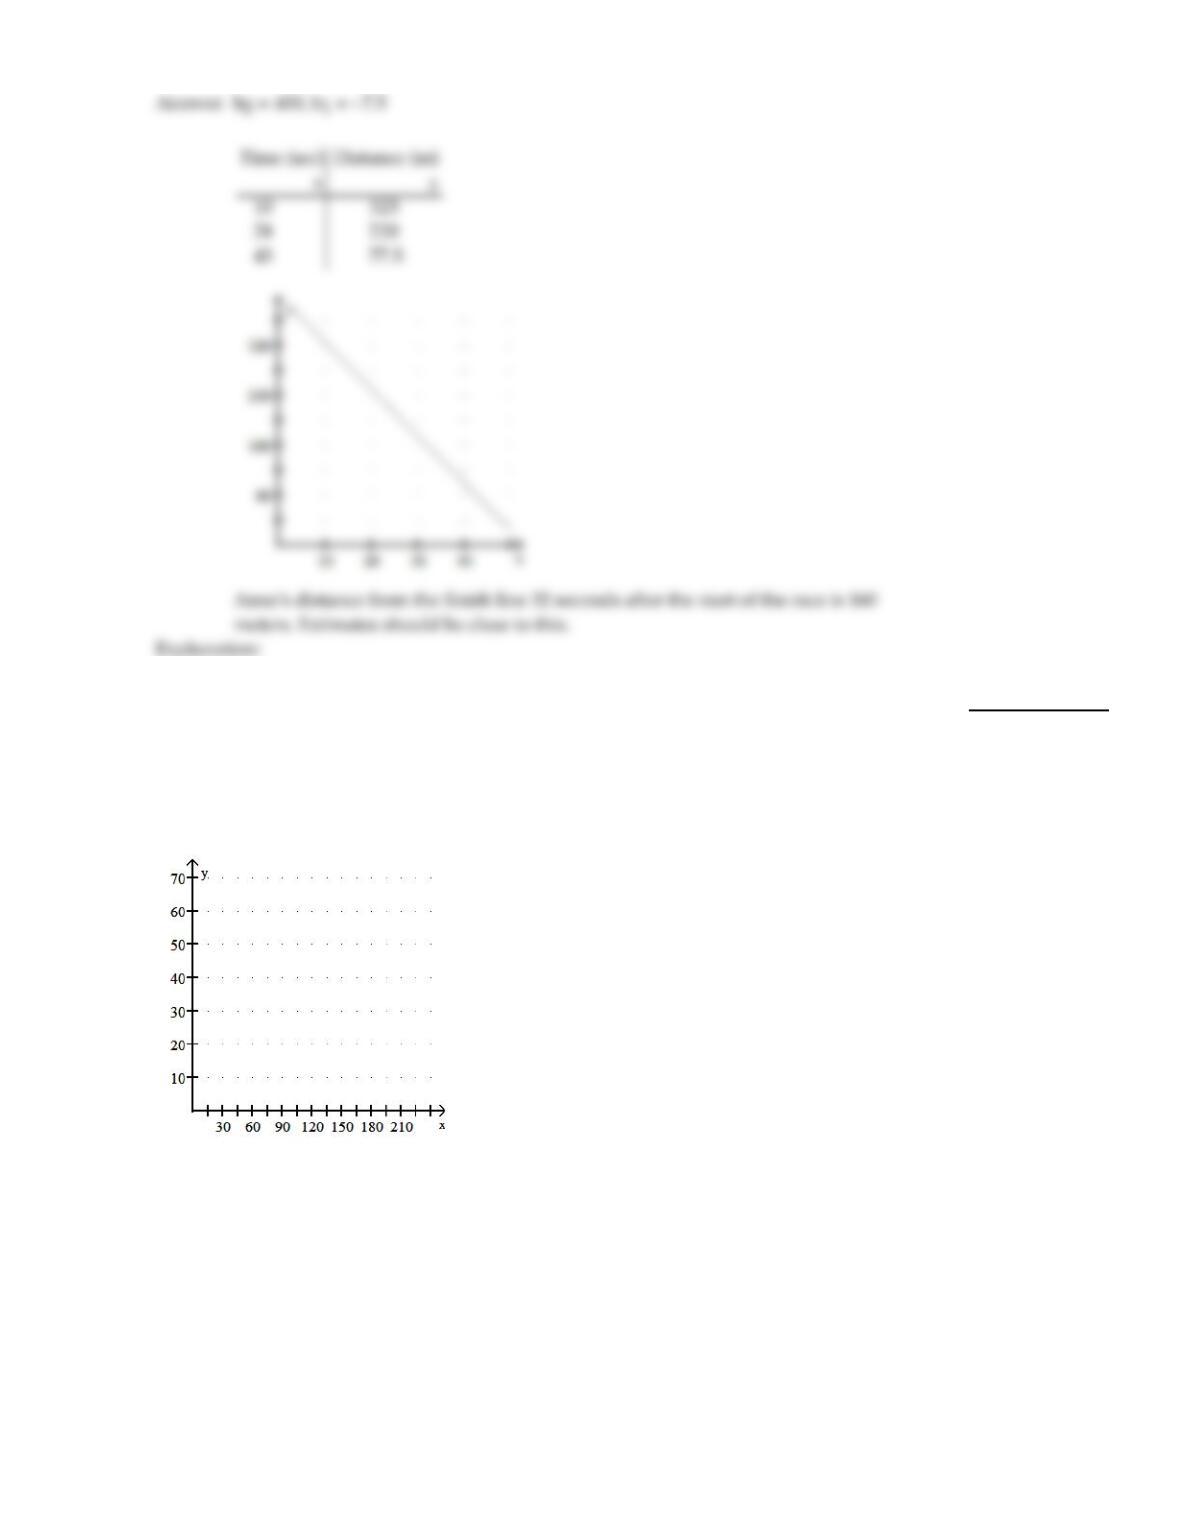
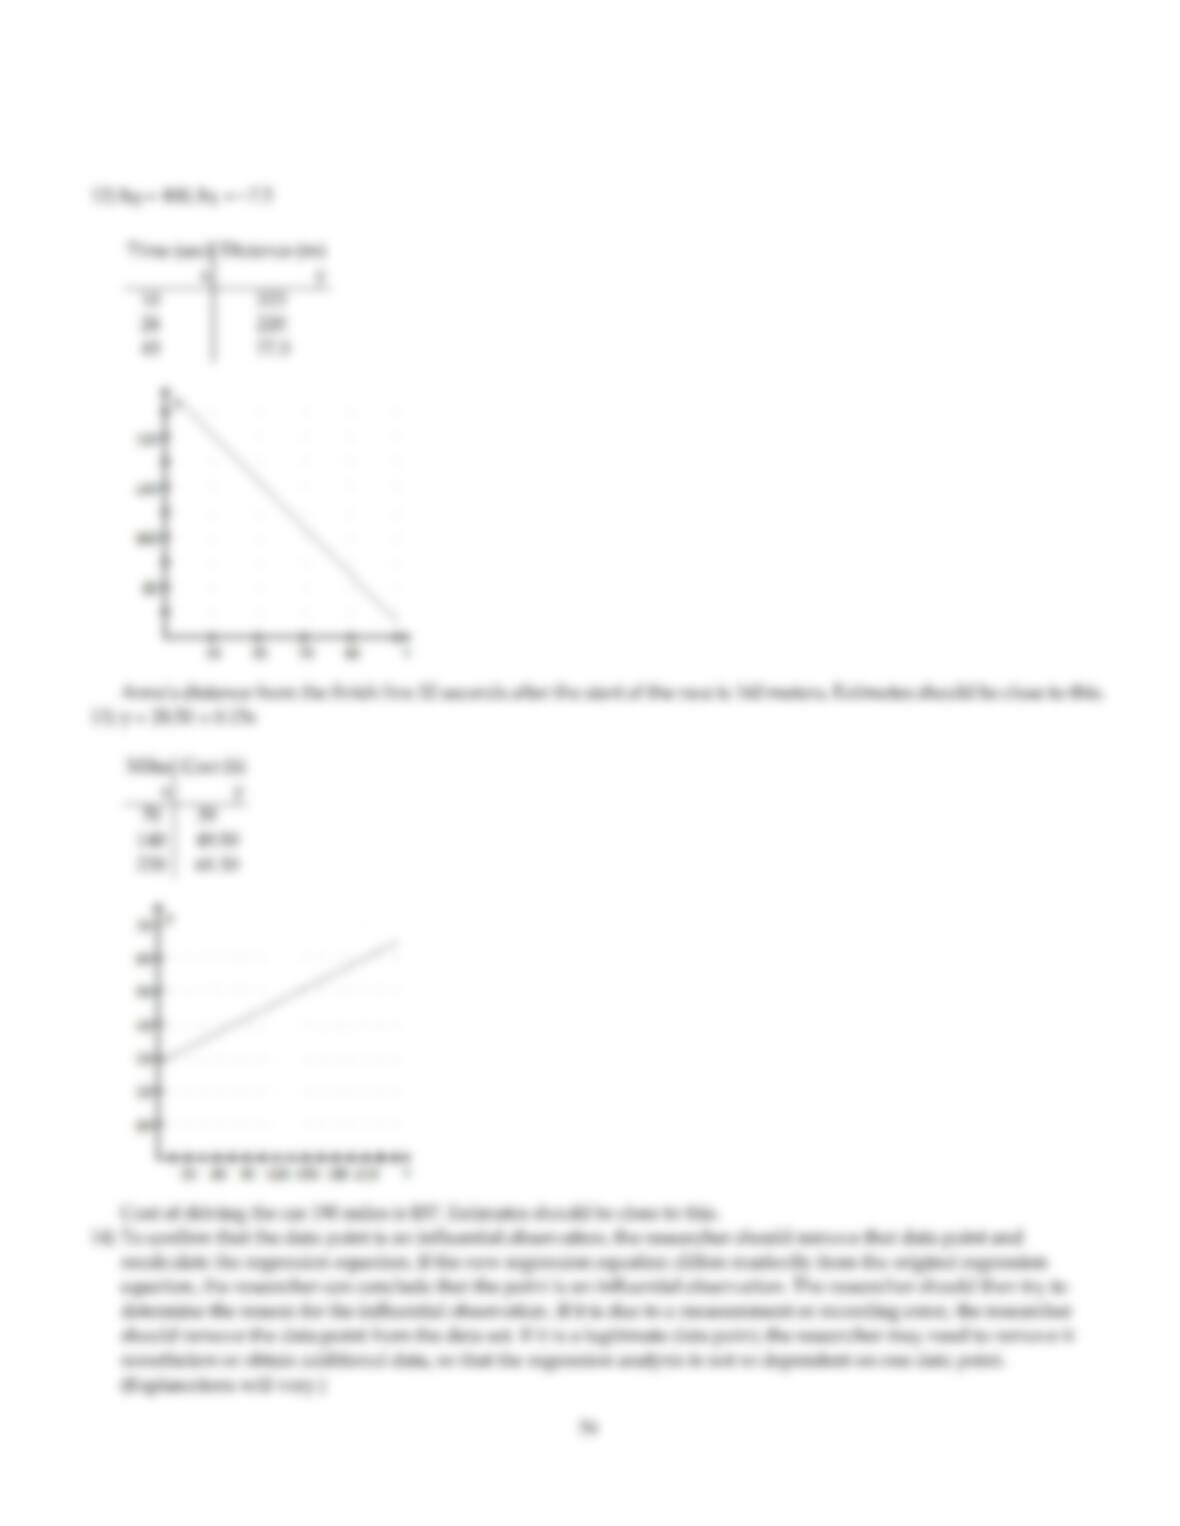
Anne is running a 400–meter race. She runs at a constant speed of 7.5 meters per second. If
you let y denote her distance in meters from the finish line x seconds after the start of the
race, y = 400 – 7.5x. Determine b0 and b1 for this linear equation. Find Anne’s distance
from the finish line 10, 24, and 43 seconds after the race begins. Use these three points to
graph the linear equation y = 400 – 7.5x. Use the graph to estimate visually Anne‘s distance
from the finish line 32 seconds after the start of the race.
12)
6
13)
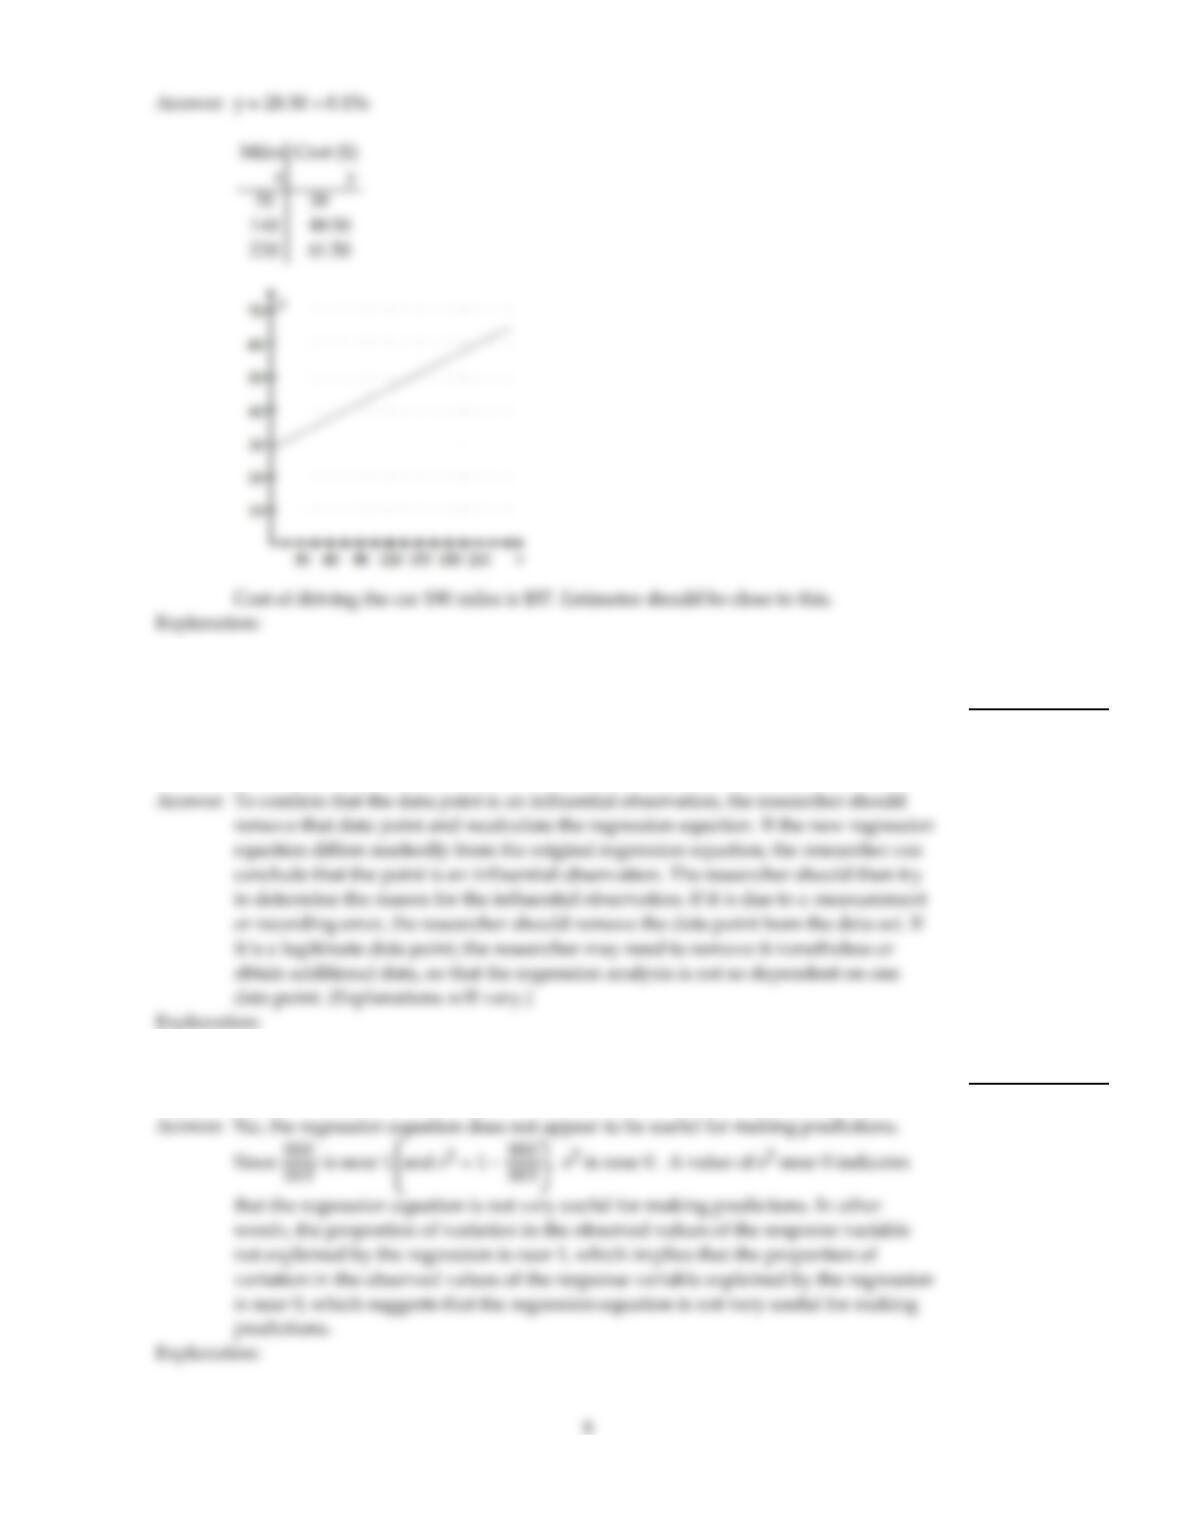
For a compact car, a car–rental company charges $28.50 per day plus $0.15 per mile. For a
one–day rental, let x denote the number of miles driven and let y denote the total cost.
Obtain the equation that expresses y in terms of x. Construct a table of values using the
x–values 70, 140, and 220 miles. Draw the graph of the equation by plotting the points from
the table and connecting them with a straight line. Use the graph to estimate visually the
cost of driving the car 190 miles.
13)
7
Provide an appropriate response.
14)
A regression equation is obtained for a set of data. After examining a scatterplot, the
researcher notices a data point that is potentially an influential observation. How could the
researcher confirm that this data point is indeed an influential observation? How should
the researcher proceed if the data point is found to be an influential observation?
14)
15)
For a particular regression analysis, it is found that SST =905.2 and SSE =843.9. Does the
regression equation appear to be useful for making predictions? How can you tell?
15)
16)
What is the relationship between the linear correlation coefficient and the usefulness of the
regression equation for making predictions?
16)
17)
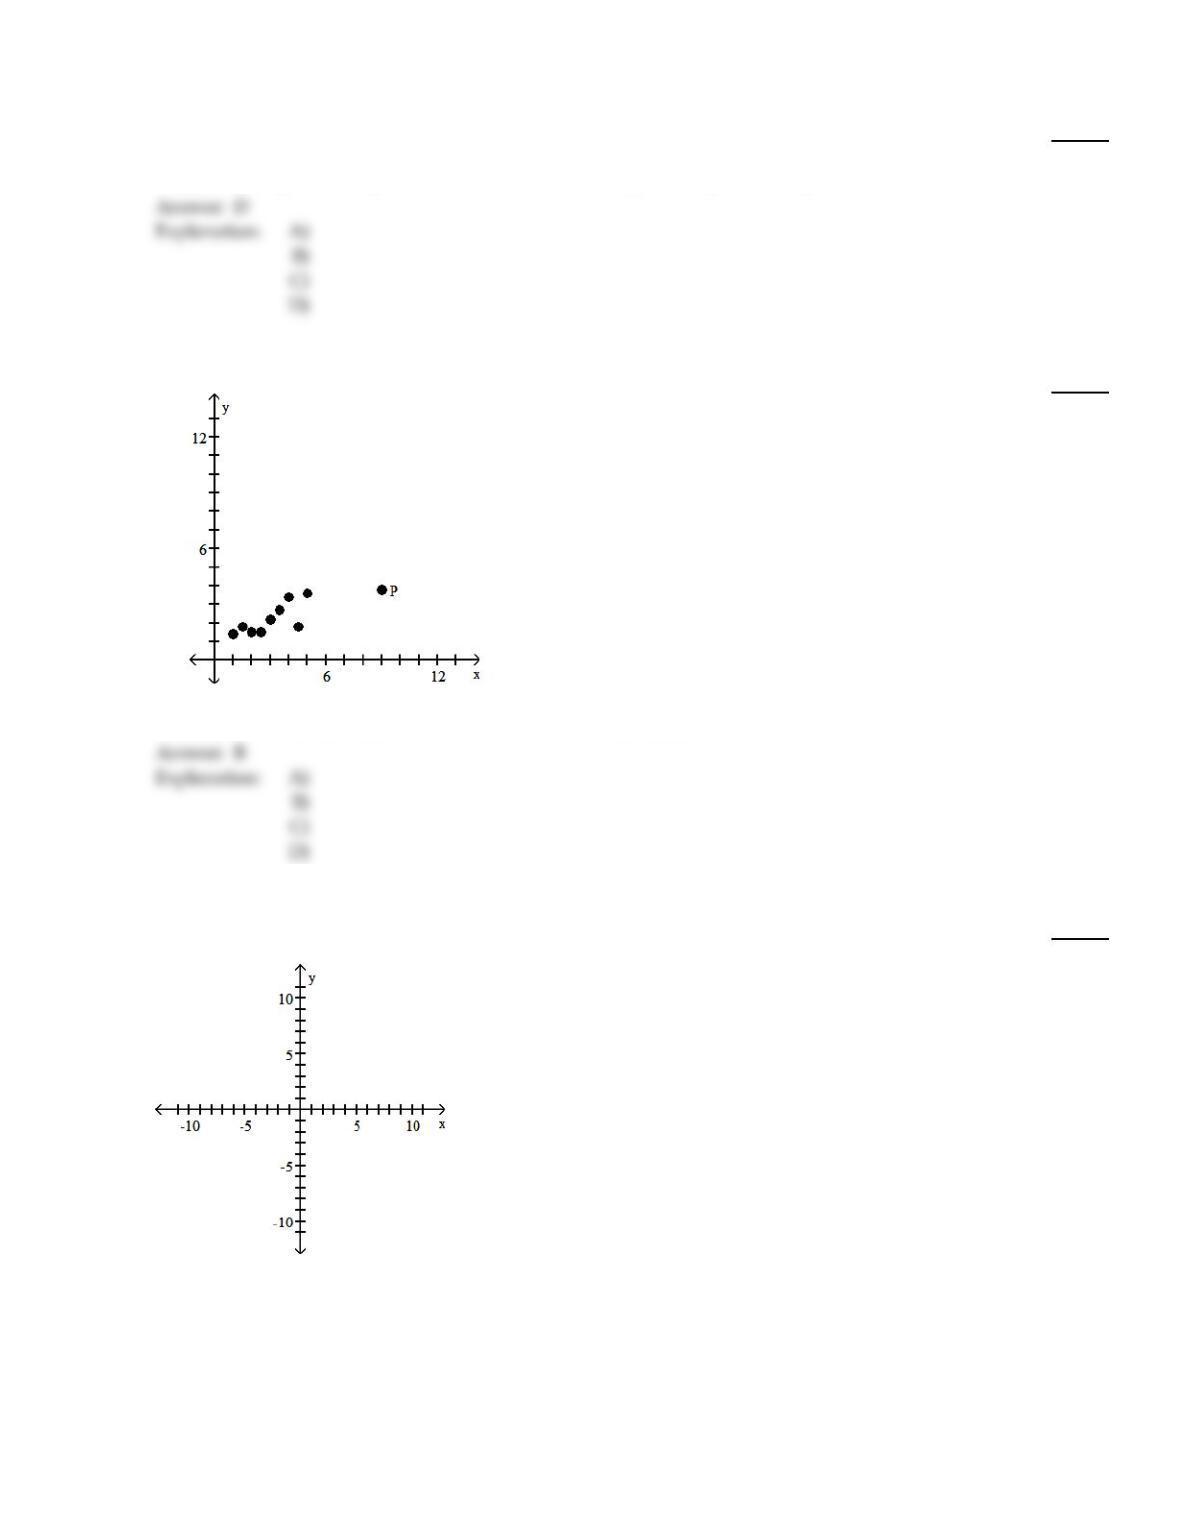
^
For a particular regression analysis, the following regression equation is obtained:
y= 2.12 + 0.56x. Furthermore, the coefficient of determination is 0.05. How useful would
the regression equation be for making predictions? How can you tell?
17)
18)
^
A set of data consists of the number of years that applicants for foreign service jobs have
studied German and the grades that they receive on a proficiency test. The following
regression equation is obtained: y= 31.6 + 10.9x, where x represents the number of years of
study and y represents the grade on the test. What does the slope of the regression line
represent in terms of grade on the test?
18)
19)
Create a scatterplot that shows a perfect positive linear correlation between x and y. How
would the scatterplot change if the correlation showed each of the following?
(a) a strong positive linear correlation;
(b) a weak positive linear correlation;
(c) no linear correlation.
19)
20)
Describe what scatterplots are, and discuss their importance.
20)
21)
Suppose data are collected for each of several randomly selected adults for height, in
inches, and number of calories burned in 30 minutes of walking on a treadmill at 3.5 mph.
How would the value of the linear correlation coefficient, r, change if all of the heights
were converted to meters?
21)
22)
For a certain linear equation, as x increases from 3 to 4, the y–value increases from 17 to 22.
The y–value corresponding to an x–value of 9 is 47. What is the y–value corresponding to
an x–value of 10? Explain how you solved this problem.
22)
23)
Define the terms “predictor variable” and “response variable.” Give an example of each.
23)
24)
Explain why having a high linear correlation does not imply causality. Give an example to
support your answer.
24)
MULTIPLE CHOICE. Choose the one alternative that best completes the statement or answers the question.
Compute the specified sum of squares.
25)
^
The data below consist of test scores (y) and hours of preparation (x) for 5 randomly selected
students. The regression equation is y= 44.8447 + 3.52427x.
x 5 2 9 6 10
y 64 48 72 73 80
SSE
25)
A)
96.1030
B)
511.724
C)
87.4757
D)
599.200
26)
^
The data below consist of test scores (y) and hours of preparation (x) for 5 randomly selected
students. The regression equation is y= 44.8447 + 3.52427x.
x 5 2 9 6 10
y 64 48 72 73 80
SST
26)
A)
599.200
B)
498.103
C)
511.724
D)
87.4757
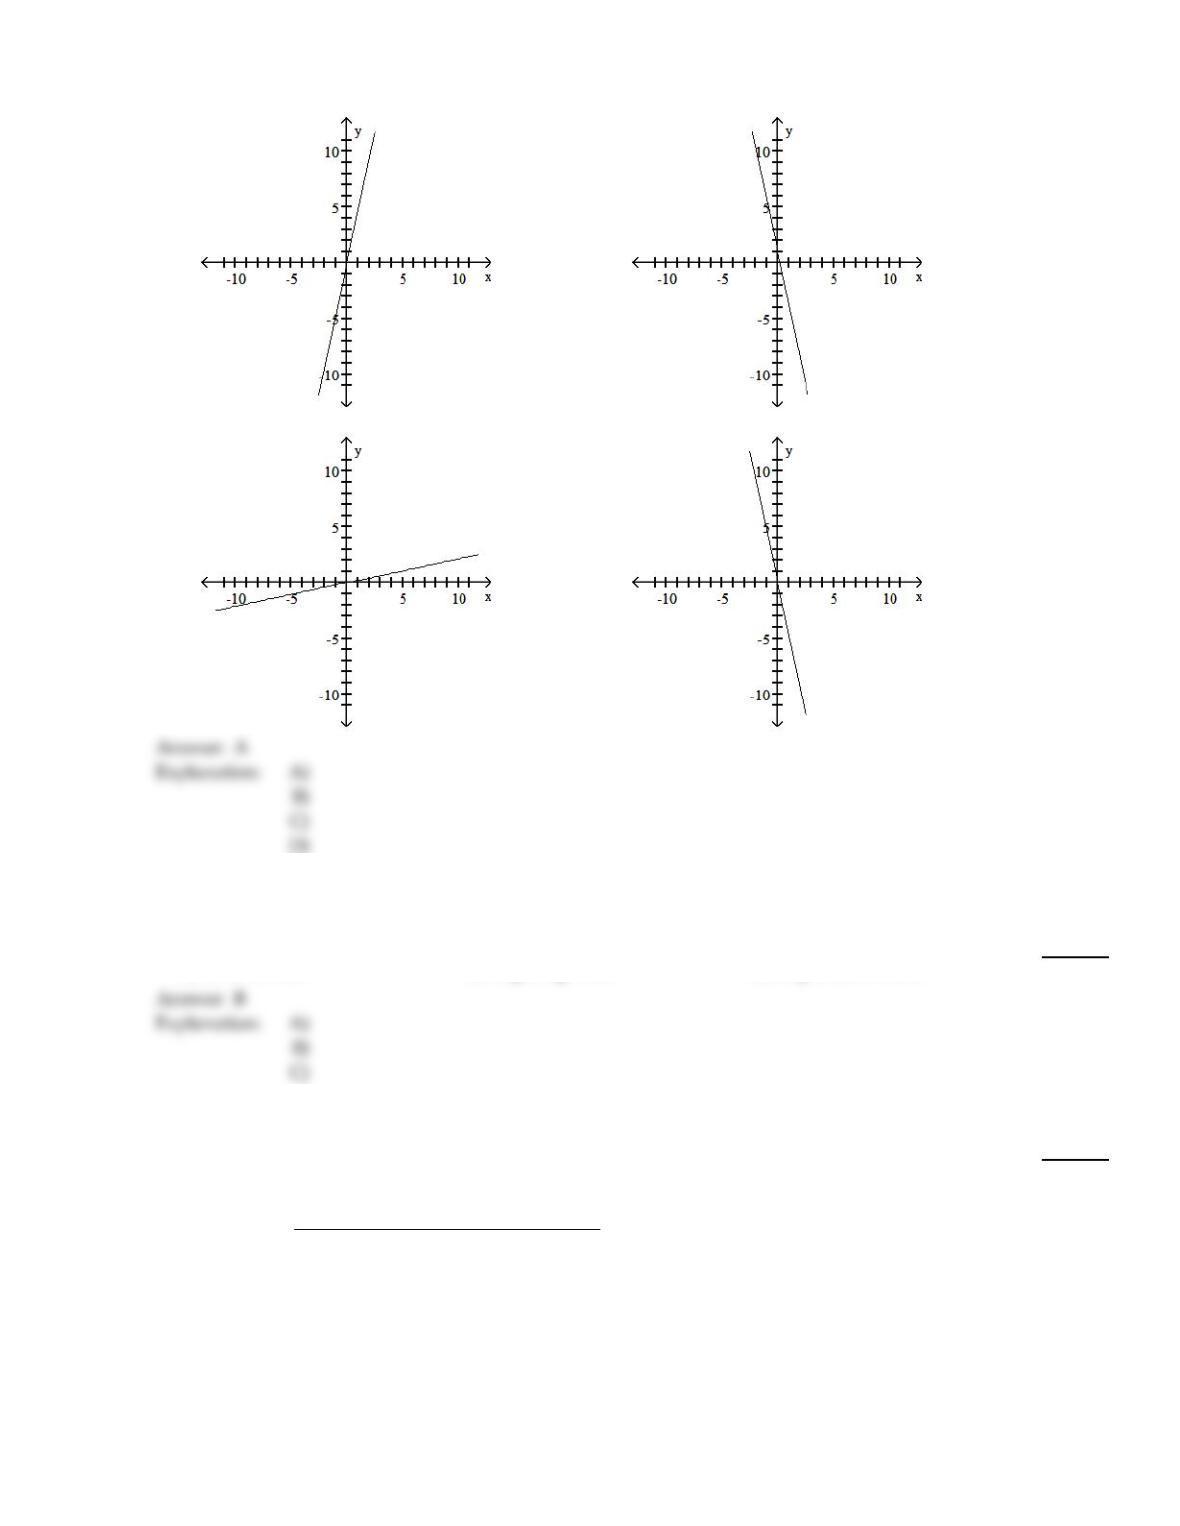
You are given information about a straight line. Use two points to graph the equation.
27)
The equation of the line is y =4.75x.
27)
11
A)
B)
C)
D)
You are given information about a straight line. Determine whether the line slopes upward, slopes downward, or is
horizontal.
28)
The y–intercept is –5.1 and the slope is 4.
28)
A)
Is horizontal
B)
Slopes upward
C)
Slopes downward
Provide an appropriate response.
29)
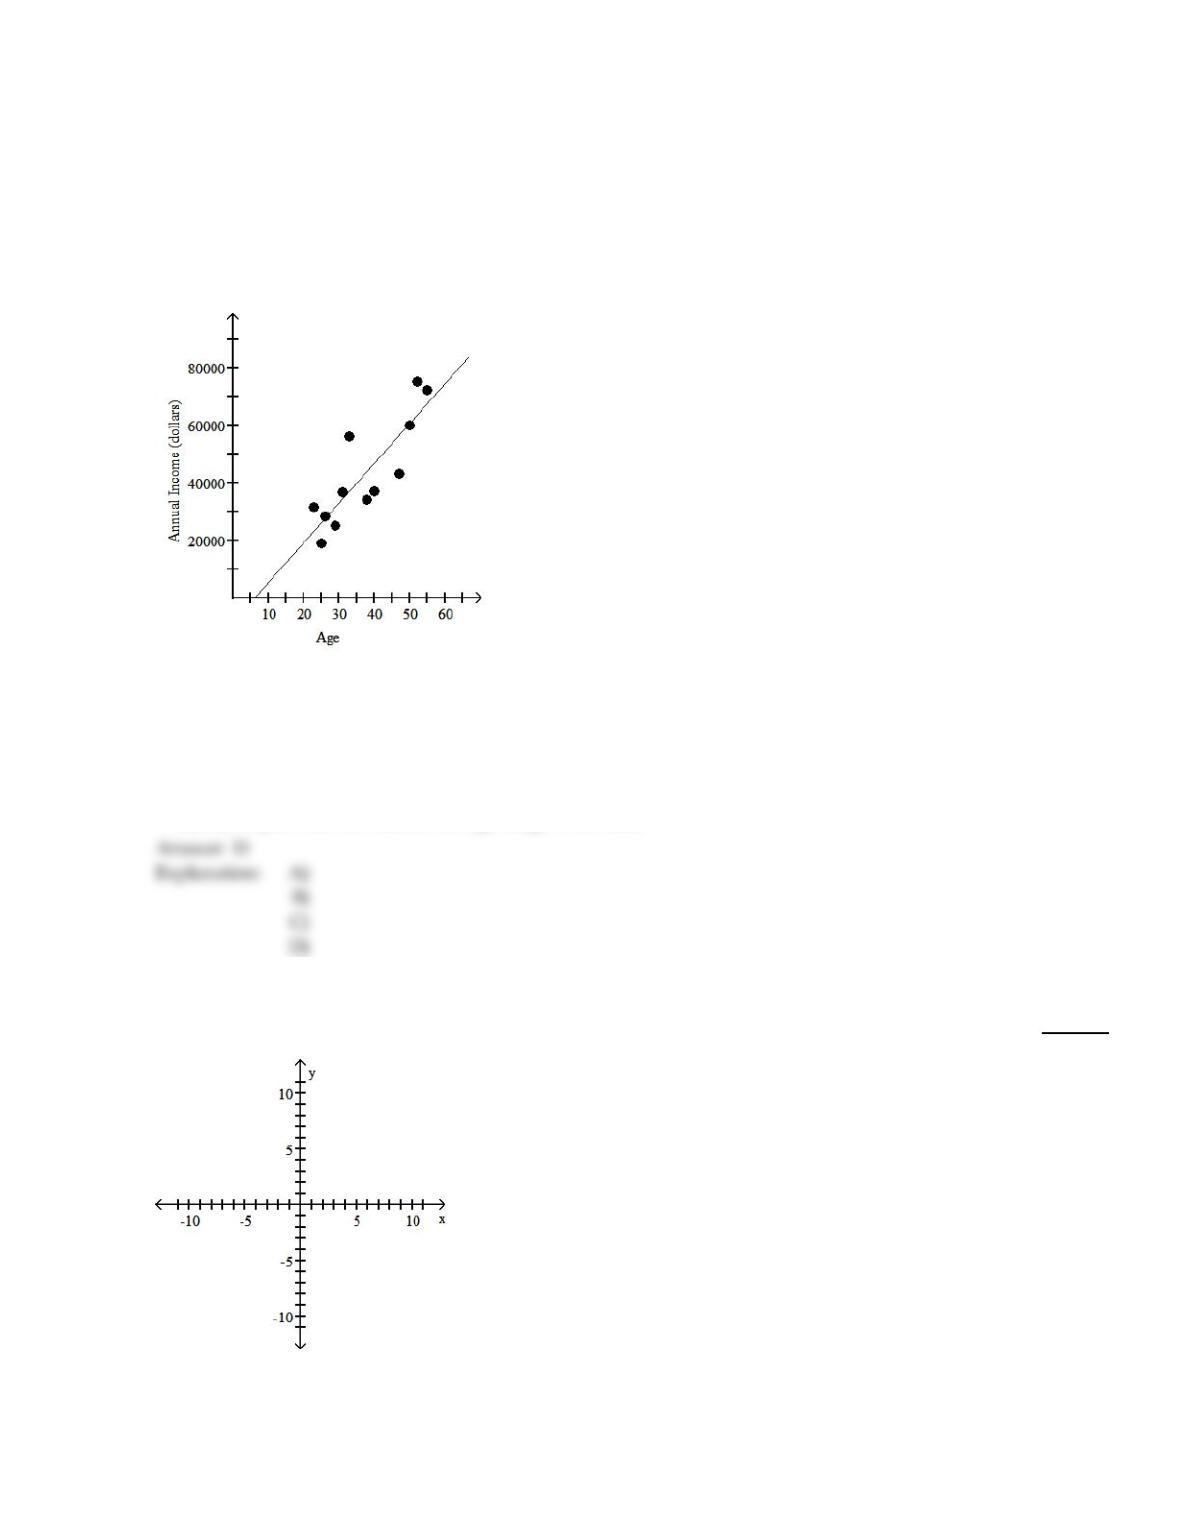
The table below shows the age and annual income of 12 randomly selected college graduates all
living in the city of Seattle.
Age Annual Income (dollars)
26 28,520
31 36,750
55 72,155
47 43,225
38 34,197
50 60,030
29 25,005
29)
12
23 31,625
33 55,975
40 37,064
52 75,082
25 19,055
The scatterplot and regression line are graphed below:
Would it be reasonable to use the regression equation to predict the annual income of a college
graduate in Seattle who is 90 years old? Explain your answer.
A)
Yes; the regression line fits the data quite closely.
B)
No; the regression line does not fit the data very closely.
C)
No; regression equations can not be used to predict values for which there is no input data.
D)
No; 90 year olds are outside the age range of the data.
You are given information about a straight line. Use two points to graph the equation.
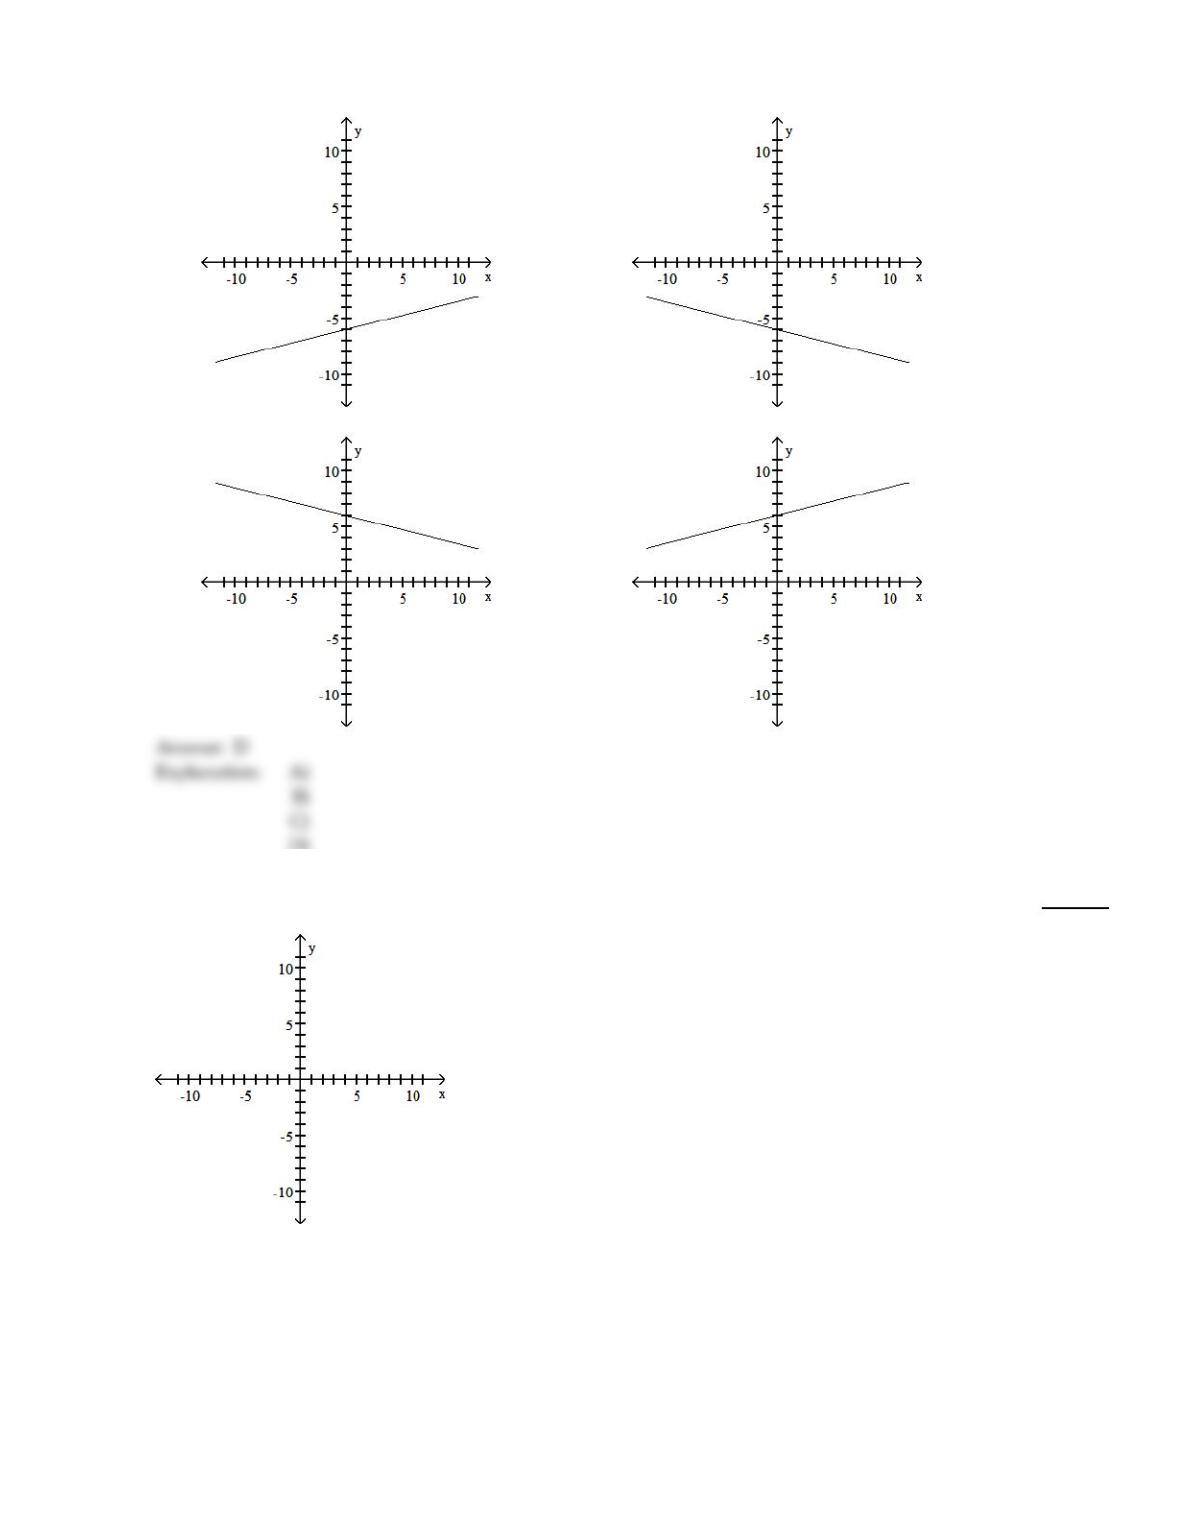
30)
The equation of the line is y =6+ 0.25x.
30)
13
A)
B)
C)
D)
D)
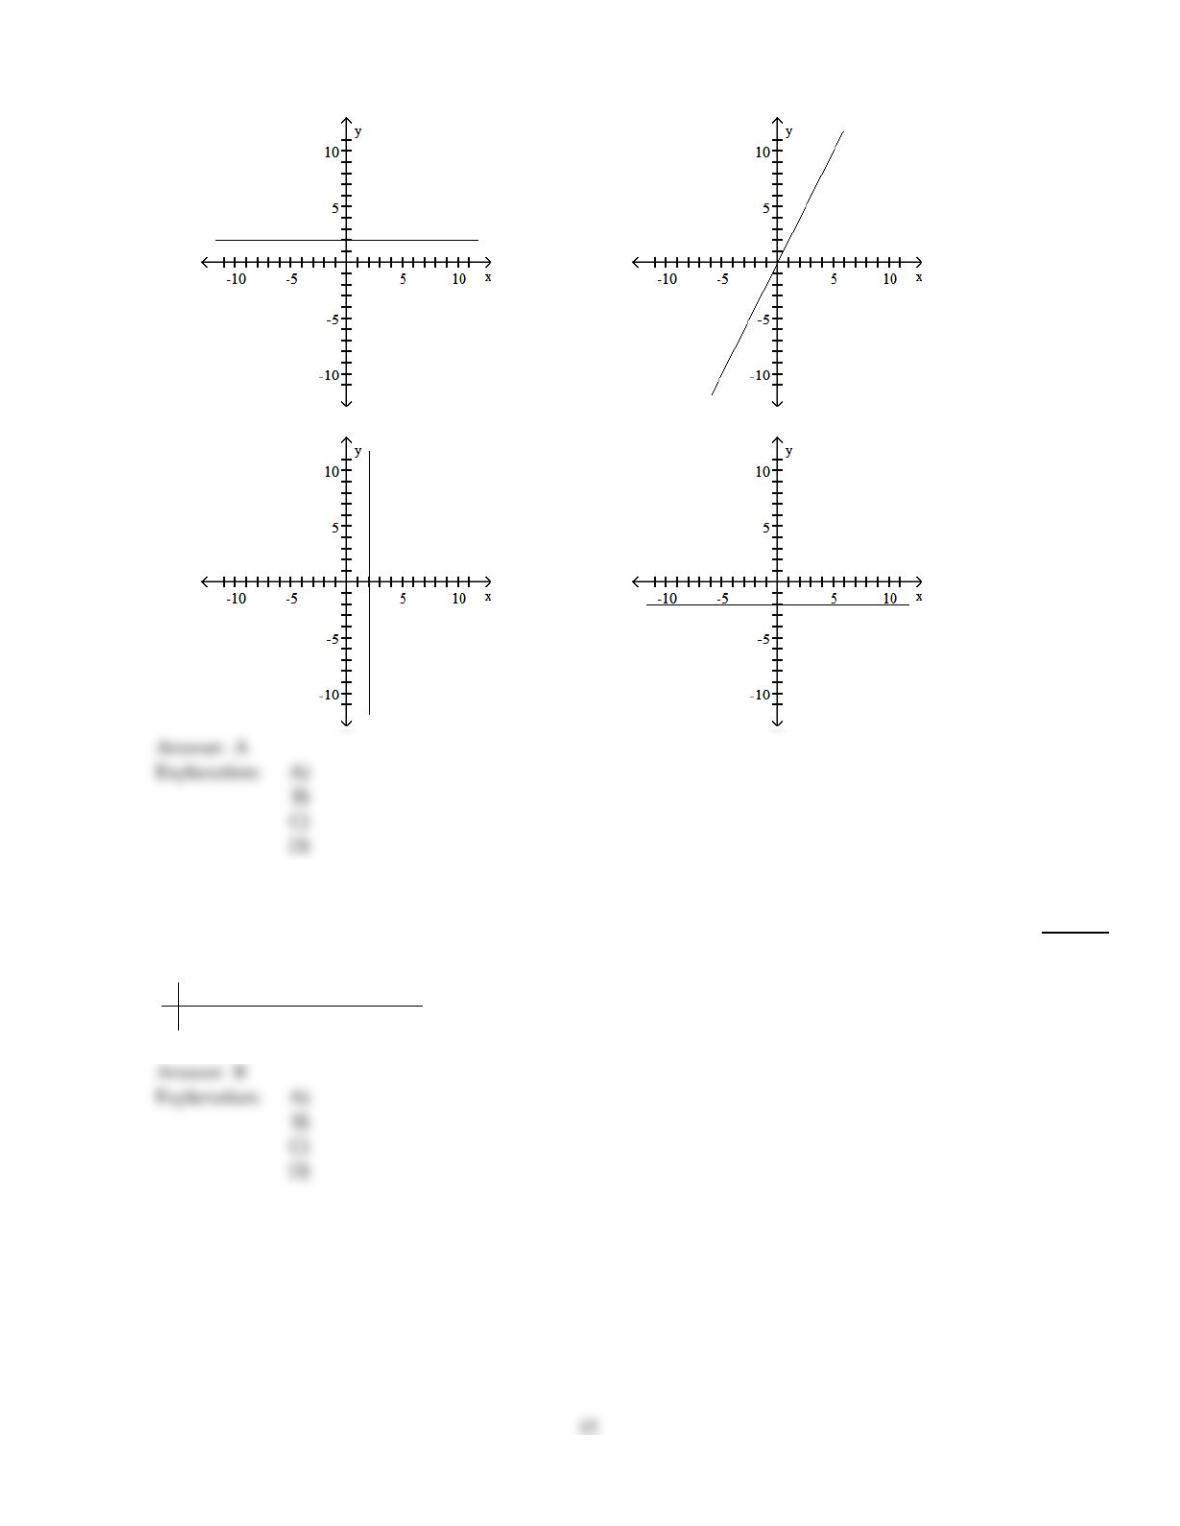
31)
The equation of the line is y =2.
31)
14
A)
B)
C)
D)
Obtain the linear correlation coefficient for the data. Round your answer to three decimal places.
32)
The data below show the cost of advertising (x), in thousands of dollars, and the number of
products sold (y), in thousands, for each of eight randomly selected product lines.
x 9 2 3 4 2 5 9 10
y 85 52 55 68 67 86 83 73
32)
A)
0.246
B)
0.708
C)
–0.071
D)
0.235
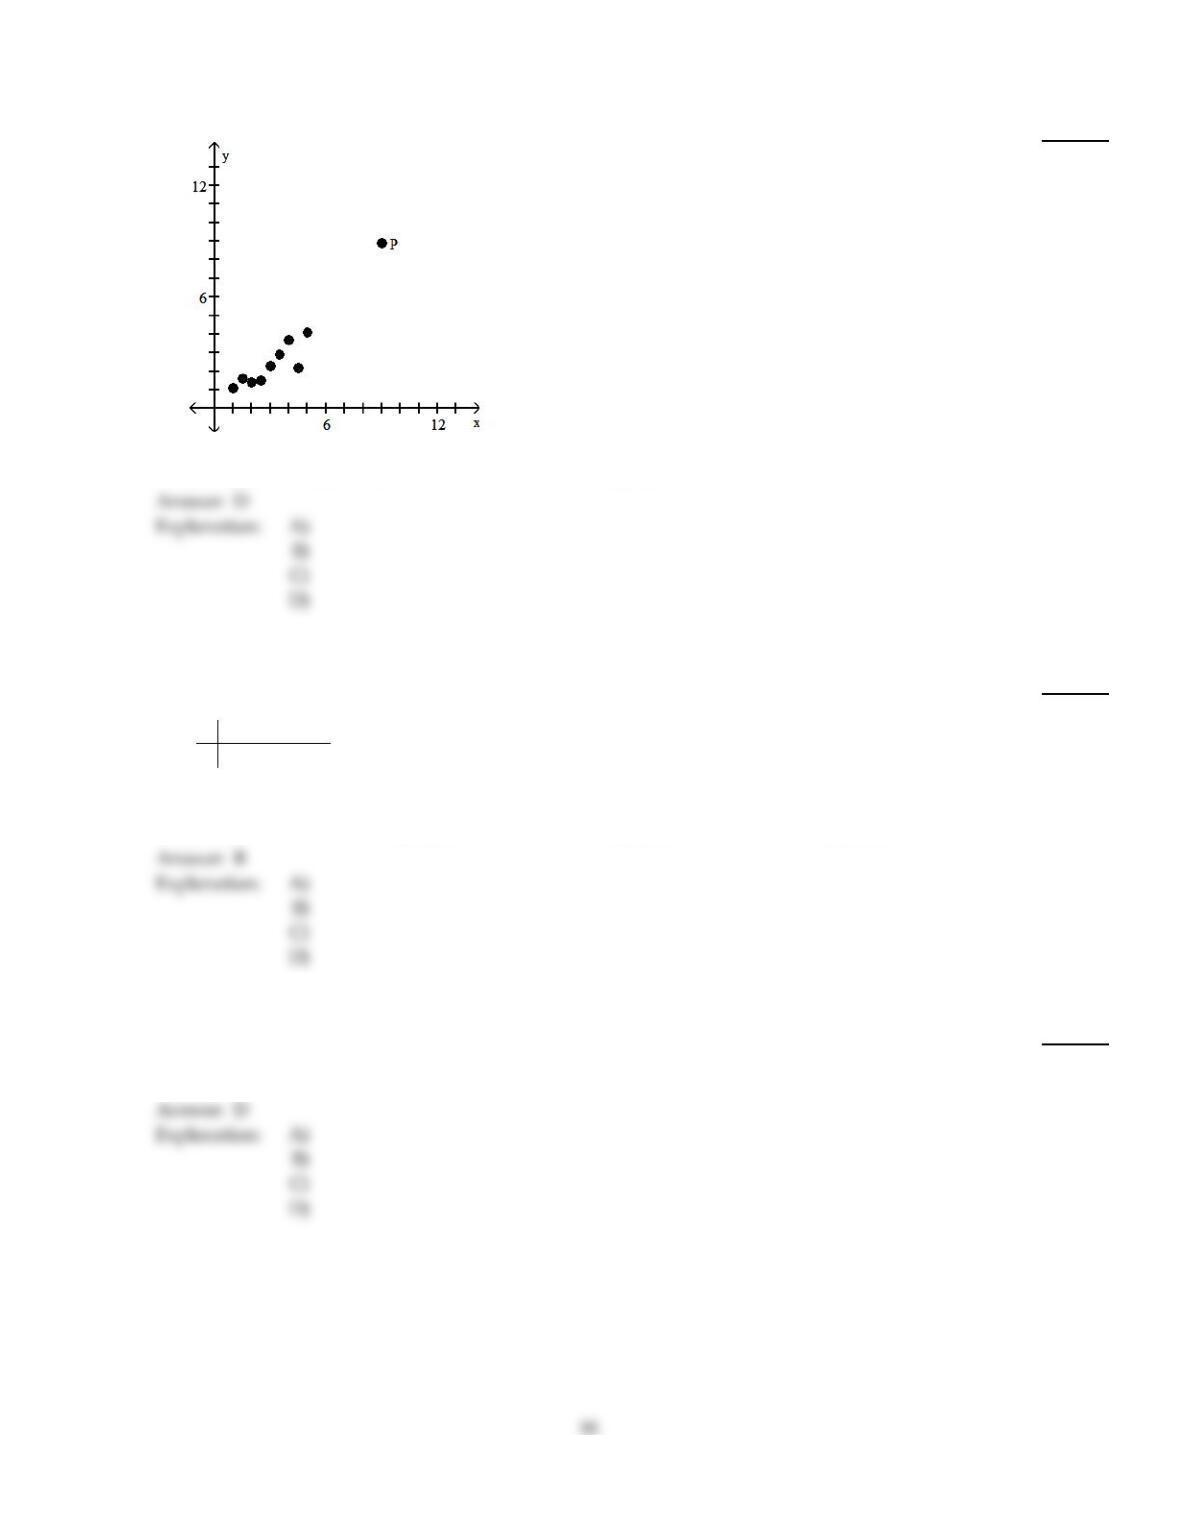
Is the data point, P, an outlier, an influential observation, both, or neither?
33)
33)
A)
Outlier
B)
Neither
C)
Influential Observation
D)
Both
Compute the specified sum of squares.
34)
^
The regression equation for the data below is y= 3.000x.
x 2 4 5 6
y 7 11 13 20
SSR
34)
A)
88.75
B)
78.75
C)
10.00
D)
72.45
B
Determine the y–intercept and slope of the linear equation.
35)
y = –2.5 –13x
35)
A)
y–intercept = –13, slope = –2.5
B)
y–intercept = –2.5, slope =13
C)
y–intercept =2.5, slope =13
D)
y–intercept = –2.5, slope = –13
D
D
Compute the coefficient of determination. Round your answer to four decimal places.
36)
^
The test scores (y) of 6 randomly selected students and the numbers of hours they prepared (x) are
as follows.
x 5 10 4 6 10 9
y 64 86 69 86 59 87
The regression equation is y= 1.06604x + 67.3491.
36)
A)
0.6781
B)
0.2242
C)
–0.2242
D)
0.0503
Obtain the linear correlation coefficient for the data. Round your answer to three decimal places.
37)
Managers rate employees according to job performance (x) and attitude (y). The results for several
randomly selected employees are given below.
x
y 59 63 65 69 58 77 76 69 70 64
72 67 78 82 75 87 92 83 87 78
37)
A)
0.610
B)
0.729
C)
0.916
D)
0.863
D
Determine the y–intercept and slope of the linear equation.
38)
y =9.4x
38)
A)
y–intercept = 0, slope = –9.4
B)
y–intercept =9.4, slope =9.4
C)
y–intercept = 0, slope =9.4
D)
y–intercept =9.4, slope = 0
C
You are given information about a straight line. Determine whether the line slopes upward, slopes downward, or is
horizontal.
39)
The equation of the line is y =4.
39)
A)
Slopes downward
B)
Slopes upward
C)
Is horizontal
C
D
Use the regression equation to predict the y–value corresponding to the given x–value. Round your answer to the nearest
tenth.
40)
^
The regression equation relating dexterity scores (x) and productivity scores (y) for ten randomly
selected employees of a company is y= 5.50 + 1.91x. Predict the productivity score for an employee
whose dexterity score is 21.
40)
A)
56.3
B)
117.4
C)
45.6
D)
58.2
Determine the y–intercept and slope of the linear equation.
41)
y =10x
41)
A)
y–intercept = 0, slope = –10
B)
y–intercept =10, slope = 0
C)
y–intercept = 0, slope =10
D)
y–intercept =10, slope =10
C
Solve the problem.
42)
The paired data below consist of the temperatures on randomly chosen days and the amount a
certain kind of plant grew (in millimeters):
x 62 76 50 51 71 46 51 44 79
y36 39 50 13 33 33 17 616
Find the SST.
42)
A)
1864
B)
243
C)
0
D)
1684
D
Compute the specified sum of squares.
43)
^
The data below consist of heights (x), in meters, and masses (y), in kilograms, of 6 randomly
selected adults. The regression equation is y= –181.342 + 144.46x.
x 1.61 1.72 1.78 1.80 1.67 1.88
y54 62 70 84 61 92
SST
43)
A)
100.06
B)
979.44
C)
1119.3
D)
1079.5
D
C
Determine the y–intercept and slope of the linear equation.
44)
y =9.8 +8.9x
44)
A)
y–intercept =8.9, slope = –9.8
B)
y–intercept =8.9, slope =9.8
C)
y–intercept =9.8, slope =8.9
D)
y–intercept =9.8, slope = –8.9
Solve the problem.
45)
The paired data below consist of the temperatures on randomly chosen days and the amount a
certain kind of plant grew (in millimeters):
x 62 76 50 51 71 46 51 44 79
y36 39 50 13 33 33 17 616
Find the SSE.
45)
A)
1619.672
B)
243
C)
1748.328
D)
242.951
A
Obtain the linear correlation coefficient for the data. Round your answer to three decimal places.
46)
The data below show the test scores (y) of 6 randomly selected students and the number of hours
(x) they studied for the test.
x 5 10 4 6 10 9
y 64 86 69 86 59 87
46)
A)
0.224
B)
–0.224
C)
–0.678
D)
0.678
A
Provide an appropriate response.
47)
True or false? In the context of regression analysis, if the regression sum of squares is large relative
to the error sum of squares, then the regression equation is useful for making predictions.
47)
A)
True
B)
False
A
C
A set of data points and the equations of two lines are given. For each line, determine e2. Then, determine which line
fits the set of data points better, according to the least–squares criterion.
48)
x 0 1 3 3 5
y 7 6 5 4 2
Line A: y = 7.5 – 0.9x
Line B: y = 8.0 – 1.1x
48)
A)
Line A: e2= 2.29
Line B: e2= 2.64
Line B fits the set of data points better.
B)
Line A: e2= 2.29
Line B: e2= 2.64
Line A fits the set of data points better.
C)
Line A: e2= 3.12
Line B: e2= 3.49
Line B fits the set of data points better.
D)
Line A: e2= 0.87
Line B: e2= 0.53
Line B fits the set of data points better.
Solve the problem.
49)
A study was conducted to compare the average time spent in the lab each week versus course
grade for computer students. The results are recorded in the table below.
Number of hours spent in lab Grade (percent)
10 96
11 51
16 62
958
789
15 81
16 46
10 51
Determine the percentage of variation in the observed values of the response variable explained by
the regression..
49)
A)
33.5%
B)
0.335%
C)
0.112%
D)
11.2%
You are given information about a straight line. Determine whether the line slopes upward, slopes downward, or is
horizontal.
50)
The equation of the line is y = –6+3x.
50)
A)
Slopes downward
B)
Slopes upward
C)
Is horizontal
20
A set of data points and the equations of two lines are given. For each line, determine e2. Then, determine which line
fits the set of data points better, according to the least–squares criterion.
51)
x 0 2 4 4 6 7
y 1 4 9 11 14 15
Line A: y = 1.0 + 2.2x
Line B: y = 1.2 + 2.1x
51)
A)
Line A: e2= 6.04
Line B: e2= 5.17
Line A fits the set of data points better.
B)
Line A: e2= 6.04
Line B: e2= 5.17
Line B fits the set of data points better.
C)
Line A: e2= 4.86
Line B: e2= 4.70
Line A fits the set of data points better.
D)
Line A: e2= 4.86
Line B: e2= 4.70
Line B fits the set of data points better.
Determine the y–intercept and slope of the linear equation.
52)
y = –4+ 6x
52)
A)
y–intercept =6, slope =4
B)
y–intercept = –4, slope =6
C)
y–intercept =6, slope = –4
D)
y–intercept =4, slope =6
B
Use the regression equation to predict the y–value corresponding to the given x–value. Round your answer to the nearest
tenth.
53)
^
The regression equation relating attitude rating (x) and job performance rating (y) for ten randomly
selected employees of a company is y= 11.7 + 1.02x. Predict the job performance rating for an
employee whose attitude rating is 66.
53)
A)
77.9
B)
80.1
C)
79.0
D)
12.6
C
Provide an appropriate response.
54)
True or false? Every straight line can be represented by an equation of the form y =b0+b1x.
54)
A)
True
B)
False
B
You are given information about a straight line. Use two points to graph the equation.
21
B
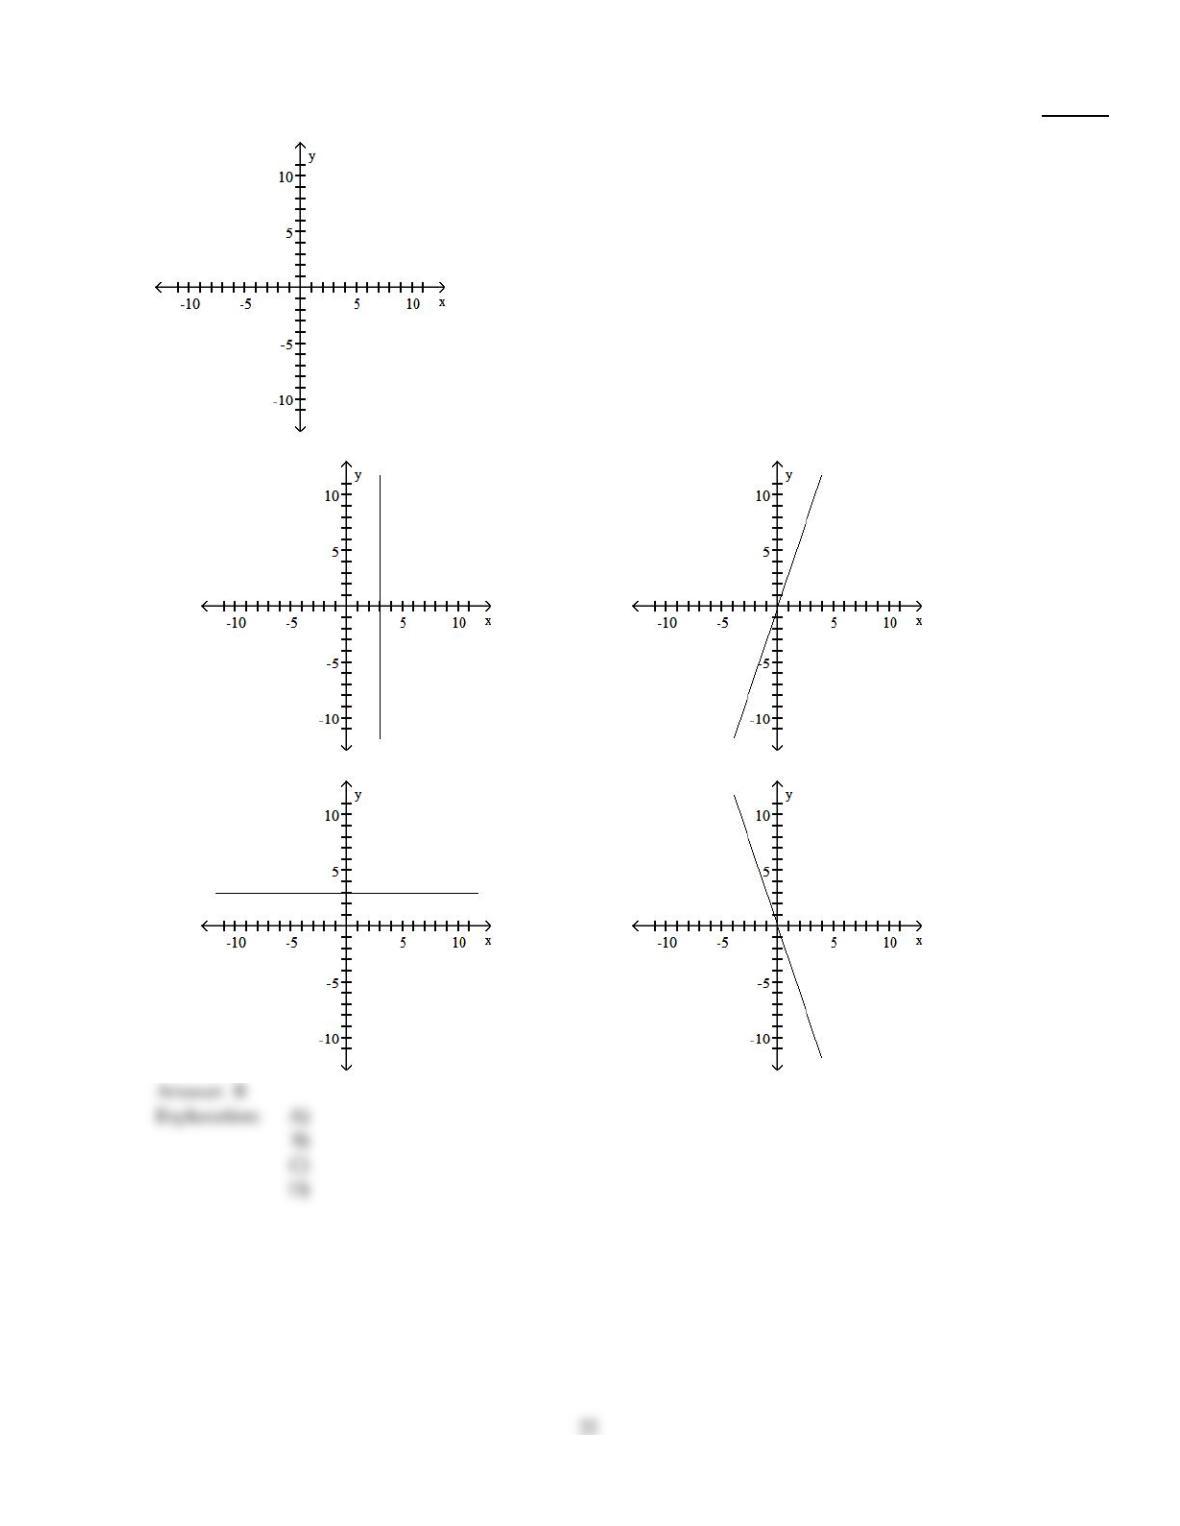
55)
The y–intercept is 0 and the slope is 3.
55)
A)
B)
C)
D)
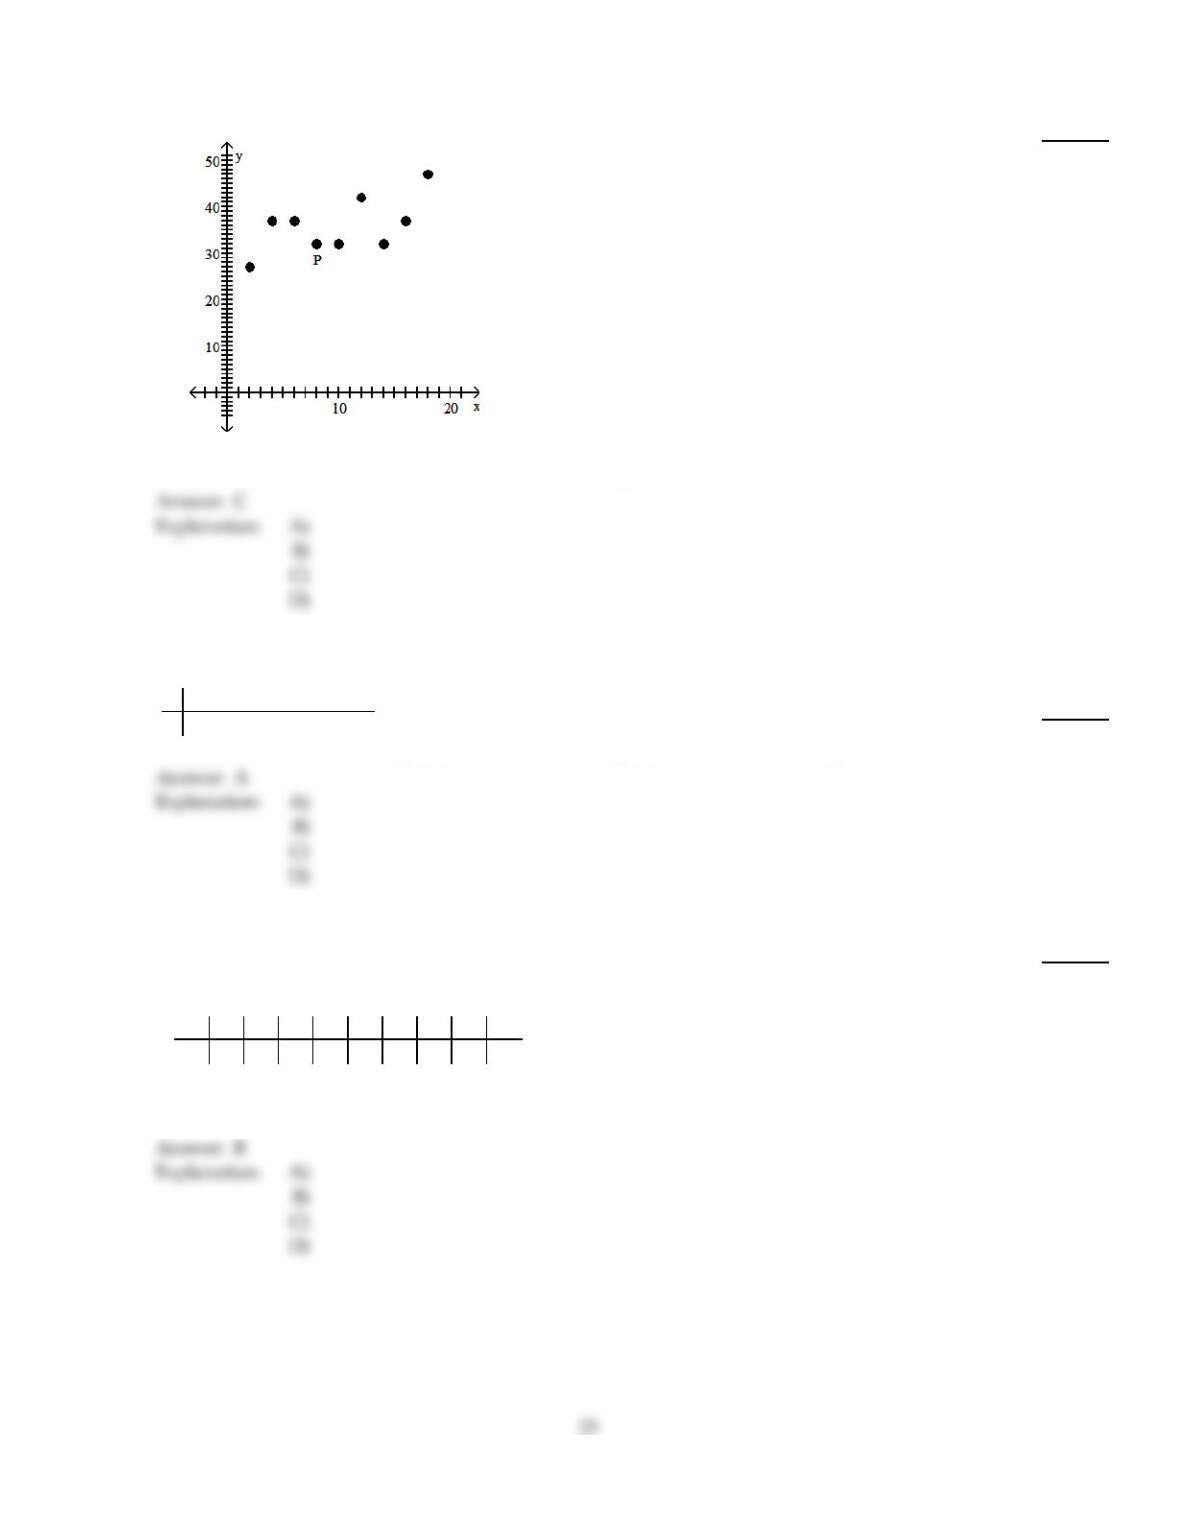
Is the data point, P, an outlier, an influential observation, both, or neither?
56)
56)
A)
Both
B)
Influential observation
C)
Neither
D)
Outlier
Determine the percentage of variation in the observed values of the response variable that is explained by the regression.
Round to the nearest tenth of a percent if needed.
57)
x 5 10 4 6 10 9
y 64 86 69 86 59 87
57)
A)
5.0%
B)
67.8%
C)
22.4%
D)
0%
Determine the regression equation for the data. Round the final values to three significant digits, if necessary.
58)
Two different tests are designed to measure employee productivity (x) and dexterity (y). Several
employees were randomly selected and tested, and the results are given below.
x
y 23 25 28 21 21 25 26 30 34 36
49 53 59 42 47 53 55 63 67 75
58)
A)
^
y= 75.3 – 0.329x
B)
^
y= 5.05 + 1.91x
C)
^
y= 2.36 + 2.03x
D)
^
y= 10.7 + 1.53x
Use the regression equation to predict the y–value corresponding to the given x–value. Round your answer to the nearest
tenth.
59)
^
Eight pairs of data yield the regression equation y= 55.8 + 2.79x. Predict y for x =3.4.
59)
A)
192.5
B)
65.3
C)
57.8
D)
71.1
Provide an appropriate response.
60)
For the linear equation y =9+7x, explain what the y–intercept and slope represent in terms of the
graph of the equation.
60)
A)
The y–intercept, b0=9, gives the y–value at which the straight line y =9+7x intersects the
x–axis. The slope, b1=7, indicates that the x–value increases by 7 units for every increase in y
of 1 unit.
B)
The y–intercept, b0=9, gives the y–value at which the straight line y =9+7x intersects the
y–axis. The slope, b1=7, indicates that the y–value increases by 7 units for every increase in x
of 1 unit.
C)
The y–intercept, b0=7, gives the y–value at which the straight line y =9+7x intersects the
y–axis. The slope, b1=9, indicates that the y–value increases by 9 units for every increase in x
of 1 unit.
D)
The y–intercept, b0=9, gives the y–value at which the straight line y =9+7x intersects the
y–axis. The slope, b1=7, indicates that the x–value increases by 7 units for every increase in y
of 1 unit.
61)
True or false? In the context of regression analysis, the coefficient of determination is the proportion
of variation in the observed values of the response variable not explained by the regression
61)
A)
True
B)
False
Determine the regression equation for the data. Round the final values to three significant digits, if necessary.
62)
x 0 3 4 5 12
y 8 2 6 9 12
62)
A)
^
y= 4.88 + 0.625x
B)
^
y= 4.98 + 0.725x
C)
^
y= 4.98 + 0.425x
D)
^
y= 4.88 + 0.525x
Compute the specified sum of squares.
63)
^
The regression equation for the data below is y= 3.000x.
x 2 4 5 6
y 7 11 13 20
SSE
63)
A)
78.75
B)
14.25
C)
10.00
D)
88.75
Compute the coefficient of determination. Round your answer to four decimal places.
64)
For a particular regression analysis, it is found that SST =982.0 and SSE =301.0.
64)
A)
0.3065
B)
0.8328
C)
0.6935
D)
3.2625
Provide an appropriate response.
65)
^
For a particular regression analysis, the following regression equation is obtained: y= 8.3x + 32,
where x represents the number of hours studied for a test and y represents the score on the test.
True or false? If the coefficient of determination is 0.976, the number of hours studied is very useful
for predicting the test score.
65)
A)
True
B)
False
25
Solve the problem.
66)
A study was conducted to compare the average time spent in the lab each week versus course
grade for computer students. The results are recorded in the table below.
Number of hours spent in lab Grade (percent)
10 96
11 51
16 62
958
789
15 81
16 46
10 51
State how useful the regression equation appears to be for making predictions.
66)
A)
Extremely useful
B)
Moderately useful
C)
Not very useful
D)
Not enough information
Obtain the linear correlation coefficient for the data. Round your answer to three decimal places.
67)
x 62 53 64 52 52 54 58
y 158 176 151 164 164 174 162
67)
A)
–0.081
B)
–0.775
C)
0.507
D)
0.754
B
The regression equation for the given data points is provided. Graph the regression equation and the data points.
68)
^
x 2 4 5 6
y 7 11 13 20
y= 3.0x
68)
26
C
A)
B)
C)
D)
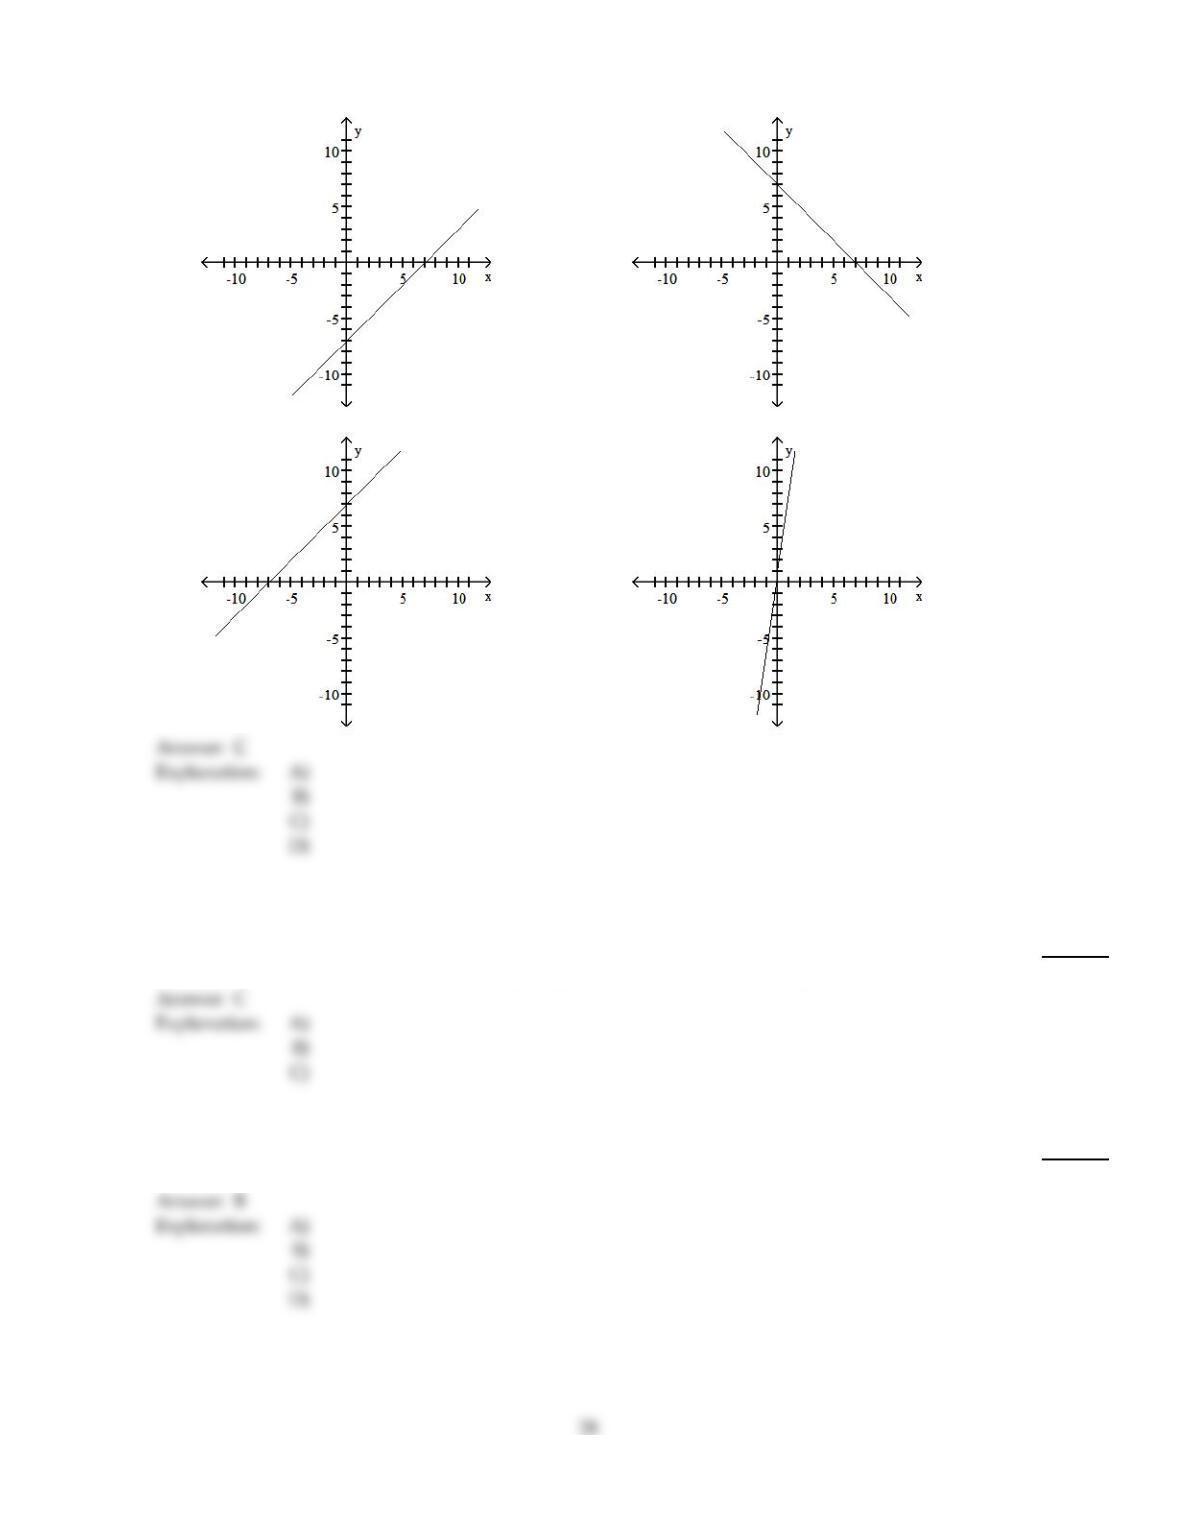
You are given information about a straight line. Use two points to graph the equation.
69)
The y–intercept is 7 and the slope is 1.
69)
27
A)
B)
C)
D)
You are given information about a straight line. Determine whether the line slopes upward, slopes downward, or is
horizontal.
70)
The equation of the line is y =8.56 – x.
70)
A)
Is horizontal
B)
Slopes upward
C)
Slopes downward
The y–intercept and slope, respectively, of a straight line are given. Find the equation of the line.
71)
–2.7 and 0.1
71)
A)
y = –2.7x +0.1
B)
y = –2.7 +0.1x
C)
y +0.1x = –2.7
D)
y =2.7 +0.1x
Determine the regression equation for the data. Round the final values to three significant digits, if necessary.
72)
x 1 3 5 7 9
y 143 116 100 98 90
72)
A)
^
y= 151 – 6.8x
B)
^
y= –151 + 6.8x
C)
^
y= –140 + 6.2x
D)
^
y= 140 – 6.2x
Determine the y–intercept and slope of the linear equation.
73)
y =13 –10x
73)
A)
y–intercept = –10, slope =13
B)
y–intercept =10, slope =13
C)
y–intercept =13, slope =10
D)
y–intercept =13, slope = –10
D
Compute the specified sum of squares.
74)
^
The data below consist of test scores (y) and hours of preparation (x) for 5 randomly selected
students. The regression equation is y= 44.8447 + 3.52427x.
x 5 2 9 6 10
y 64 48 72 73 80
SSR
74)
A)
511.724
B)
599.200
C)
498.103
D)
87.4757
A
The regression equation for the given data points is provided. Graph the regression equation and the data points.
29
D
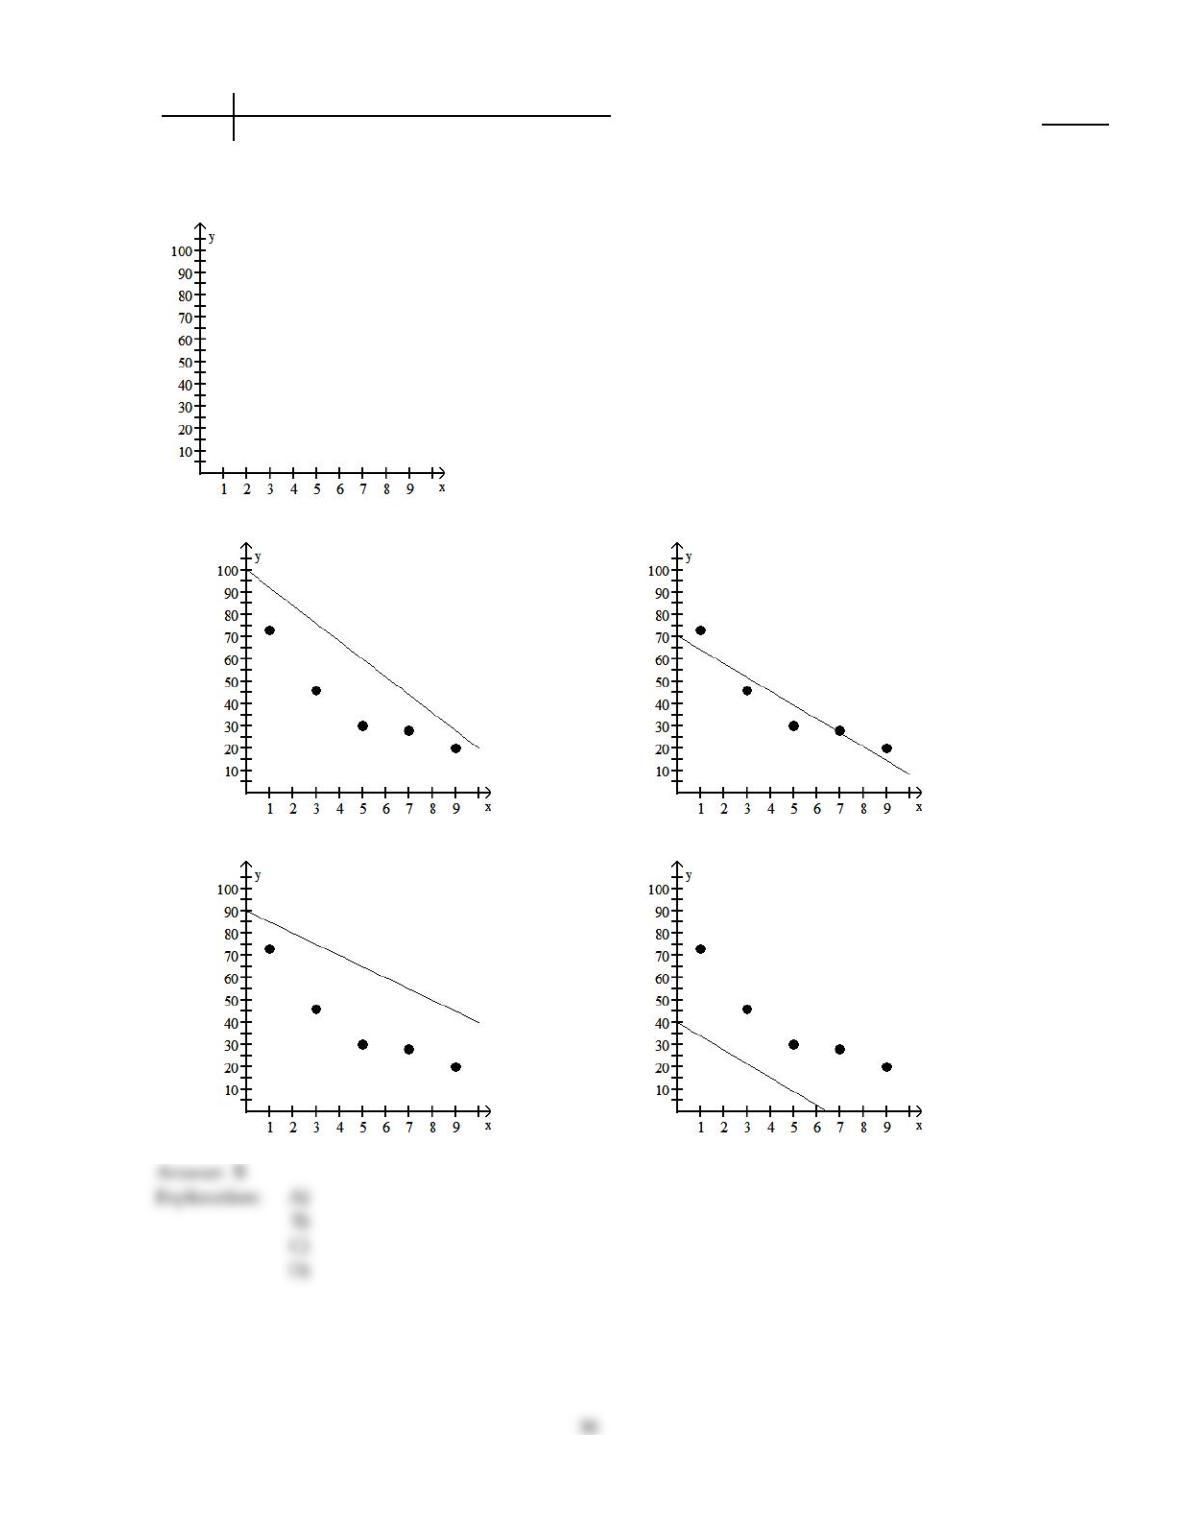
75)
^
x 1 3 5 7 9
y73 46 30 28 20
y= 70.4 – 6.2x
75)
A)
B)
C)
D)
Determine the regression equation for the data. Round the final values to three significant digits, if necessary.
76)
Managers rate employees according to job performance (x) and attitude (y). The results for several
randomly selected employees are given below.
x
y 59 63 65 69 58 77 76 69 70 64
72 67 78 82 75 87 92 83 87 78
76)
A)
^
y= 11.7 + 1.02x
B)
^
y= 92.3 – 0.669x
C)
^
y= 2.81 + 1.35x
D)
^
y= –47.3 + 2.02x
You are given information about a straight line. Determine whether the line slopes upward, slopes downward, or is
horizontal.
77)
The equation of the line is y =6–9x.
77)
A)
Slopes upward
B)
Slopes downward
C)
Is horizontal
The y–intercept and slope, respectively, of a straight line are given. Find the equation of the line.
78)
0 and –9.5
78)
A)
y = –9.5x
B)
y =9.5x
C)
y = –9.5
D)
y =9.5
Compute the specified sum of squares.
79)
^
The regression equation for the data below is y= 3.000x.
x 2 4 5 6
y 7 11 13 20
SST
79)
A)
78.75
B)
88.75
C)
92.25
D)
10.00
Provide an appropriate response.
80)
True or false? In the context of regression analysis, the regression sum of squares is the variation in
the observed values of the response variable explained by the regression.
80)
A)
True
B)
False
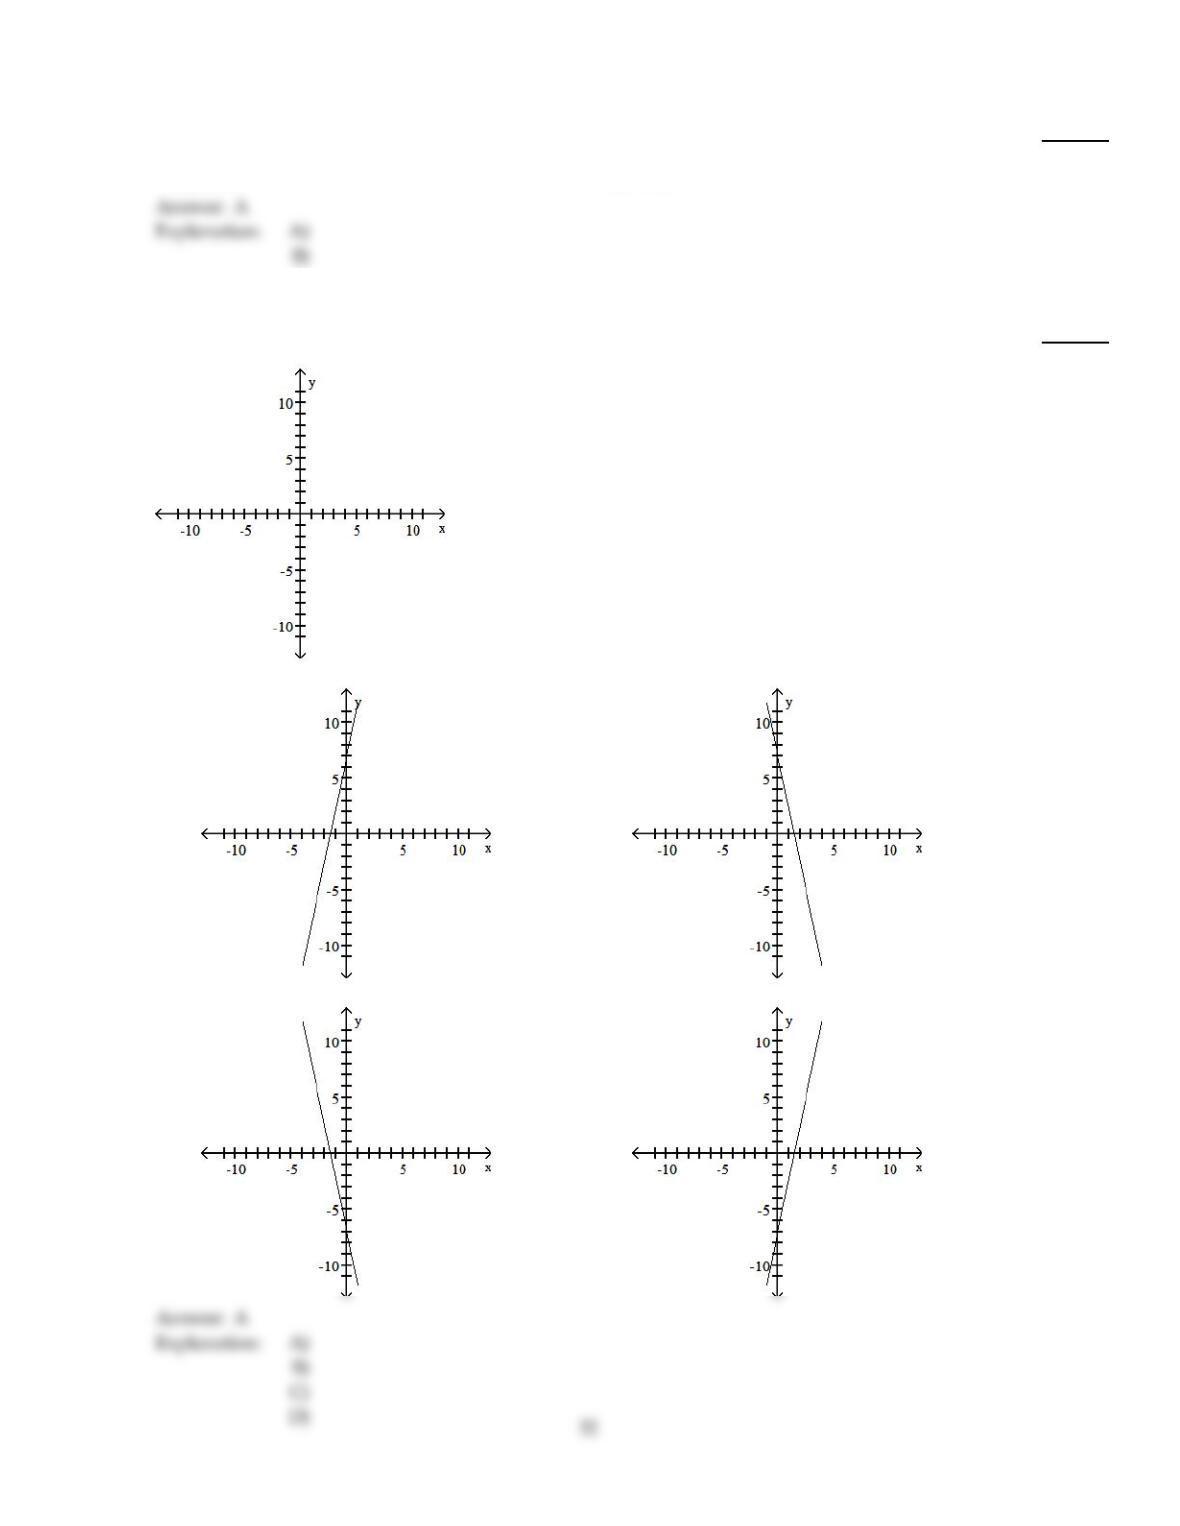
You are given information about a straight line. Use two points to graph the equation.
81)
The equation of the line is y =7+ 4.75x.
81)
A)
B)
C)
D)
D)
Compute the coefficient of determination. Round your answer to four decimal places.
82)
A regression equation is obtained for a set of data points. It is found that the total sum of squares is
23.842, the regression sum of squares is 15.083, and the error sum of squares is 8.759.
82)
A)
0.3674
B)
1.5807
C)
0.6326
D)
0.5807
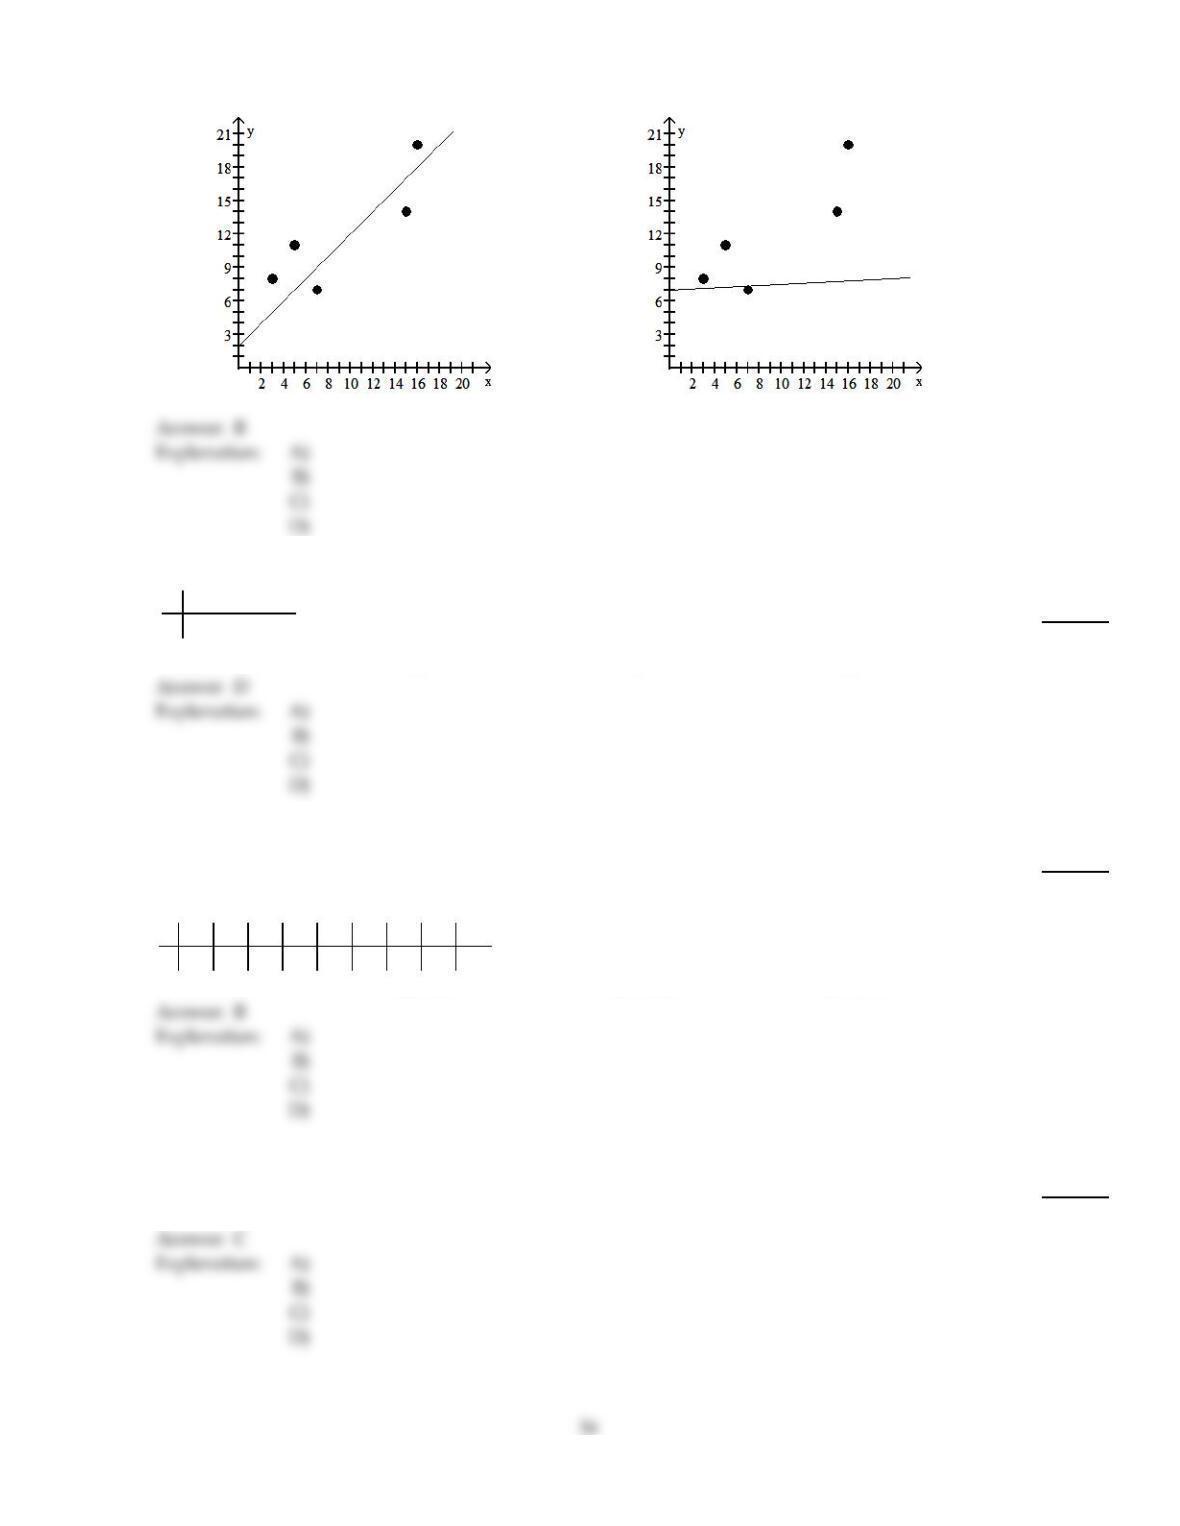
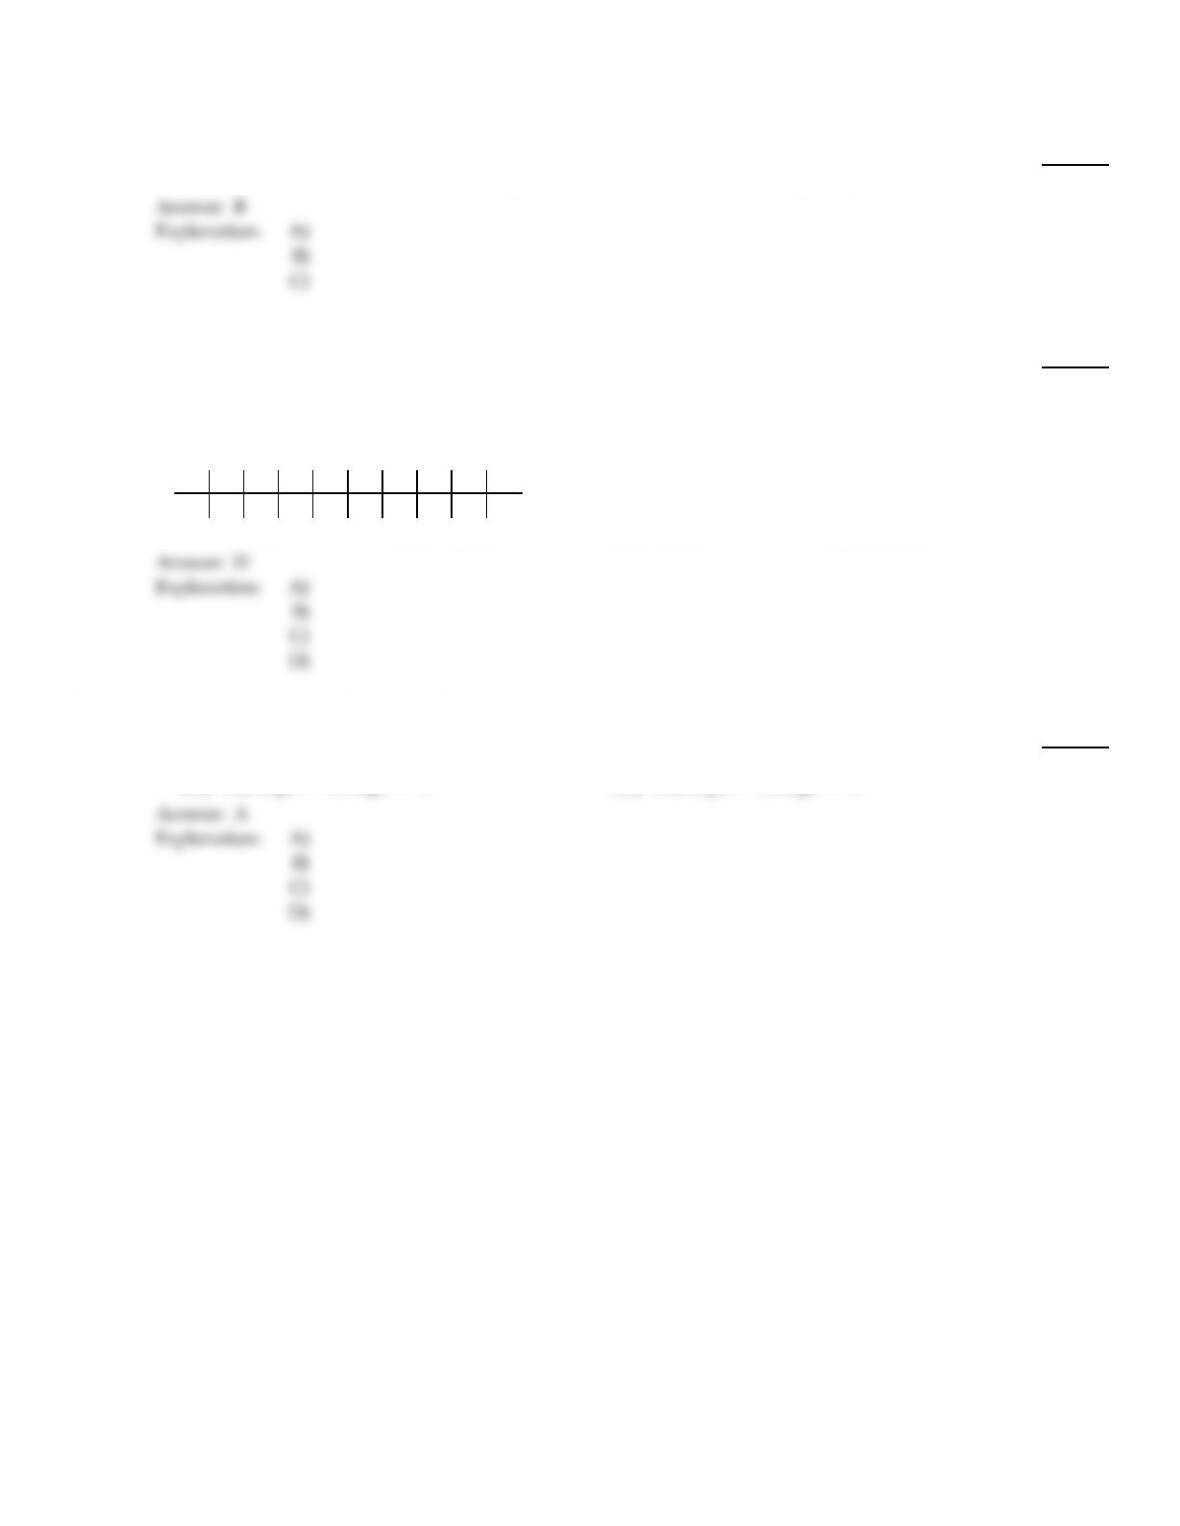
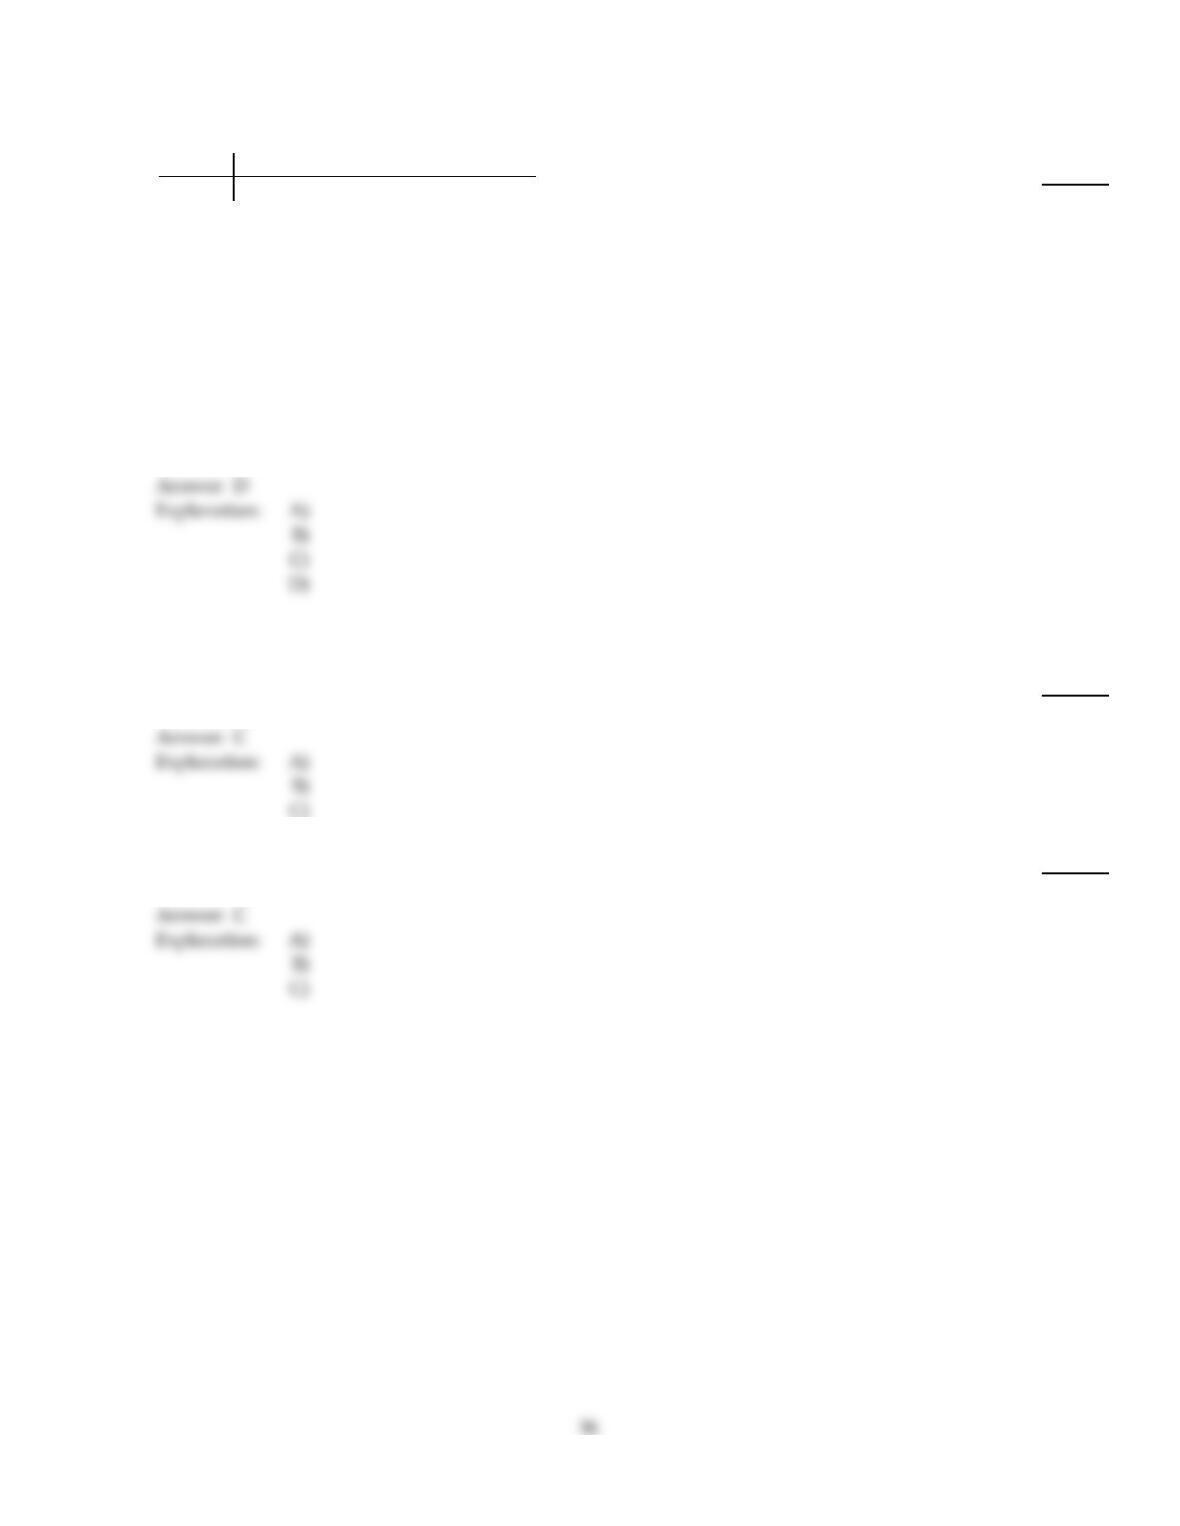
The regression equation for the given data points is provided. Graph the regression equation and the data points.
83)
^
x 3 5 7 15 16
y 8 11 714 20
y= 5.1 + 0.75x
83)
A)
B)
33
D)
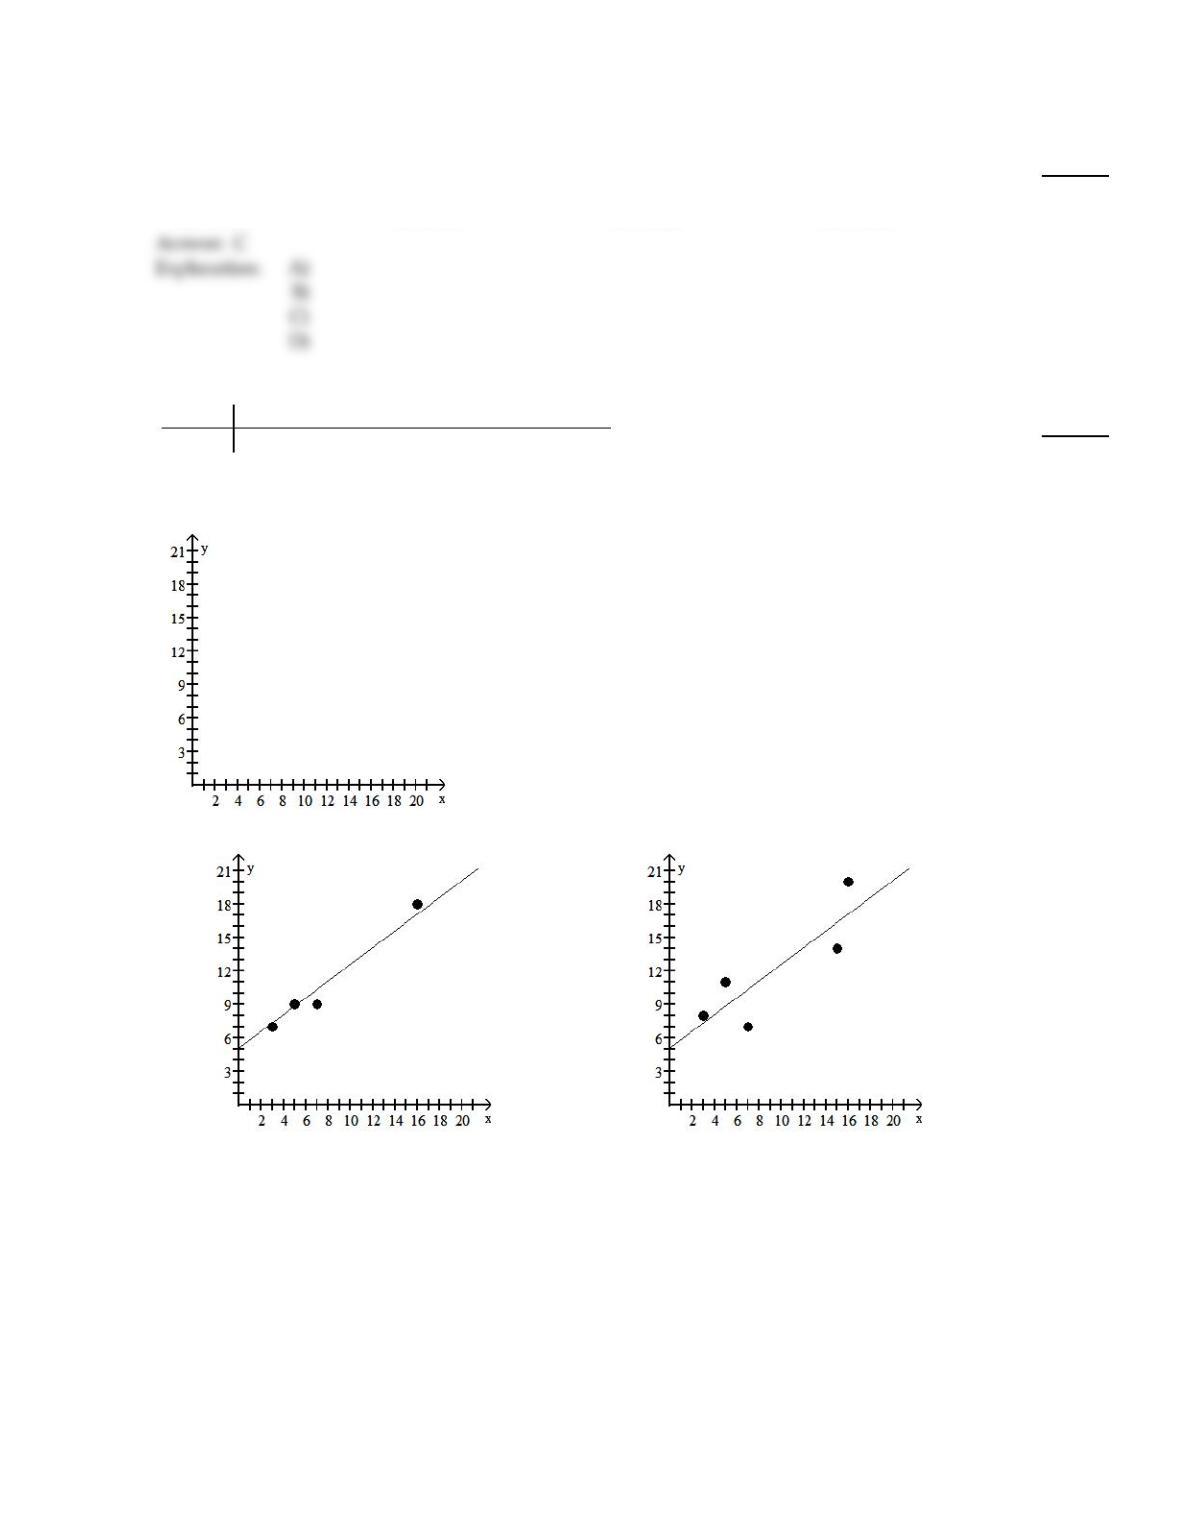
C)
D)
Determine the regression equation for the data. Round the final values to three significant digits, if necessary.
84)
x 2 4 5 6
y 7 11 13 20
84)
A)
^
y= 2.8x
B)
^
y= 0.15 + 2.8x
C)
^
y= 0.15 + 3x
D)
^
y= 3x
Obtain the linear correlation coefficient for the data. Round your answer to three decimal places.
85)
Two separate tests, x and y, are designed to measure a student’s ability to solve problems. Several
students are randomly selected to take both tests and their results are shown below.
x 48 52 58 44 43 43 40 51 59
y73 67 73 59 58 56 58 64 74
85)
A)
0.109
B)
0.867
C)
0.548
D)
0.714
The y–intercept and slope, respectively, of a straight line are given. Find the equation of the line.
86)
–8 and –9
86)
A)
y – 9x = –8
B)
y = –8x – 9
C)
y = –8– 9x
D)
y = –8+ 9x
You are given information about a straight line. Determine whether the line slopes upward, slopes downward, or is
horizontal.
87)
The equation of the line is y = –4.7x.
87)
A)
Is horizontal
B)
Slopes downward
C)
Slopes upward
Obtain the linear correlation coefficient for the data. Round your answer to three decimal places.
88)
Two different tests are designed to measure employee productivity (x) and dexterity (y). Several
employees are randomly selected and tested with these results. Calculate the linear correlation
coefficient r. Can you conclude from the value of r alone that the variables x and y are linearly
related?
x
y 23 25 28 21 21 25 26 30 34 36
49 53 59 42 47 53 55 63 67 75
88)
A)
0.986; Yes
B)
0.972;Yes
C)
0.972 No
D)
0.986; No
D
Determine the y–intercept and slope of the linear equation.
89)
y =3+4x
89)
A)
y–intercept =3, slope =4
B)
y–intercept =4, slope =3
C)
y–intercept = –4, slope = –3
D)
y–intercept = –3, slope = –4
A
35
B
A set of data points and the equations of two lines are given. For each line, determine e2. Then, determine which line
fits the set of data points better, according to the least–squares criterion.
90)
x 1 2 4 4
y 2 3 5 4
Line A: y = 1 + 0.9x
Line B: y = 0.8 + 1.1x
90)
A)
Line A: e2= 1.31
Line B: e2= 1.57
Line A fits the set of data points better.
B)
Line A: e2= 1.31
Line B: e2= 1.57
Line B fits the set of data points better.
C)
Line A: e2= 0.57
Line B: e2= 1.49
Line B fits the set of data points better.
D)
Line A: e2= 0.57
Line B: e2= 1.49
Line A fits the set of data points better.
You are given information about a straight line. Determine whether the line slopes upward, slopes downward, or is
horizontal.
91)
The y–intercept is 0 and the slope is –0.4.
91)
A)
Is horizontal
B)
Slopes upward
C)
Slopes downward
92)
The equation of the line is y = –2.8 –11x.
92)
A)
Slopes upward
B)
Is horizontal
C)
Slopes downward
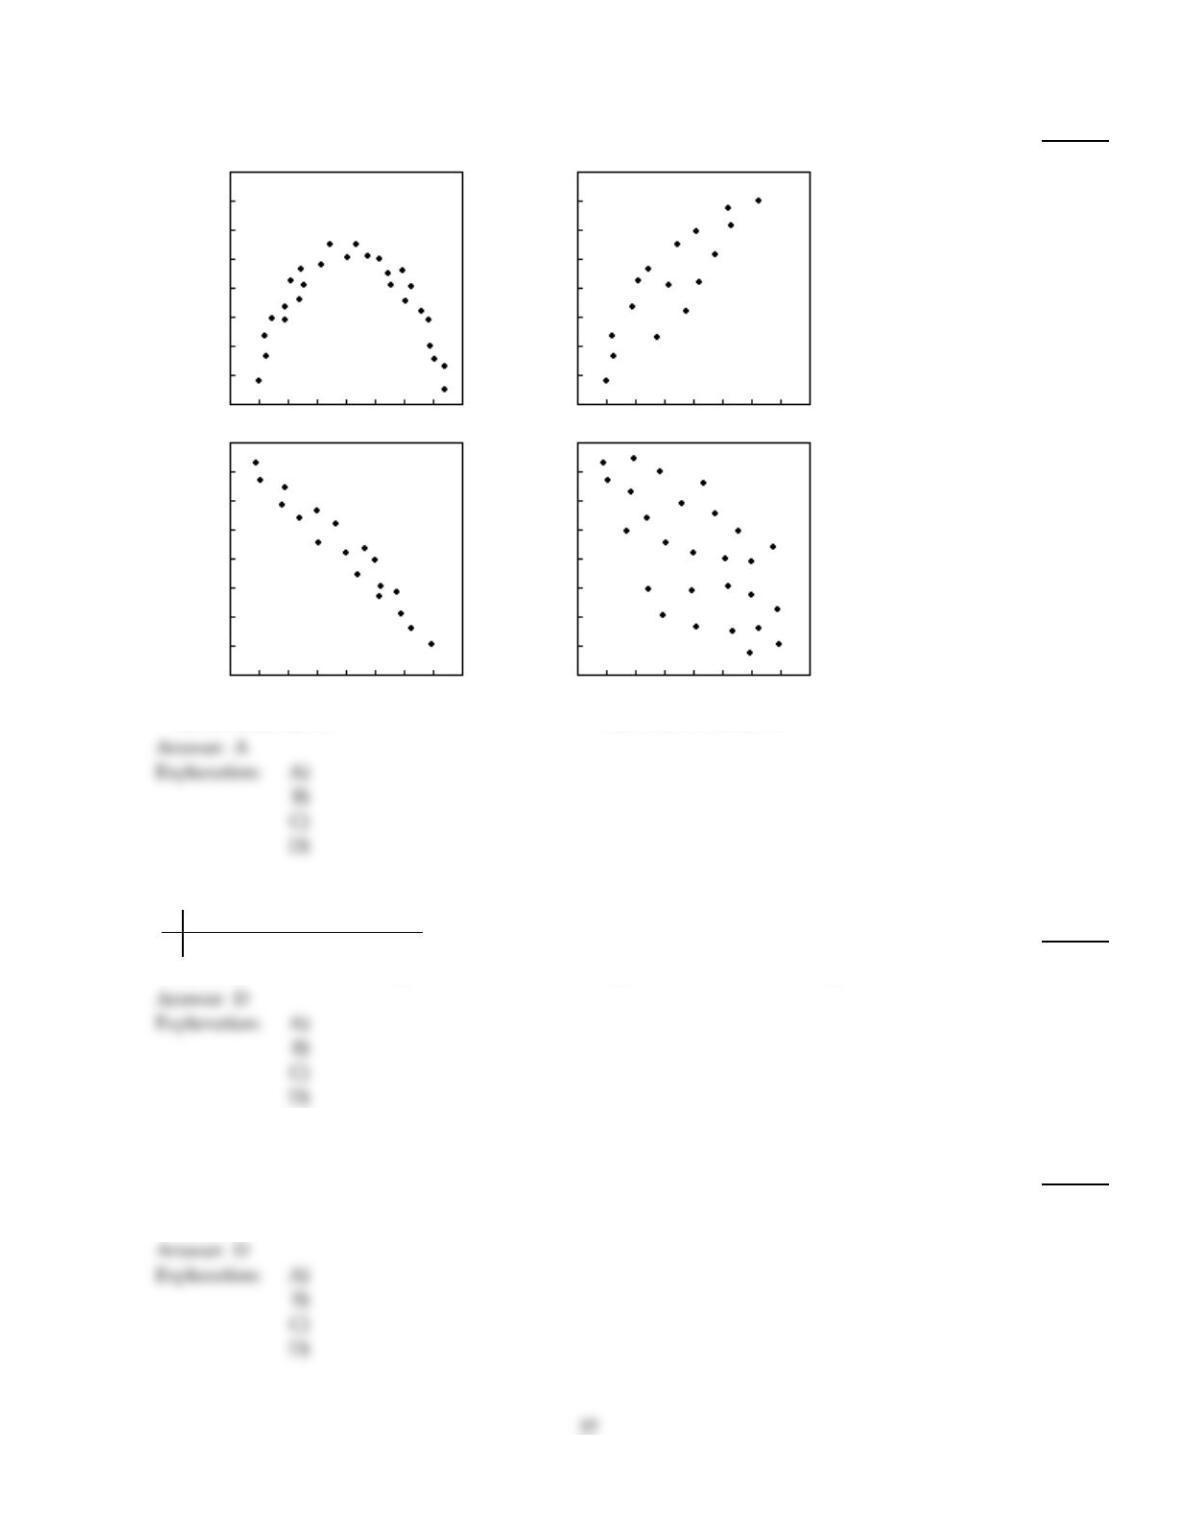
Provide an appropriate response.
93)
For which of the following sets of data points can you reasonably determine a regression line?
1) 2)
3) 4)
93)
A)
2 and 3
B)
2, 3, and 4
C)
All of the above
D)
None of the above
Obtain the linear correlation coefficient for the data. Round your answer to three decimal places.
94)
x 33.1 26.6 46.2 23.6 35.3
y 3 10 2 2 4
94)
A)
0.392
B)
0.349
C)
0
D)
–0.392
Compute the coefficient of determination. Round your answer to four decimal places.
95)
A regression equation is obtained for a set of data points. It is found that the total sum of squares is
127.7, the regression sum of squares is 93.6, and the error sum of squares is 34.1.
95)
A)
0.2670
B)
1.3643
C)
0.3643
D)
0.7330
Determine the percentage of variation in the observed values of the response variable that is explained by the regression.
Round to the nearest tenth of a percent if needed.
96)
x 9 2 3 4 2 5 9 10
y 85 52 55 68 67 86 83 73
96)
A)
23.5%
B)
70.8%
C)
24.6%
D)
50.1%
Determine the y–intercept and slope of the linear equation.
97)
y = –5
97)
A)
y–intercept =5, slope = 0
B)
y–intercept = 0, slope = –5
C)
y–intercept = –5, slope = 1
D)
y–intercept = –5, slope = 0
D
The y–intercept and slope, respectively, of a straight line are given. Find the equation of the line.
98)
0.9 and –1
98)
A)
y =0.9 – x
B)
y =0.9 + x
C)
y –0.9x = 1
D)
y =0.9x – 1
A
Compute the specified sum of squares.
99)
^
The data below consist of heights (x), in meters, and masses (y), in kilograms, of 6 randomly
selected adults. The regression equation is y= –181.342 + 144.46x.
x 1.61 1.72 1.78 1.80 1.67 1.88
y 54 62 70 84 61 92
SSE
99)
A)
119.30
B)
1079.5
C)
979.44
D)
100.06
D
D
Determine the regression equation for the data. Round the final values to three significant digits, if necessary.
100)
Ten students in a graduate program were randomly selected. The following data represent their
grade point averages (GPAs) at the beginning of the year (x) versus their GPAs at the end of the year
(y).
x y
3.5 3.6
3.8 3.7
3.6 3.9
3.6 3.6
3.5 3.9
3.9 3.8
4.0 3.7
3.9 3.9
3.5 3.8
3.7 4.0
100)
A)
^
y= 2.51 + 0.329x
B)
^
y= 5.81 + 0.497x
C)
^
y= 3.67 + 0.0313x
D)
^
y= 4.91 + 0.0212x
The y–intercept and slope, respectively, of a straight line are given. Find the equation of the line.
101)
6 and 5
101)
A)
y =6+5x
B)
y +5x =6
C)
y =6x +5
D)
y =5–6x
Compute the specified sum of squares.
102)
^
The regression equation for the data below is y= 6.18286 + 4.33937x.
x 9 7 2 3 4 22 17
y 43 35 16 21 23 102 81
SSR
102)
A)
6421.83
B)
6531.37
C)
6544.86
D)
13.4790
39
Determine the regression equation for the data. Round the final values to three significant digits, if necessary.
103)
x 24 26 28 30 32
y15 13 20 16 24
103)
A)
^
y= –11.8 + 1.05x
B)
^
y= 11.8 + 1.05x
C)
^
y= 11.8 + 0.950x
D)
^
y= –11.8 + 0.950x
104)
x 6 8 20 28 36
y 2 4 13 20 30
104)
A)
^
y= –3.79 + 0.801x
B)
^
y= –2.79 + 0.897x
C)
^
y= –3.79 + 0.897x
D)
^
y= –2.79 + 0.950x
Provide an appropriate response.
105)
For the linear equation y =20 –15x, explain what the y–intercept and slope represent in terms of
the graph of the equation.
105)
A)
The y–intercept, b0=20, gives the y–value at which the straight line y =20 –15x intersects the
y–axis. The slope, b1= –15, indicates that the y–value decreases by 15 units for every increase
in x of 1 unit.
B)
The y–intercept, b0= –15, gives the y–value at which the straight line y =20 –15x intersects
the y–axis. The slope, b1=20, indicates that the y–value increases by 20 units for every
increase in x of 1 unit.
C)
The y–intercept, b0=20, gives the y–value at which the straight line y =20 –15x intersects the
y–axis. The slope, b1=15, indicates that the y–value increases by 15 units for every increase
in x of 1 unit.
D)
The y–intercept, b0=20, gives the y–value at which the straight line y =20 –15x intersects the
y–axis. The slope, b1= –15, indicates that the x–value decreases by 15 units for every increase
in y of 1 unit.
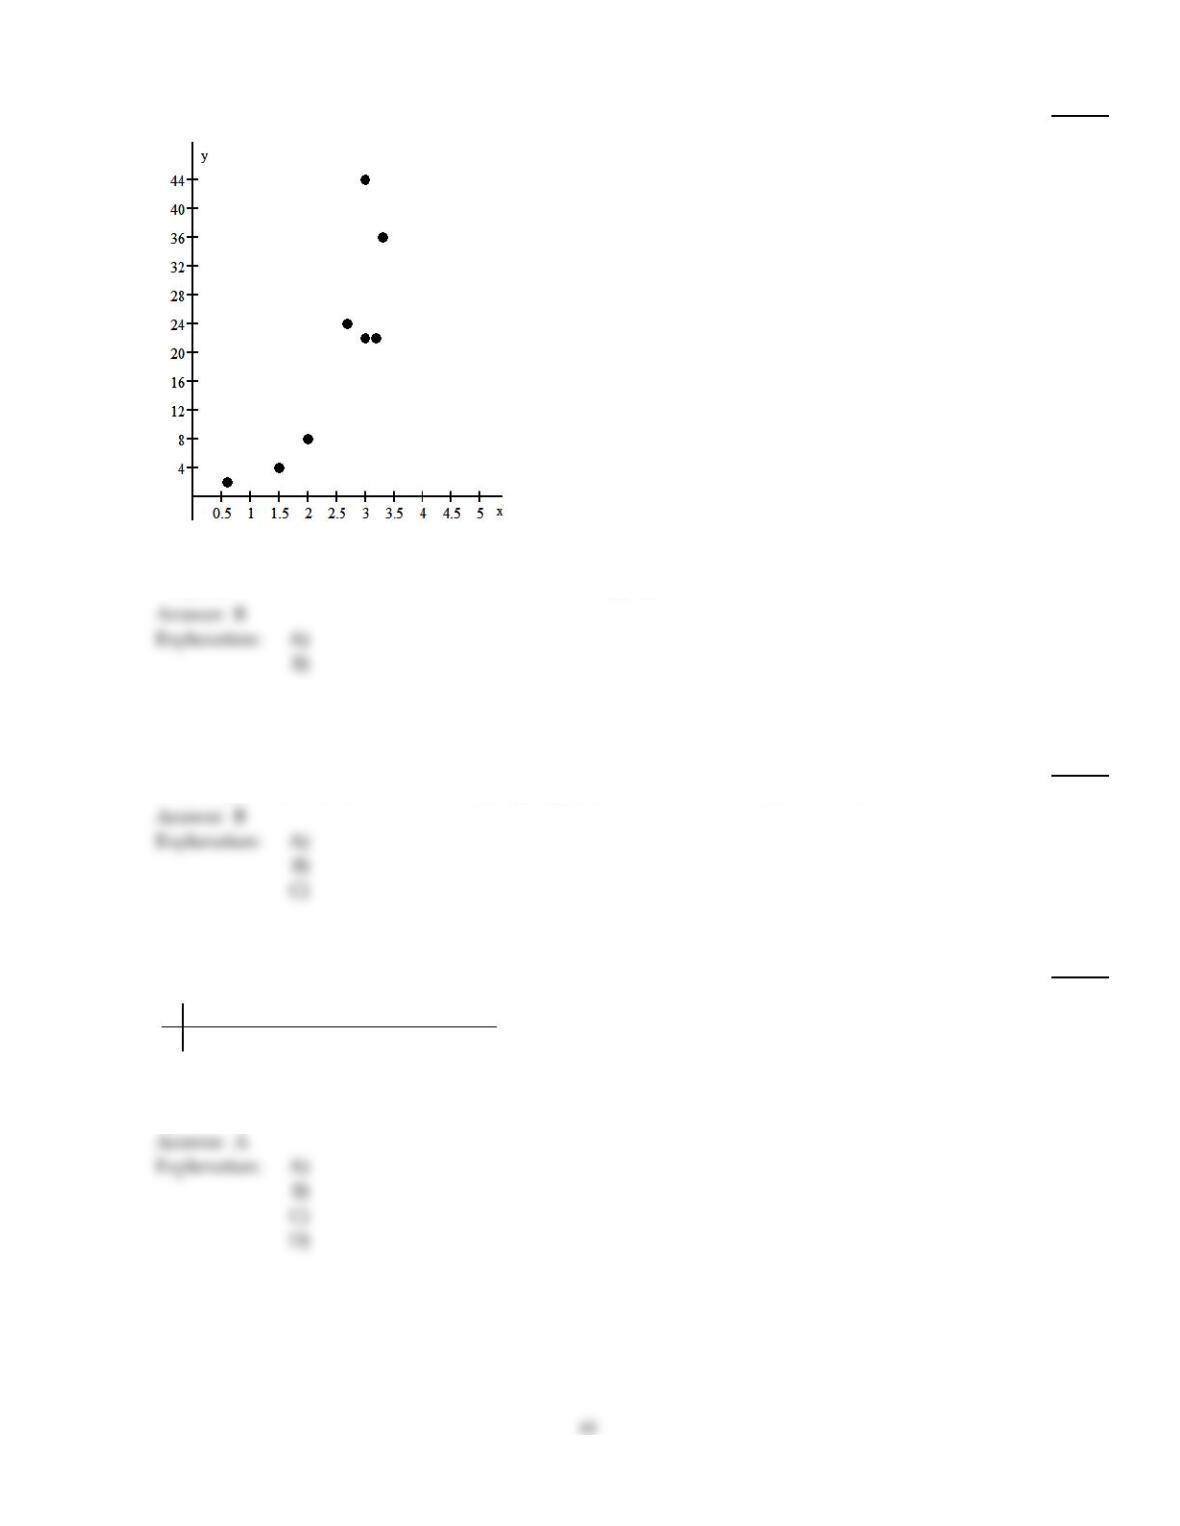
106)
The relationship between two quantities x and y is examined, and the association is shown in the
scatterplot below.
Could a regression line be reasonably used to describe this data?.
106)
A)
Yes
B)
No
You are given information about a straight line. Determine whether the line slopes upward, slopes downward, or is
horizontal.
107)
The equation of the line is y =2+4x.
107)
A)
Slopes downward
B)
Slopes upward
C)
Is horizontal
B
Solve the problem.
108)
The paired data below consist of the temperatures on randomly chosen days and the amount a
certain kind of plant grew (in millimeters):
x 62 76 50 51 71 46 51 44 79
y36 39 50 13 33 33 17 616
Find the SSR.
108)
A)
64.328
B)
242.951
C)
243
D)
0
A
B
Use the regression equation to predict the y–value corresponding to the given x–value. Round your answer to the nearest
tenth.
109)
^
Nine pairs of data yield the regression equation y= 19.4 + 0.93x. Predict y for x =44.
109)
A)
57.8
B)
60.3
C)
64.7
D)
79.6
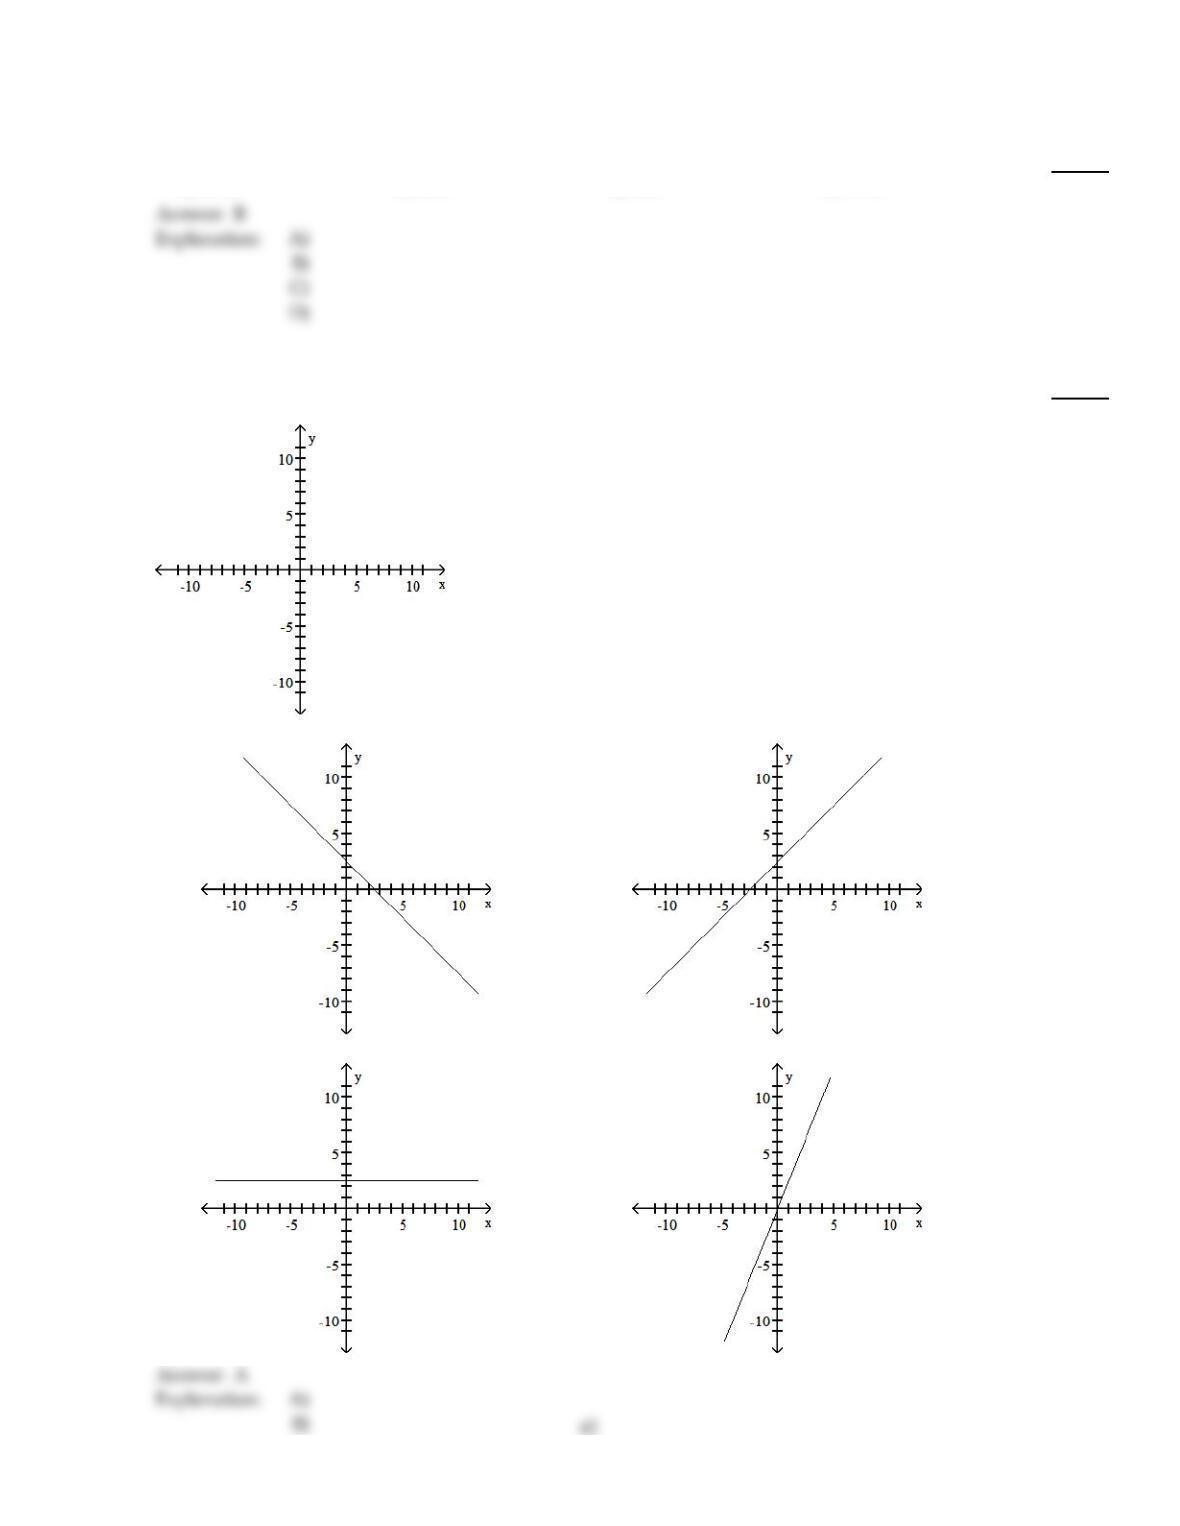
You are given information about a straight line. Use two points to graph the equation.
110)
The equation of the line is y =2.5 – x.
110)
A)
B)
C)
D)
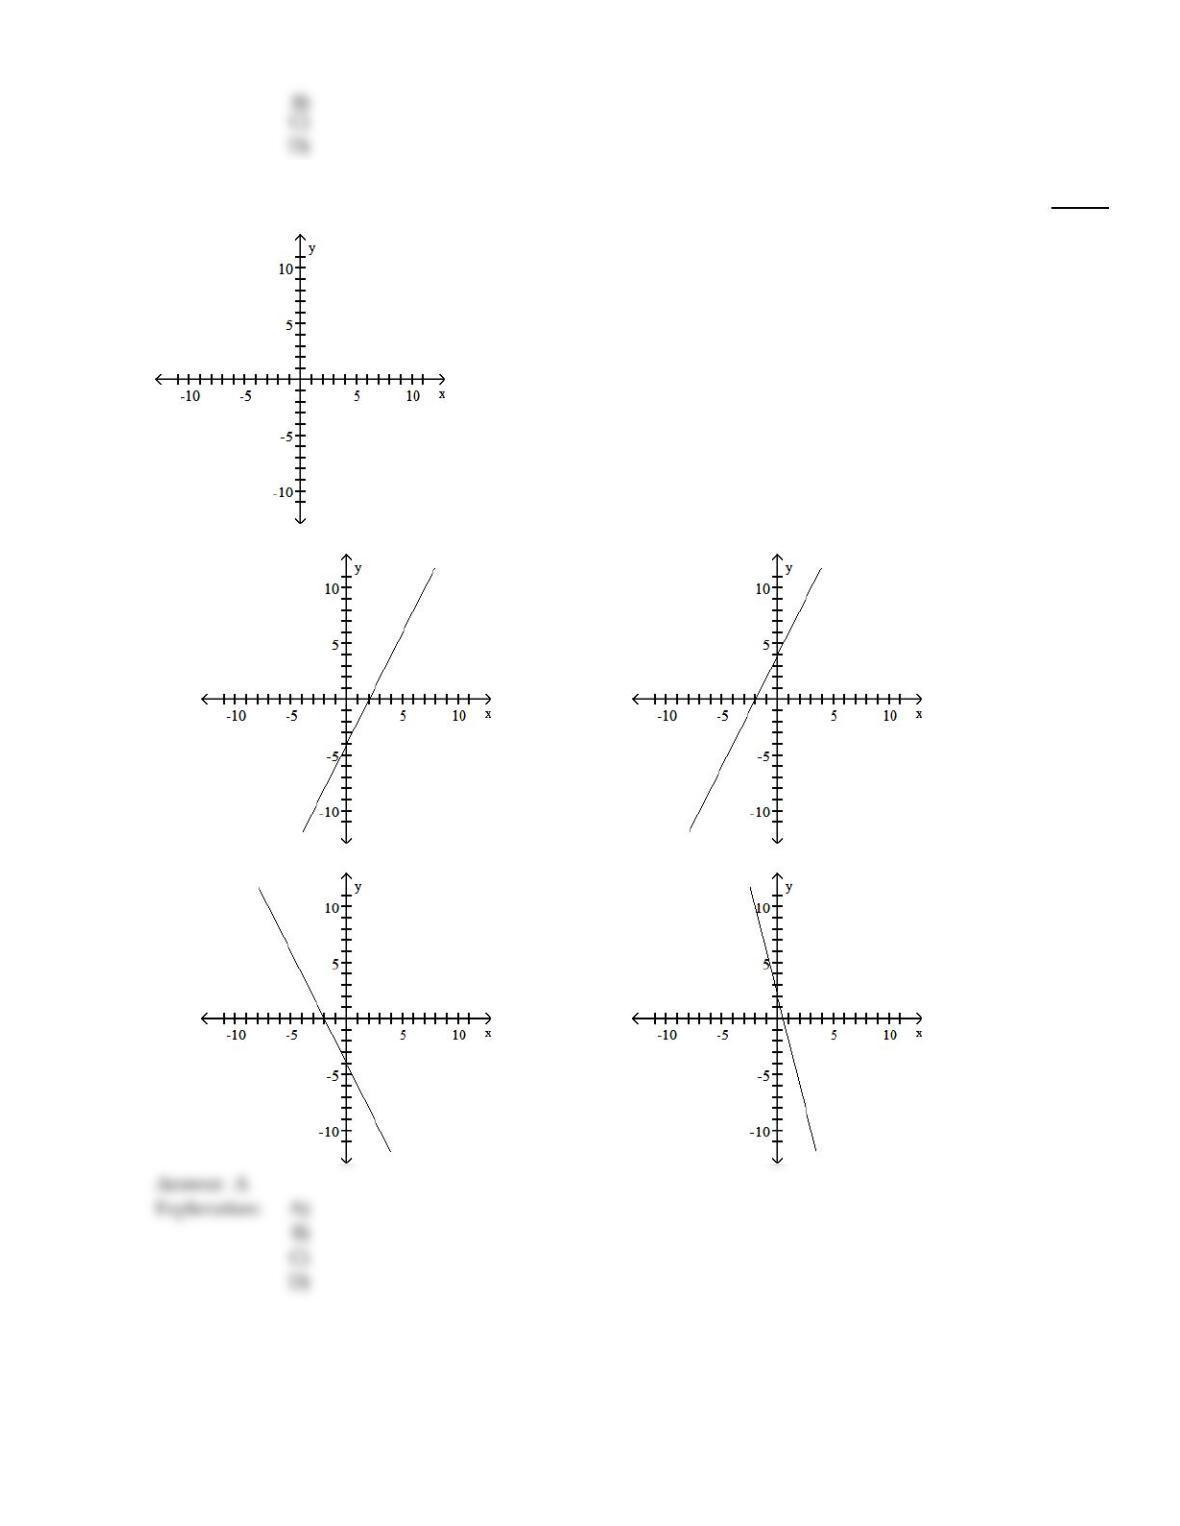
111)
The equation of the line is y = –4+ 2x.
111)
A)
B)
C)
D)
43
You are given information about a straight line. Determine whether the line slopes upward, slopes downward, or is
horizontal.
112)
The y–intercept is 9 and the slope is 0.
112)
A)
Slopes upward
B)
Slopes downward
C)
Is horizontal
Solve the problem.
113)
A study was conducted to compare the average time spent in the lab each week versus course
grade for computer students. The results are recorded in the table below.
Number of hours spent in lab Grade (percent)
10 96
11 51
16 62
958
789
15 81
16 46
10 51
Find the coefficient of determination.
113)
A)
0.017
B)
0.462
C)
0.335
D)
0.112
Provide an appropriate response.
114)
For the linear equation y = –9–3.1x, explain what the y–intercept and slope represent in terms of
the graph of the equation.
114)
A)
The y–intercept, b0= –3.1, gives the y–value at which the straight line y = –9–3.1x intersects
the y–axis. The slope, b1= –9, indicates that the y–value decreases by 9 units for every
increase in x of 1 unit.
B)
The y–intercept, b0= –9, gives the y–value at which the straight line y = –9–3.1x intersects
the x–axis. The slope, b1= –3.1, indicates that the x–value decreases by 3.1 units for every
increase in y of 1 unit.
C)
The y–intercept, b0= –9, gives the y–value at which the straight line y = –9–3.1x intersects
the y–axis. The slope, b1=3.1, indicates that the y–value increases by 3.1 units for every
increase in x of 1 unit.
D)
The y–intercept, b0= –9, gives the y–value at which the straight line y = –9–3.1x intersects
the y–axis. The slope, b1= –3.1, indicates that the y–value decreases by 3.1 units for every
increase in x of 1 unit.
Determine the y–intercept and slope of the linear equation.
115)
y =6.2 – x
115)
A)
y–intercept =6.2, slope = 0
B)
y–intercept =6.2, slope = x
C)
y–intercept =6.2, slope = 1
D)
y–intercept =6.2, slope = –1
Is the data point, P, an outlier, an influential observation, both, or neither?
116)
116)
A)
Both
B)
Outlier
C)
Influential observation
D)
Neither
B
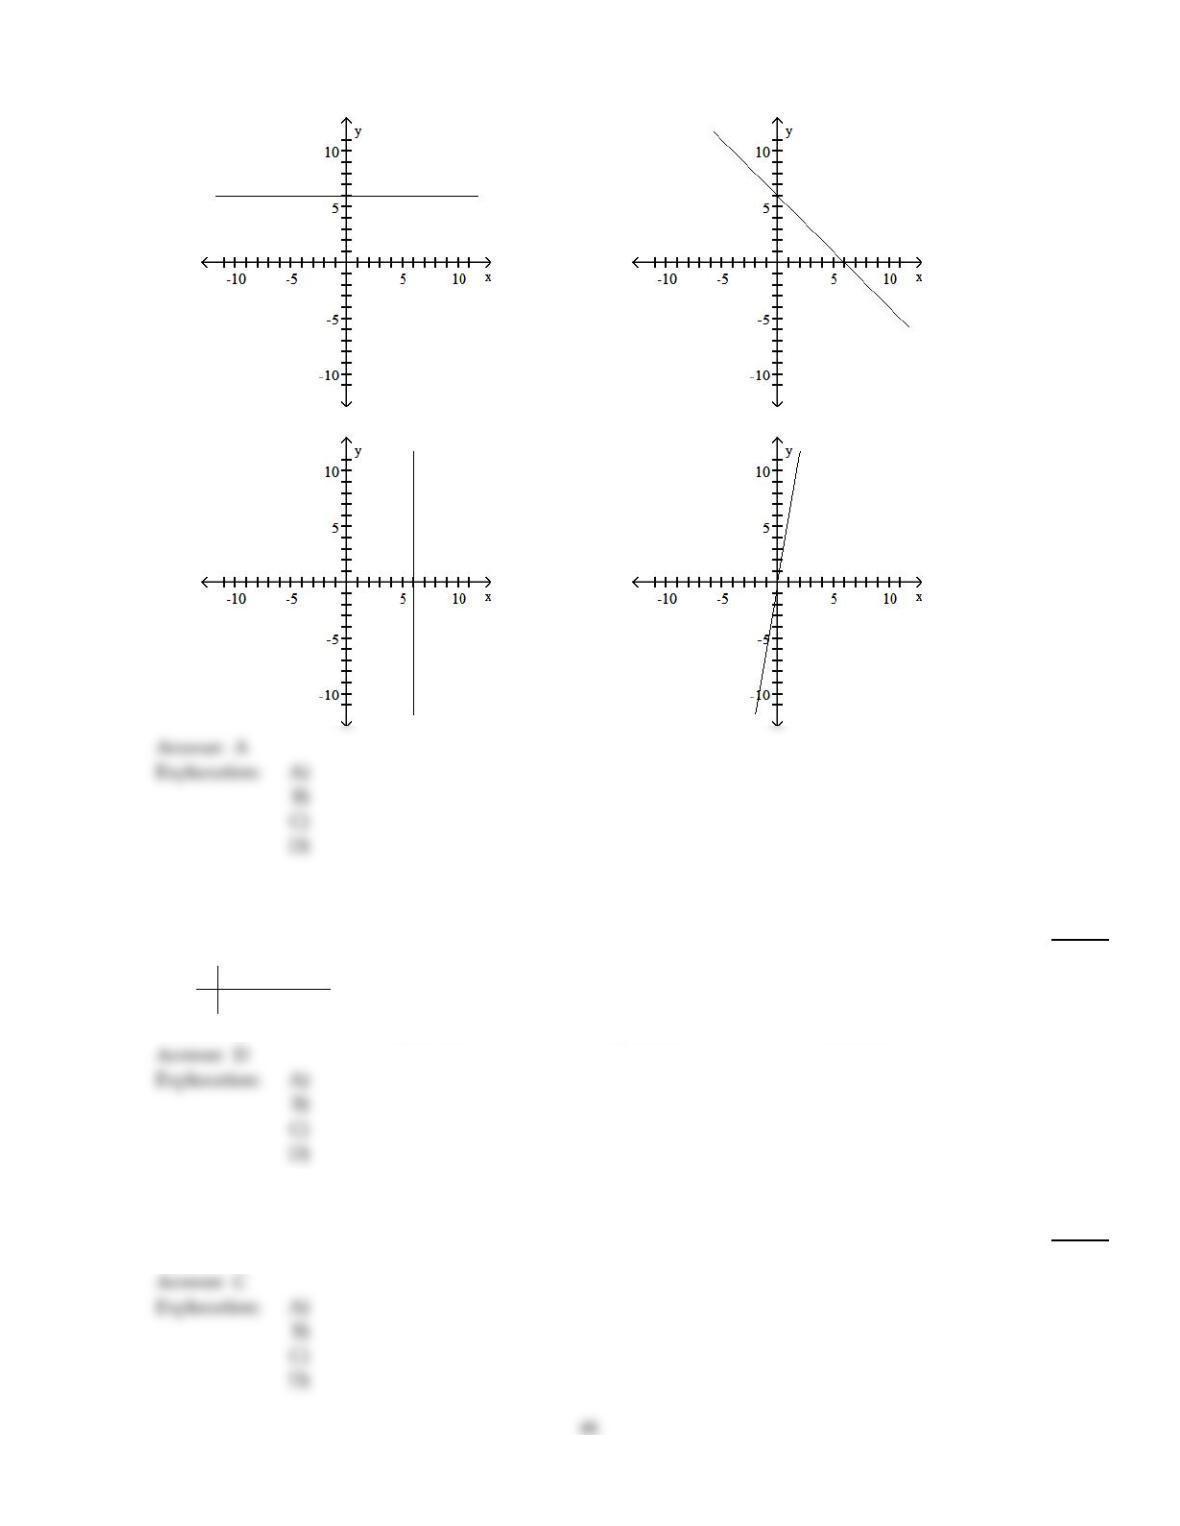
You are given information about a straight line. Use two points to graph the equation.
117)
The y–intercept is 6 and the slope is 0.
117)
45
D
A)
B)
C)
D)
Compute the coefficient of determination. Round your answer to four decimal places.
118)
^
The regression equation for the data below is y= 3x.
x 2 4 5 6
y 7 11 13 20
118)
A)
0.7265
B)
0.9420
C)
0.4839
D)
0.8873
The y–intercept and slope, respectively, of a straight line are given. Find the equation of the line.
119)
–5.5 and 0
119)
A)
y =5.5
B)
y –5.5x = 0
C)
y = –5.5
D)
y = –5.5x
Compute the coefficient of determination. Round your answer to four decimal places.
120)
^
The cost of advertising (x), in thousands of dollars, and the number of products sold (y), in
thousands, for eight randomly selected product lines are shown below.
x 9 2 3 4 2 5 9 10
y 85 52 55 68 67 86 83 73
The regression equation is y= 2.78846x + 55.7885.
120)
A)
0.5009
B)
0.2353
C)
0.7077
D)
–0.0707
Provide an appropriate response.
121)
Which of the following statements concerning the linear correlation coefficient are true?
A: If the linear correlation coefficient for two variables is zero, then there is no relationship between
the variables.
B: If the slope of the regression line is negative, then the linear correlation coefficient is negative.
C: The value of the linear correlation coefficient always lies between –1 and 1.
D: A linear correlation coefficient of 0.62 suggests a stronger linear relationship than a linear
correlation coefficient of –0.82.
121)
A)
C and D
B)
B and C
C)
A and D
D)
A and B
Determine the percentage of variation in the observed values of the response variable that is explained by the regression.
Round to the nearest tenth of a percent if needed.
122)
x 15.7 11.6 18.4 31.2 24.2
y 5 4 9 10 2
122)
A)
18.2%
B)
43.7%
C)
42.7%
D)
38%
Provide an appropriate response.
123)
True or false? The straight–line graph of the linear equation y =b0+b1x is vertical if b1= 0.
123)
A)
True
B)
False
47
124)
True or false? The straight–line graph of the linear equation y =b0+b1x passes through the origin
if b0= 0.
124)
A)
True
B)
False
Obtain the linear correlation coefficient for the data. Round your answer to three decimal places.
125)
x 57 53 59 61 53 56 60
y 156 164 163 177 159 175 151
125)
A)
0.214
B)
–0.078
C)
0.109
D)
–0.054
Determine the regression equation for the data. Round the final values to three significant digits, if necessary.
126)
x 1.2 1.4 1.6 1.8 2.0
y54 53 55 54 56
126)
A)
^
y= 54
B)
^
y= 50.4 + 2.5x
C)
^
y= 55.3 + 2.4x
D)
^
y= 50 + 3x
Compute the specified sum of squares.
127)
^
The data below consist of heights (x), in meters, and masses (y), in kilograms, of 6 randomly
selected adults. The regression equation is y= –181.342 + 144.46x.
x 1.61 1.72 1.78 1.80 1.67 1.88
y54 62 70 84 61 92
SSR
127)
A)
979.44
B)
1149.2
C)
1079.5
D)
100.06
The y–intercept and slope, respectively, of a straight line are given. Find the equation of the line.
128)
–6 and 11
128)
A)
y +11x = –6
B)
y =6+11x
C)
y = –6+11x
D)
y = –6x +11
Determine the regression equation for the data. Round the final values to three significant digits, if necessary.
129)
x 3 5 7 15 16
y 8 11 714 20
129)
A)
^
y= 5.07 + 0.753x
B)
^
y= 4.07 + 0.850x
C)
^
y= 5.07 + 0.850x
D)
^
y= 4.07 + 0.753x
Obtain the linear correlation coefficient for the data. Round your answer to three decimal places.
130)
A study was conducted to compare the number of hours spent in the computer lab on an
assignment (x) and the grade on the assignment (y), for each of eight randomly selected students in
a computer class. The results are recorded in the table below.
x y
10 96
11 51
16 62
9 58
7 89
15 81
16 46
10 51
130)
A)
0.017
B)
–0.335
C)
–0.284
D)
0.462
131)
The data below show the temperature (x) and the amount a plant grew (y), in millimeters, for each
of nine randomly selected days. Calculate the linear correlation coefficient r. Can you conclude
from the value of r alone that the variables x and y are unrelated?
x 62 76 50 51 71 46 51 44 79
y 36 39 50 13 33 33 17 616
131)
A)
0.038; No
B)
0.038; Yes
C)
0.196; No
D)
0.196; Yes
The regression equation for the given data points is provided. Graph the regression equation and the data points.
49
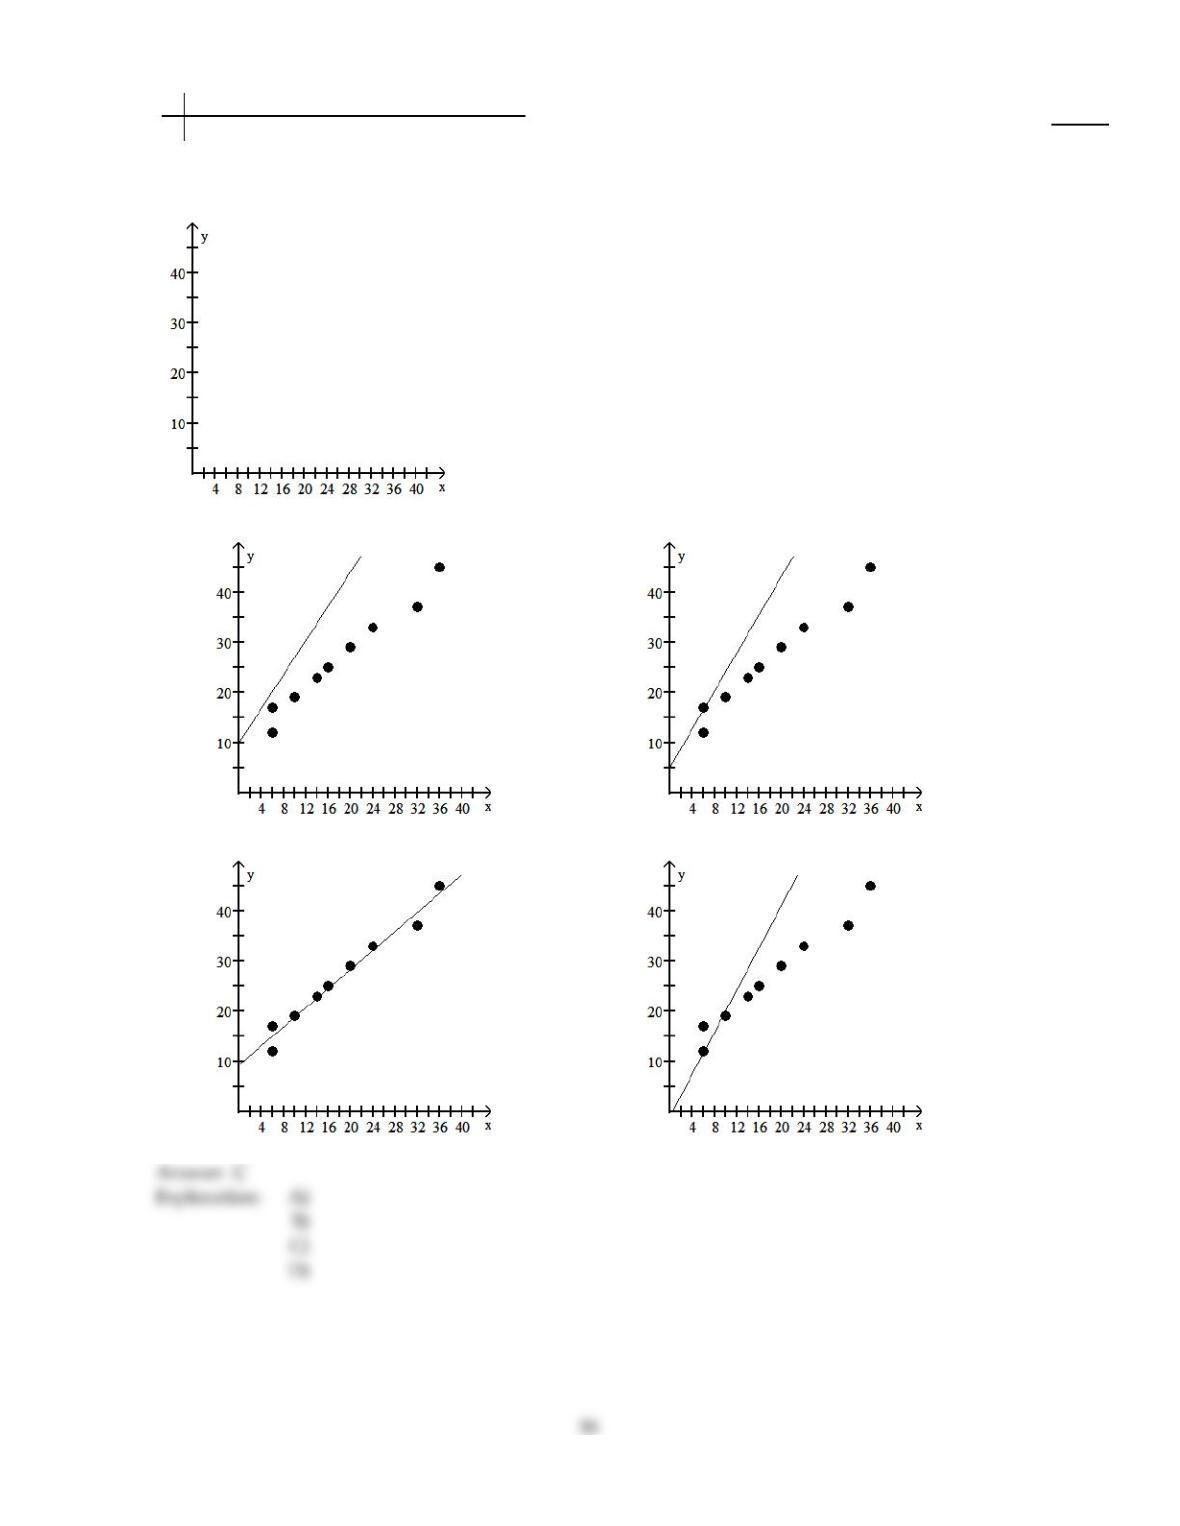
132)
^
x 10 14 20 6 6 14 16 24 32 36
y 19 23 29 12 17 23 25 33 37 45
y= 9.3 + 0.95x
132)
A)
B)
C)
D)
Determine the y–intercept and slope of the linear equation.
133)
y =64.4 – 12.6x
133)
A)
y–intercept = –12.6, slope =64.4
B)
y–intercept =64.4, slope = –12.6
C)
y–intercept =12.6, slope =64.4
D)
y–intercept =64.4, slope =12.6
B
Answer Key
Testname: C4
52
Answer Key
Testname: C4
Answer Key
Testname: C4
Answer Key
Testname: C4
Answer Key
Testname: C4
56
Answer Key
Testname: C4