Unlock document.
This document is partially blurred.
Unlock all pages and 1 million more documents.
Get Access
The Market Forces of Supply and Demand 895
47.
Which of the following events would cause a movement upward and to the right along the supply
curve for
mangos?
a.
The number of sellers of mangos increases.
b.
There is an advance in technology that reduces the cost of producing mangos.
c.
The price of fertilizer decreases, and fertilizer is an input in the production of mangos.
d.
The price of mangos rises.
48.
Which of the following events would cause a movement downward and to the left along the
supply curve for
mangos?
a.
The number of sellers of mangos decreases.
b.
There is an advance in technology that reduces the cost of producing mangos.
c.
The price of mangos falls.
d.
The price of fertilizer increases, and fertilizer is an input in the production of mangos.
49.
The sum of all the individual supply curves for a product is called
a.
total supply.
b.
market supply.
c.
aggregate supply.
d.
total output.
50.
The market supply curve
a.
is found by vertically adding the individual supply curves.
b.
slopes downward.
c.
represents the sum of the prices that all the sellers are willing to accept for a given quantity of
the good.
d.
represents the sum of the quantities supplied by all the sellers at each price of the good.
The Market Forces of Supply and Demand 897
51.
In a market, to find the total amount supplied at a particular price, we must
a.
sum the quantities that individual firms are willing and able to supply at that price.
b.
calculate the average of the quantities that individual firms are willing and able to supply at that
price.
c.
sum the costs that individual firms incur to supply the product at that price.
d.
account for all determinants of demand.
52.
A market supply curve is determined by
a.
vertically summing individual supply curves.
b.
horizontally summing individual supply curves.
c.
finding the average quantity supplied by sellers at each possible price.
d.
finding the average price at which sellers are willing and able to sell a particular quantity of the
good.

53.
A market supply curve shows
a.
the total quantity supplied at all possible prices.
b.
the average quantity supplied by producers at all possible prices.
c.
how quantity supplied changes when consumer income changes.
d.
suppliers’ responses, in terms of the amounts they will supply, to the demands of buyers.
54.
A market supply curve shows how the total quantity supplied of a good varies as
a.
production technology varies.
b.
price varies.
c.
input prices vary.
d.
demand varies.
The Market Forces of Supply and Demand 899
55.
Suppose there are six bait and tackle shops that sell worms in a lakeside resort town in
Minnesota. If we add the
respective quantities that each shop would produce and sell at each of
the six bait and tackle shops when the price
of worms is $2 per bucket, $2.50 per bucket, and $3
per bucket, and so forth, we have found the
a.
market demand curve.
b.
market supply curve.
c.
equilibrium curve.
d.
surplus or shortage depending on market conditions.
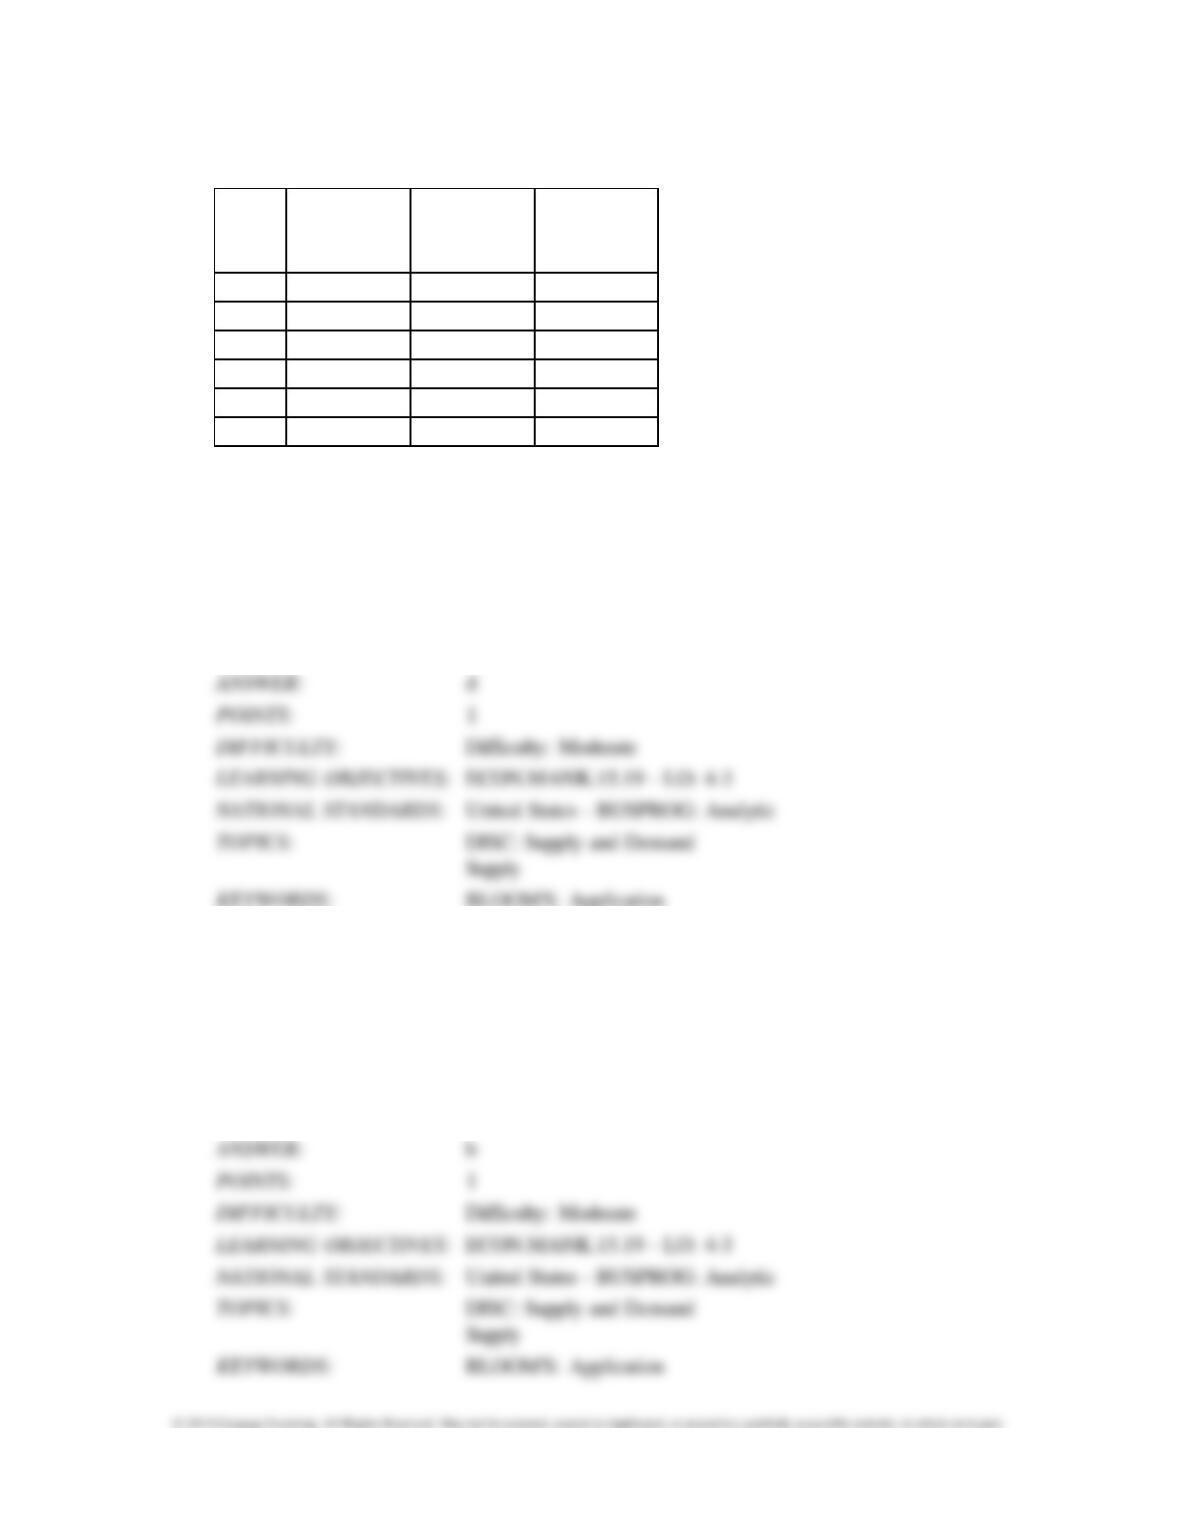
Table 4-6
Price
Firm A’s
Quantity
Supplied
Firm B’s
Quantity
Supplied
Firm C’s
Quantity
Supplied
Firm D’s
Quantity
Supplied
$0
10
0
0
0
$2
8
3
4
5
$4
6
6
8
10
$6
4
9
12
15
$8
2
12
8
20
$10
0
15
4
25
56.
Refer to Table 4-6. Which supply schedules obey the law of supply?
a.
Firm A’s only
b.
Firm B’s, Firm C’s, and Firm D’s only
c.
Firm A’s and Firm C’s only
d.
Firm B’s and Firm D’s only
57.
Refer to Table 4-6. If these are the only four sellers in the market, then the market quantity
supplied at a price of $4 is
a.
4 units.
b.
7.5 units.
c.
10 units.
d.
30 units.

The Market Forces of Supply and Demand 901
58.
Refer to Table 4-6. If these are the only four sellers in the market, then the market quantity
supplied at a price of $10 is
a.
3 units.
b.
11 units.
c.
25 units.
d.
44 units.
59.
Refer to Table 4-6. If these are the only four sellers in the market, then when the price
increases from $6 to $8,
the market quantity supplied
a.
increases by 0.5 units.
b.
increases by 2 units.
c.
decreases by 4 units.
d.
increases by 42 units.
60.
Refer to Table 4-6. If these are the only four sellers in the market, then when the price
decreases from $4 to $2,
the market quantity supplied
a.
increases by 10 units.
b.
decreases by 10 units.
c.
decreases by 20 units.
d.
decreases by 30 units.
Table 4-7
Price
Dairy
Barn’s
Gallons
Supplied
Dolly’s
Dairy’s
Gallons
Supplied
Four Queen’s
Gallons
Supplied
Moo
Roo’s
Gallons
Supplied
$0
0
0
0
0
$2
3
4
2
1
$4
6
8
4
2
$6
9
12
6
3
$8
12
16
8
4
$10
15
20
10
5
The Market Forces of Supply and Demand 903
61.
Refer to Table 4-7. If these are the only four sellers in the market for ice cream, then the
market quantity
supplied at a price of $4 is
a.
4 gallons.
b.
5 gallons.
c.
20 gallons.
d.
80 gallons.
62.
Refer to Table 4-7. If these are the only four sellers in the market for ice cream, then the
market quantity
supplied at a price of $8 is
a.
10 gallons.
b.
20 gallons.
c.
32 gallons.
d.
40 gallons.
63.
Refer to Table 4-7. If these are the only four sellers in the market for ice cream, then when the
price decreases
from $10 to $8, the market quantity supplied decreases by
a.
2.5 gallons.
b.
4 gallons.
c.
10 gallons.
d.
50 gallons.
64.
Refer to Table 4-7. If these are the only four sellers in the market for ice cream, then when the
price increases
from $4 to $6, the market quantity supplied
a.
decreases by 10 gallons.
b.
decreases by 20 gallons.
c.
increases by 10 gallons.
d.
increases by 20 gallons.
The Market Forces of Supply and Demand 905
Table 4-8
Price
Firm X’s
Quantity
Supplied
Firm Y’s
Quantity
Supplied
Firm Z’s
Quantity
Supplied
$0
0
0
0
$3
2
4
6
$6
4
8
12
$9
6
12
18
$12
8
16
24
$15
10
20
30
65.
Refer to Table 4-8. If these are the only three sellers in the market, then the market quantity
supplied at a price of $6 is
a.
6 units.
b.
12 units.
c.
18 units.
d.
24 units.
66.
Refer to Table 4-8. If these are the only three sellers in the market, then an increase in the
market price from $6
to $12 will increase quantity supplied by
a.
12 units.
b.
24 units.
c.
36 units.
d.
48 units.
67.
Refer to Table 4-8. Suppose Firm X and Firm Y are the only two sellers in the market. If the
market price
decreases from $12 to $9, quantity supplied will
a.
decrease by 6 units.
b.
decrease by 12 units.
c.
increase by 6 units.
d.
increase by 12 units.
68.
Refer to Table 4-8. Suppose Firm X and Firm Y are the only two sellers in the market. If the
market price
increases from $12 to $15, quantity supplied will
a.
decrease by 6 units.
b.
decrease by 12 units.
c.
increase by 6 units.
d.
increase by 12 units.
The Market Forces of Supply and Demand 907
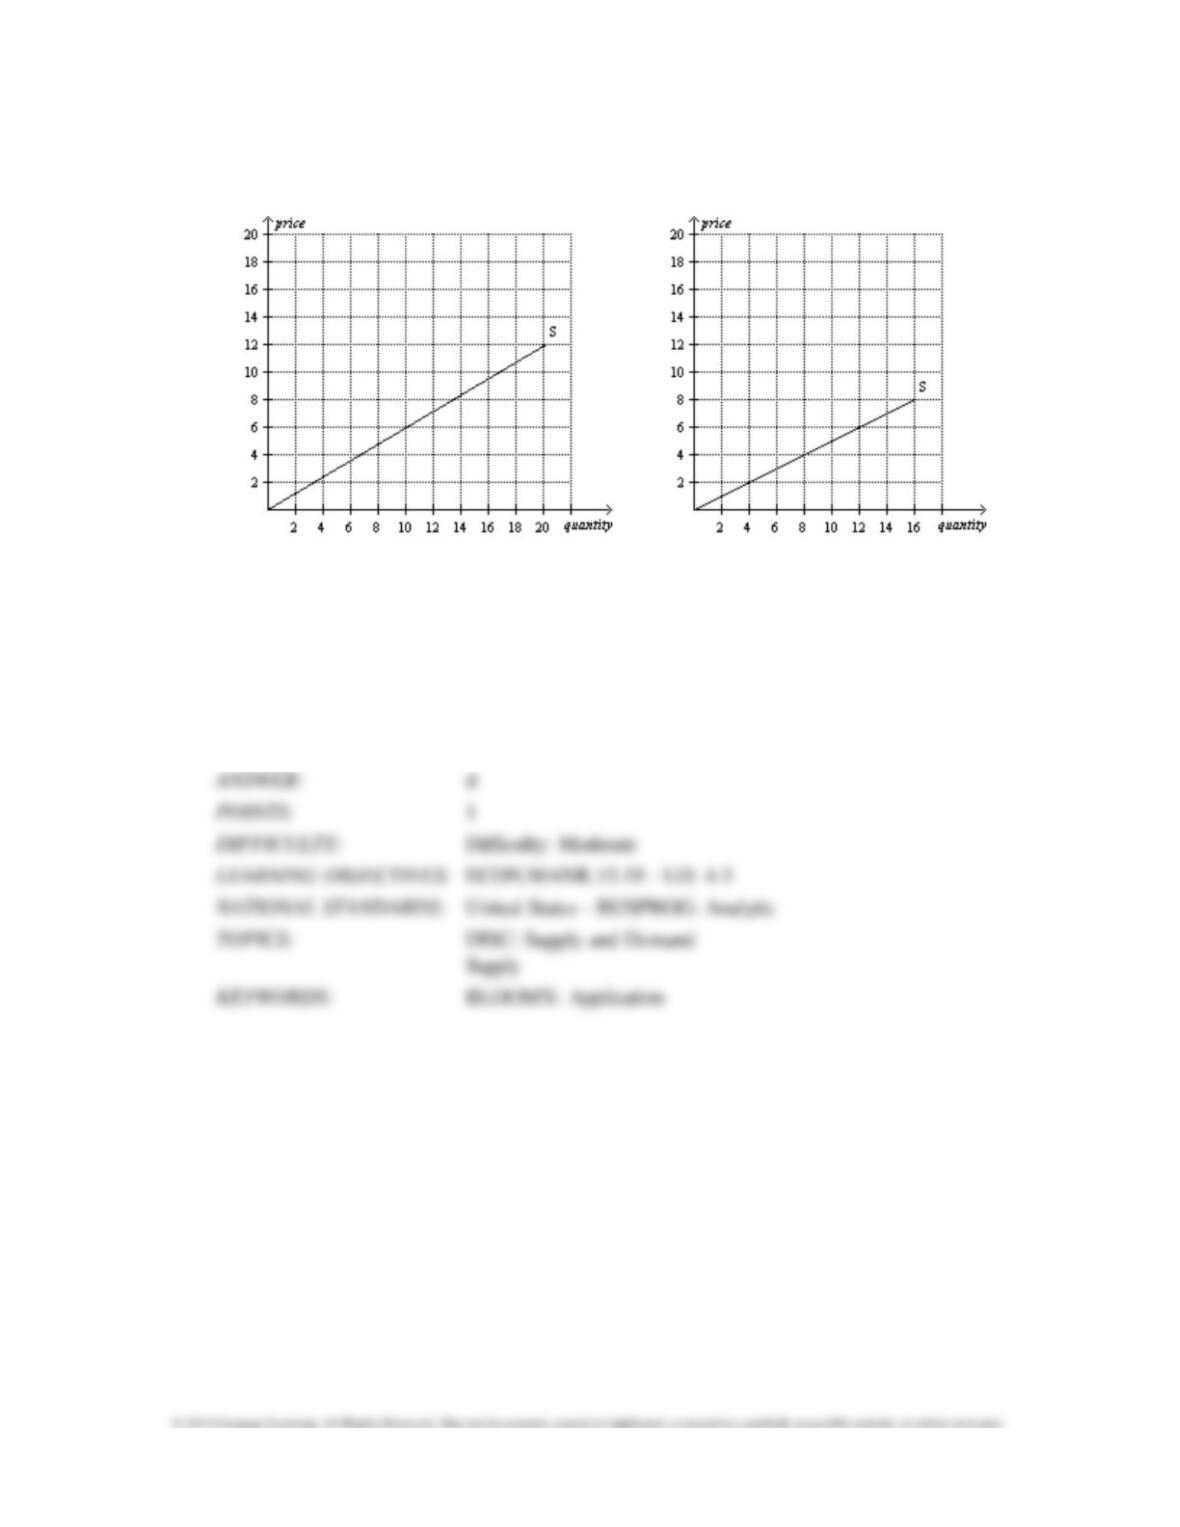
Figure 4-12
Firm A Firm B
69.
Refer to Figure 4-12. If these are the only two sellers in the market, then the market quantity
supplied at a price
of $4 is
a.
6 units.
b.
7 units.
c.
8 units.
d.
14 units.

70.
Refer to Figure 4-12. If these are the only two sellers in the market, then the market quantity
supplied at a price
of $6 is
a.
2 units.
b.
10 units.
c.
12 units.
d.
22 units.
71.
Refer to Figure 4-12. If these are the only two sellers in the market, then the market quantity
supplied at a price
of $8 is
a.
14 units.
b.
15 units.
c.
16 units.
d.
29 units.
The Market Forces of Supply and Demand 909
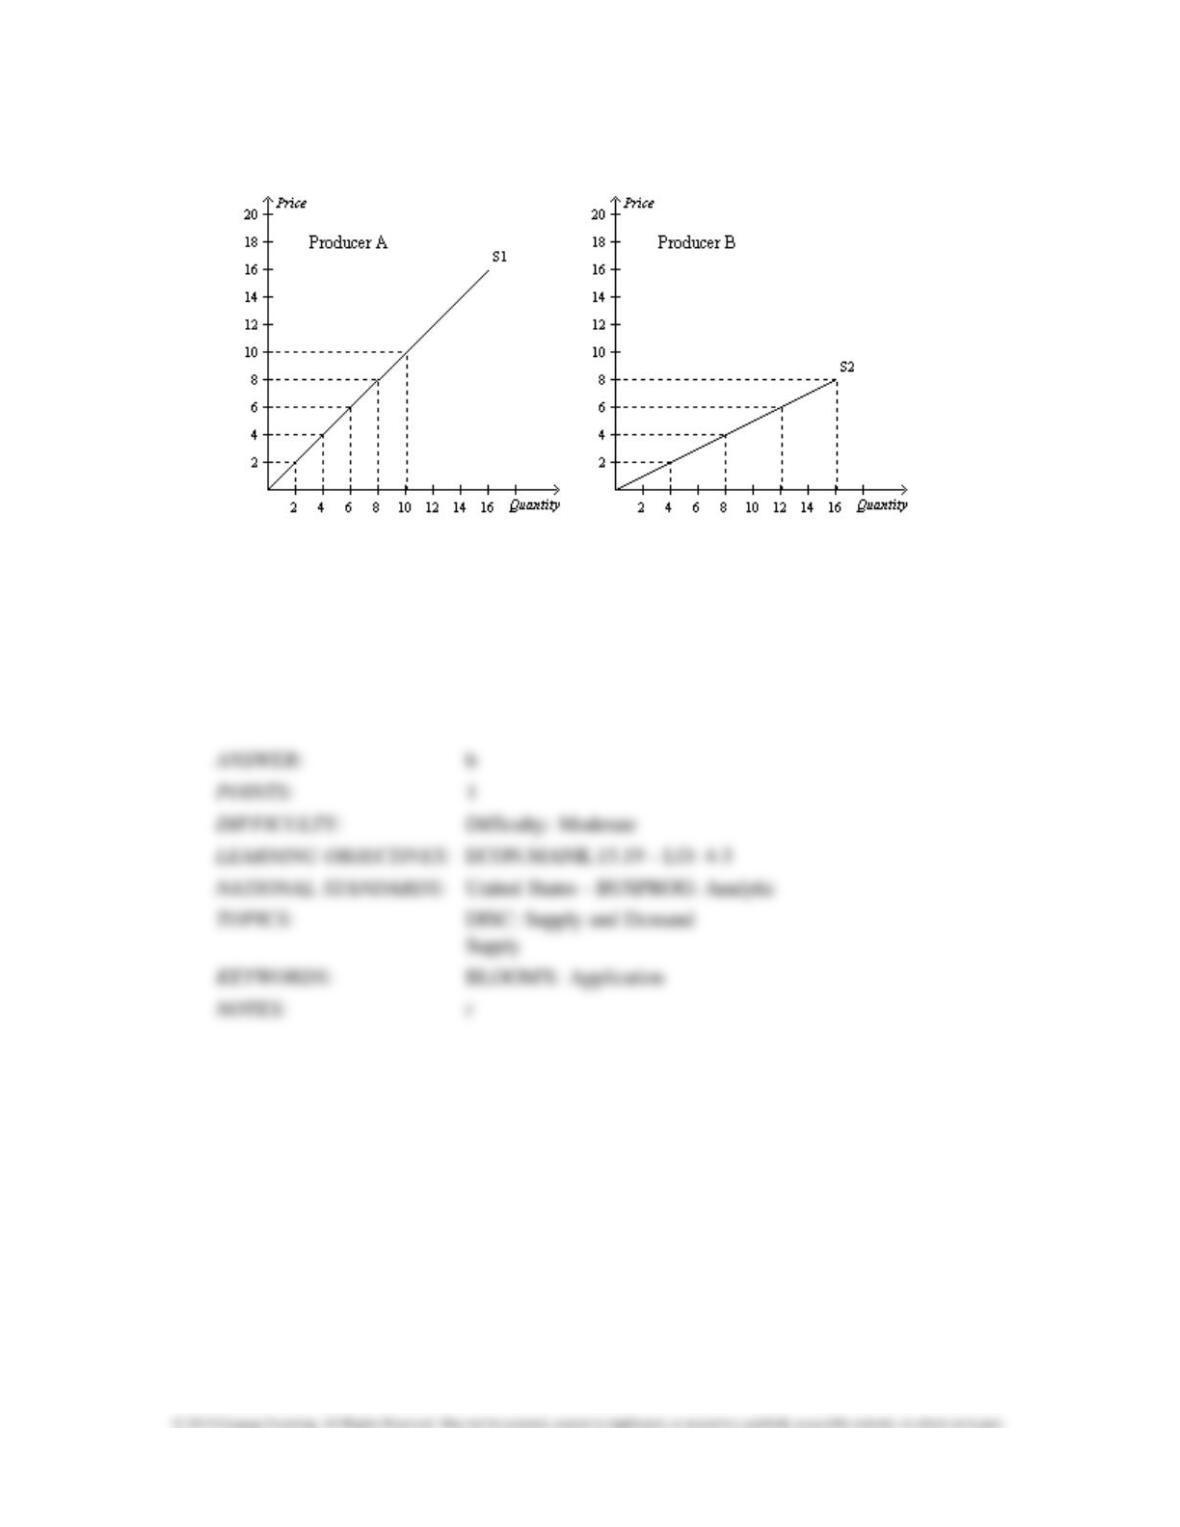
Figure 4-13
72.
Refer to Figure 4-13. If Producer A and Producer B are the only producers in the market, then
the market
quantity supplied when the price is $2 is
a.
4 units.
b.
6 units.
c.
8 units.
d.
10 units.
73.
Refer to Figure 4-13. If Producer A and Producer B are the only producers in the market, then
the market
quantity supplied when the price is $4 is
a.
4 units.
b.
8 units.
c.
12 units.
d.
16 units.
74.
Refer to Figure 4-13. If Producer A and Producer B are the only producers in the market, then
the market
quantity supplied when the price is $6 is
a.
4 units.
b.
6 units.
c.
12 units.
d.
18 units.
75.
Refer to Figure 4-13. If Producer A and Producer B are the only producers in the market, then
the market
quantity supplied when the price is $8 is
a.
8 units.
b.
16 units.
c.
24 units.
d.
32 units.
76.
The supply curve for portable charcoal grills shifts
a.
only when production technology changes.
b.
when a determinant of the supply of portable charcoal grills other than the price of portable
charcoal grills
changes.
c.
when any determinant of the supply of portable charcoal grills changes.
d.
only when the number of sellers of portable charcoal grills changes.

77.
Lead is an important input in the production of crystal. If the price of lead decreases, then we
would expect the
supply of
a.
crystal to be unaffected.
b.
crystal to decrease.
c.
crystal to increase.
d.
lead to increase.
78.
Suppose you make jewelry. If the price of gold falls, then we would expect you to
a.
be willing and able to produce less jewelry than before at each possible price.
b.
be willing and able to produce more jewelry than before at each possible price.
c.
face a greater demand for your jewelry.
d.
face a weaker demand for your jewelry.
79.
Workers at a bicycle assembly plant currently earn the mandatory minimum wage. If the federal
government
increases the minimum wage by $1.00 per hour, then it is likely that the
a.
demand for bicycle assembly workers will increase.
b.
supply of bicycles will shift to the right.
c.
supply of bicycles will shift to the left.
d.
firm must increase output to maintain profit levels.
80.
Suppose there is an increase in the price of steel. We would expect the supply curve for steel
beams to
a.
shift rightward.
b.
shift leftward.
c.
become flatter.
d.
remain unchanged.
81.
Wheat is the main input in the production of flour. If the price of wheat decreases, then we would
expect the
a.
demand for flour to increase.
b.
demand for flour to decrease.
c.
supply of flour to increase.
d.
supply of flour to decrease.
82.
Matthew bakes apple pies that he sells at the local farmer’s market. If the price of apples
increases, the
a.
supply curve for Matthew’s pies will increase.
b.
supply curve for Matthew’s pies will decrease.
c.
demand curve for Matthew’s pies will increase.
d.
demand curve for Matthew’s pies will decrease.


