The Market Forces of Supply and Demand 795
33.
When we move along a given demand curve,
a.
only price is held constant.
b.
income and price are held constant.
c.
all nonprice determinants of demand are held constant.
d.
all determinants of quantity demanded are held constant.
34.
Once the demand curve for a product or service is drawn, it
a.
remains stable over time.
b.
can shift either rightward or leftward.
c.
is possible to move along the curve, but the curve will not shift.
d.
tends to become steeper over time.

35.
If something happens to alter the quantity demanded at any given price, then
a.
the demand curve becomes steeper.
b.
the demand curve becomes flatter.
c.
the demand curve shifts.
d.
we move along the demand curve.
36.
When quantity demanded decreases at every possible price, the demand curve has
a.
shifted to the left.
b.
shifted to the right.
c.
not shifted; rather, we have moved along the demand curve to a new point on the same curve.
d.
not shifted; rather, the demand curve has become flatter.
The Market Forces of Supply and Demand 797
37.
When quantity demanded increases at every possible price, the demand curve has
a.
shifted to the left.
b.
shifted to the right.
c.
not shifted; rather, we have moved along the demand curve to a new point on the same curve.
d.
not shifted; rather, the demand curve has become steeper.
38.
The market demand curve
a.
is found by vertically adding the individual demand curves.
b.
slopes upward.
c.
represents the sum of the prices that all the buyers are willing to pay for a given quantity of the
good.
d.
represents the sum of the quantities demanded by all the buyers at each price of the good.
39.
The market demand curve
a.
is the sum of all individual demand curves.
b.
is the demand curve for every product in an industry.
c.
shows the average quantity demanded by individual demanders at each price.
d.
is always flatter than an individual demand curve.
40.
To obtain the market demand curve for a product, sum the individual demand curves
a.
vertically.
b.
diagonally.
c.
horizontally.
d.
and then average them.
The Market Forces of Supply and Demand 799
41.
A market demand curve shows
a.
the relationship between price and the number of buyers in a market.
b.
how quantity demanded changes when the number of sellers changes.
c.
the sum of all prices that individual buyers are willing and able to pay for each possible quantity
of the good.
d.
how much of a good all buyers are willing and able to buy at each possible price.
42.
A market demand curve shows how the total quantity demanded of a good varies as
a.
income varies.
b.
price varies.
c.
price of the nearest substitute good varies.
d.
supply varies.
43.
The sum of all the individual demand curves for a product is called
a.
income demand.
b.
equilibrium demand.
c.
complementary demand.
d.
market demand.
44.
Which of the following is not an expression for the sum of all the individual demand curves for a
product?
a.
total demand
b.
market demand
c.
equilibrium demand
d.
aggregate demand
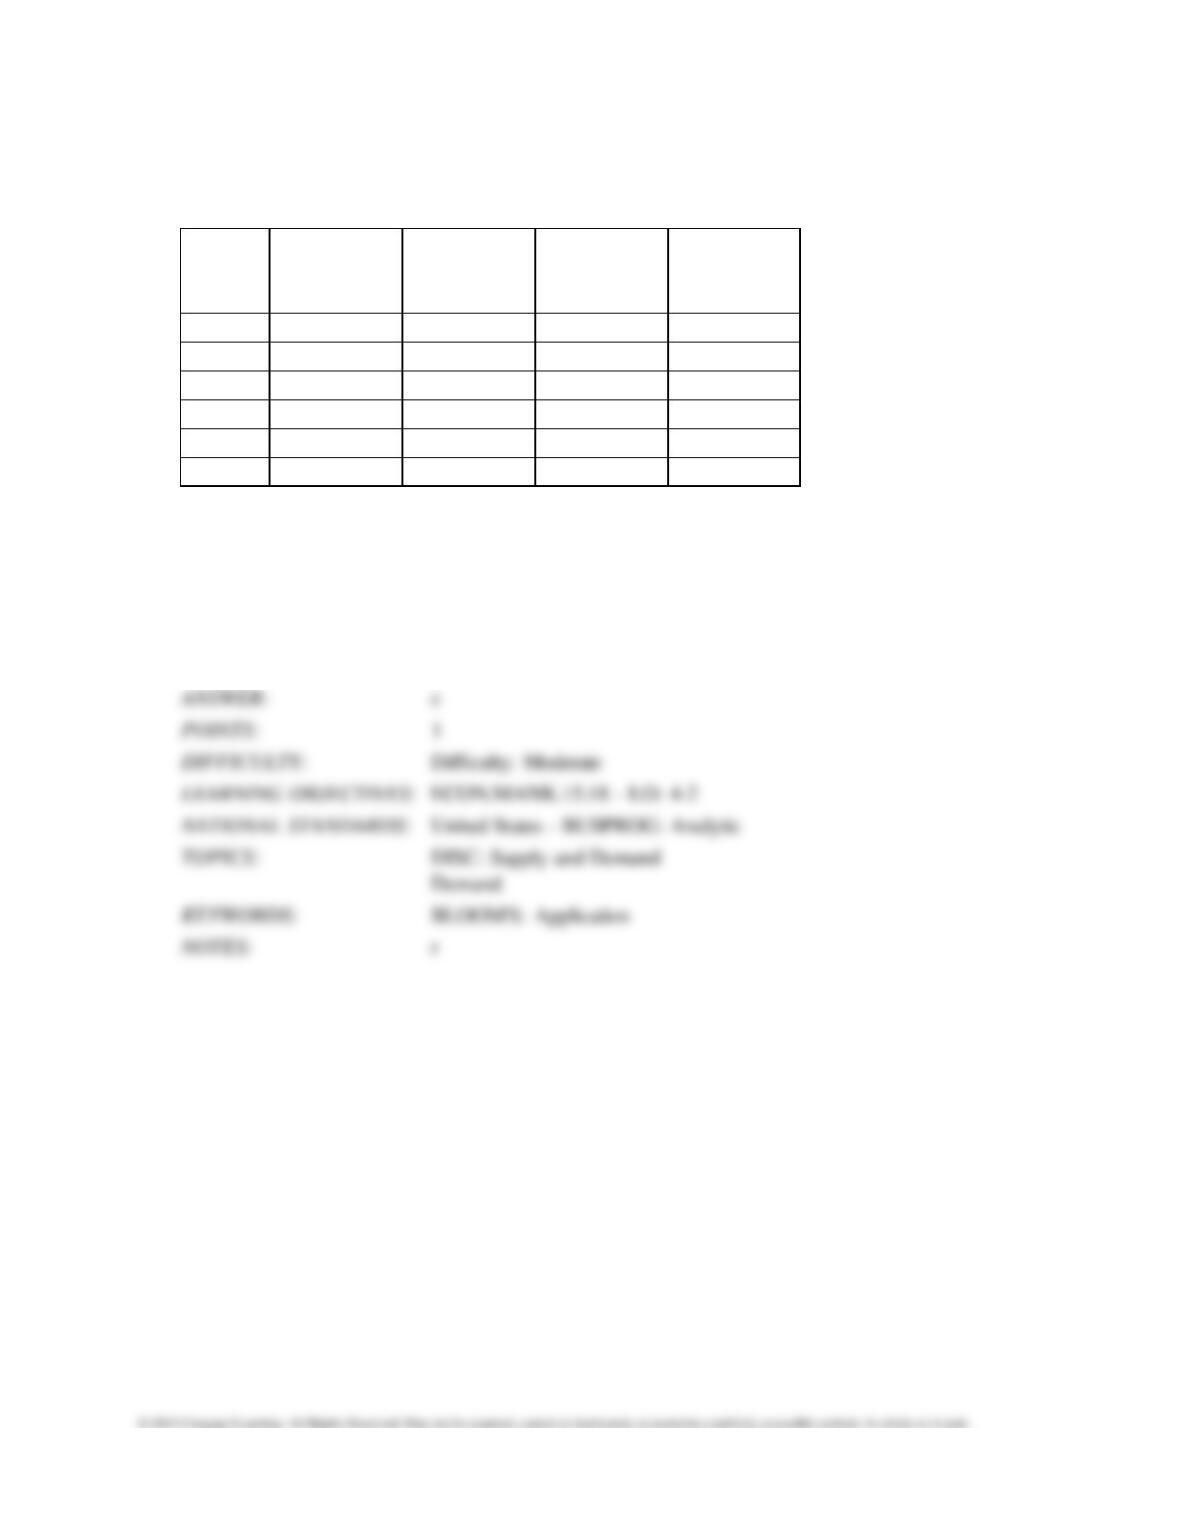
Table 4-1
Price
Quantity Demanded
by Michelle
Quantity Demanded
by Laura
Quantity Demanded
by Hillary
$5
5
4
11
$4
6
6
13
$3
7
8
15
$2
8
10
17
$1
9
12
19
$0
10
14
21
45.
Refer to Table 4-1. If the market consists of Michelle, Laura, and Hillary and the price falls by
$1, the quantity
demanded in the market increases by
a.
2 units.
b.
3 units.
c.
4 units.
d.
5 units.
46.
Refer to Table 4-1. If the market consists of Michelle and Laura only and the price falls by $1,
the quantity
demanded in the market increases by
a.
2 units.
b.
3 units.
c.
4 units.
d.
5 units.
47.
Refer to Table 4-1. If the market consists of Michelle and Hillary only and the price falls by $1,
the quantity
demanded in the market increases by
a.
2 units.
b.
3 units.
c.
4 units.
d.
5 units.
48.
Refer to Table 4-1. If the market consists of Laura and Hillary only and the price falls by $1,
the quantity
demanded in the market increases by
a.
2 units.
b.
3 units.
c.
4 units.
d.
5 units.
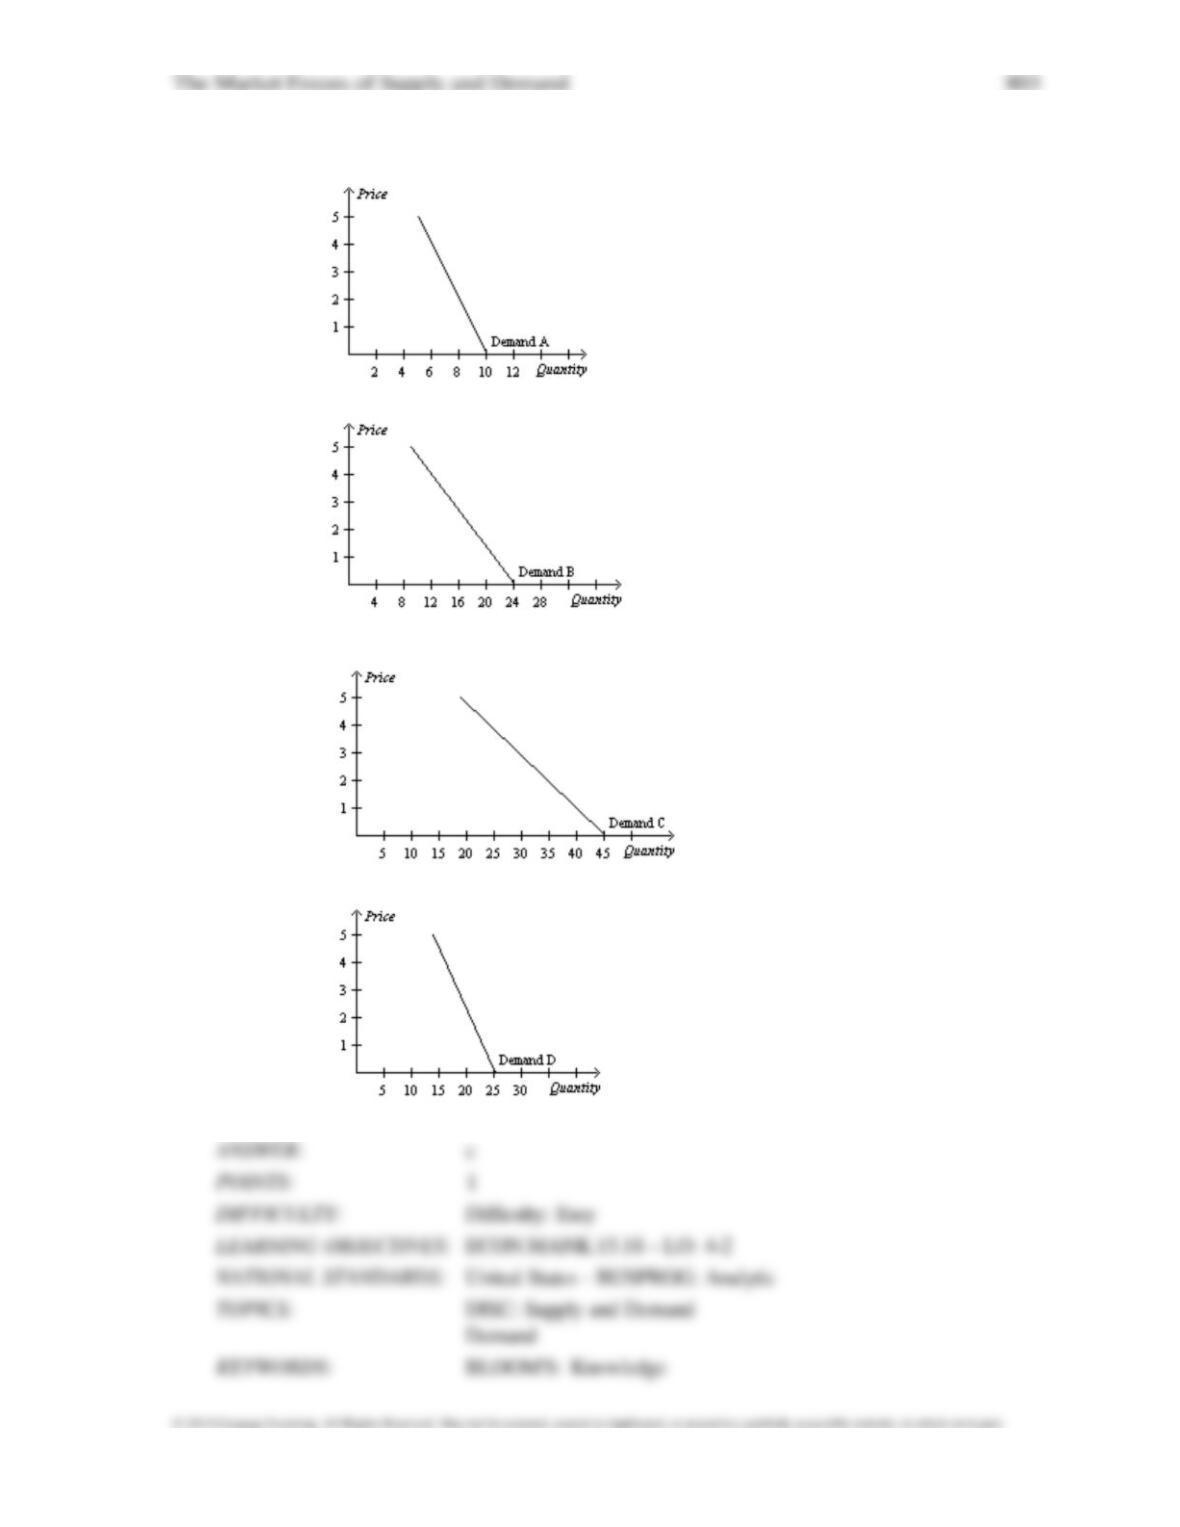
49.
Refer to Table 4-1. Which of the following illustrates the market demand curve?
a.
b.
c.
d.
804 The Market Forces of Supply and Demand
Table 4-2
Price
Abby’s
Quantity
Demanded
Brandi’s
Quantity
Demanded
Carrie’s
Quantity
Demanded
DeeDee’s
Quantity
Demanded
$12
2
1
3
4
$10
4
4
4
5
$8
6
7
5
6
$6
8
8
4
7
$4
10
9
3
8
$2
12
10
2
9
50.
Refer to Table 4-2. Whose demand does not obey the law of demand?
a.
Abby’s
b.
Brandi’s
c.
Carrie’s
d.
DeeDee’s
51.
Refer to Table 4-2. Suppose Abby, Brandi, Carrie, and DeeDee are the only four buyers in the
market. If the
price is $8, then the market quantity demanded is
a.
4 units.
b.
6 units.
c.
24 units.
d.
32 units.
52.
Refer to Table 4-2. Suppose Abby, Brandi, Carrie, and DeeDee are the only four buyers in the
market. When the
price decreases from $6 to $4, the market quantity demanded
a.
increases by 0.75 units.
b.
increases by 3 units.
c.
increases by 4 units.
d.
decreases by 27 units.
806 The Market Forces of Supply and Demand
Table 4-3
Price
Bert’s
Quantity
Demanded
Ernie’s
Quantity
Demanded
Grover’s
Quantity
Demanded
Oscar’s
Quantity
Demanded
$0.00
20
16
4
8
$0.50
18
12
6
6
$1.00
14
10
2
5
$1.50
12
8
0
4
$2.00
6
6
0
2
$2.50
0
4
0
0
53.
Refer to Table 4-3. Whose demand does not obey the law of demand?
a.
Bert’s
b.
Ernie’s
c.
Grover’s
d.
Oscar’s
54.
Refer to Table 4-3. If these are the only four buyers in the market, then the market quantity
demanded at a price
of $1 is
a.
4 units.
b.
7.75 units.
c.
14 units.
d.
31 units.
55.
Refer to Table 4-3. If these are the only four buyers in the market, then the market quantity
demanded at a price
of $2 is
a.
0 units.
b.
3.5 units.
c.
12 units.
d.
14 units.
56.
Refer to Table 4-3. If these are the only four buyers in the market, then when the price
increases from $1.00 to $1.50, the market quantity demanded
a.
decreases by 1.75 units.
b.
increases by 2 units.
c.
decreases by 7 units.
d.
decreases by 24 units.
57.
Refer to Table 4-3. For whom is the good a normal good?
a.
Bert only
b.
Grover only
c.
Bert, Ernie, Grover, and Oscar
d.
This cannot be determined from the table.
Table 4-4
Price
Quantity Demanded
by Adam
Quantity Demanded
by Barb
Quantity Demanded
by Carl
$10
10
8
22
$8
12
12
26
$6
14
16
30
$4
16
20
34
$2
18
24
38
$0
20
28
42
58.
Refer to Table 4-4. Suppose the market consists of Adam, Barb, and Carl. If the price falls by
$2, the quantity
demanded in the market increases by
a.
4 units.
b.
6 units.
c.
8 units.
d.
10 units.
59.
Refer to Table 4-4. Suppose the market consists of Barb and Carl only. If the price falls by $2,
the quantity
demanded in the market increases by
a.
4 units.
b.
6 units.
c.
8 units.
d.
10 units.
60.
Refer to Table 4-4. Suppose the market consists of Adam and Barb only. If the price rises by
$2, the quantity
demanded in the market falls by
a.
4 units.
b.
6 units.
c.
8 units.
d.
10 units.
810 The Market Forces of Supply and Demand
Table 4-5
The table below shows the quantities demanded of cases of Mt. Dew per month by four families
at various prices.
Price of Case of
Mr. Dew
The Adams
Family
The Jones
Family
The Smith
Family
The Williams
Family
$7
9
15
12
14
$8
8
12
10
10
$9
7
9
8
6
$10
6
6
6
2
61.
Refer to Table 4-5. Suppose the four families listed in the table are the only demanders of Mt.
Dew in the
market. If the price of a case of Mt. Dew decreases by $1, the
a.
market quantity demanded decreases by 10.
b.
market quantity demanded increases by 10.
c.
Adams family increases its quantity demanded by more than the Smith family.
d.
Jones family increases its quantity demanded by more than the Williams family.
62.
Refer to Table 4-5. If the four families listed in the table are the only demanders of Mt. Dew in
the market, which
of the following is a correct graph of the market demand?
a.
The Market Forces of Supply and Demand 811
b.
c.
d.
63.
Refer to Table 4-5. Which of the following could cause all four families to demand more Mt.
Dew at all prices?
a.
The price of sugar decreases.
b.
All four family incomes increase, and Mt. Dew is a normal good.
c.
A major university study reveals that drinking Mt. Dew can cause diabetes.
d.
The technology for bottling carbonated beverages improves.
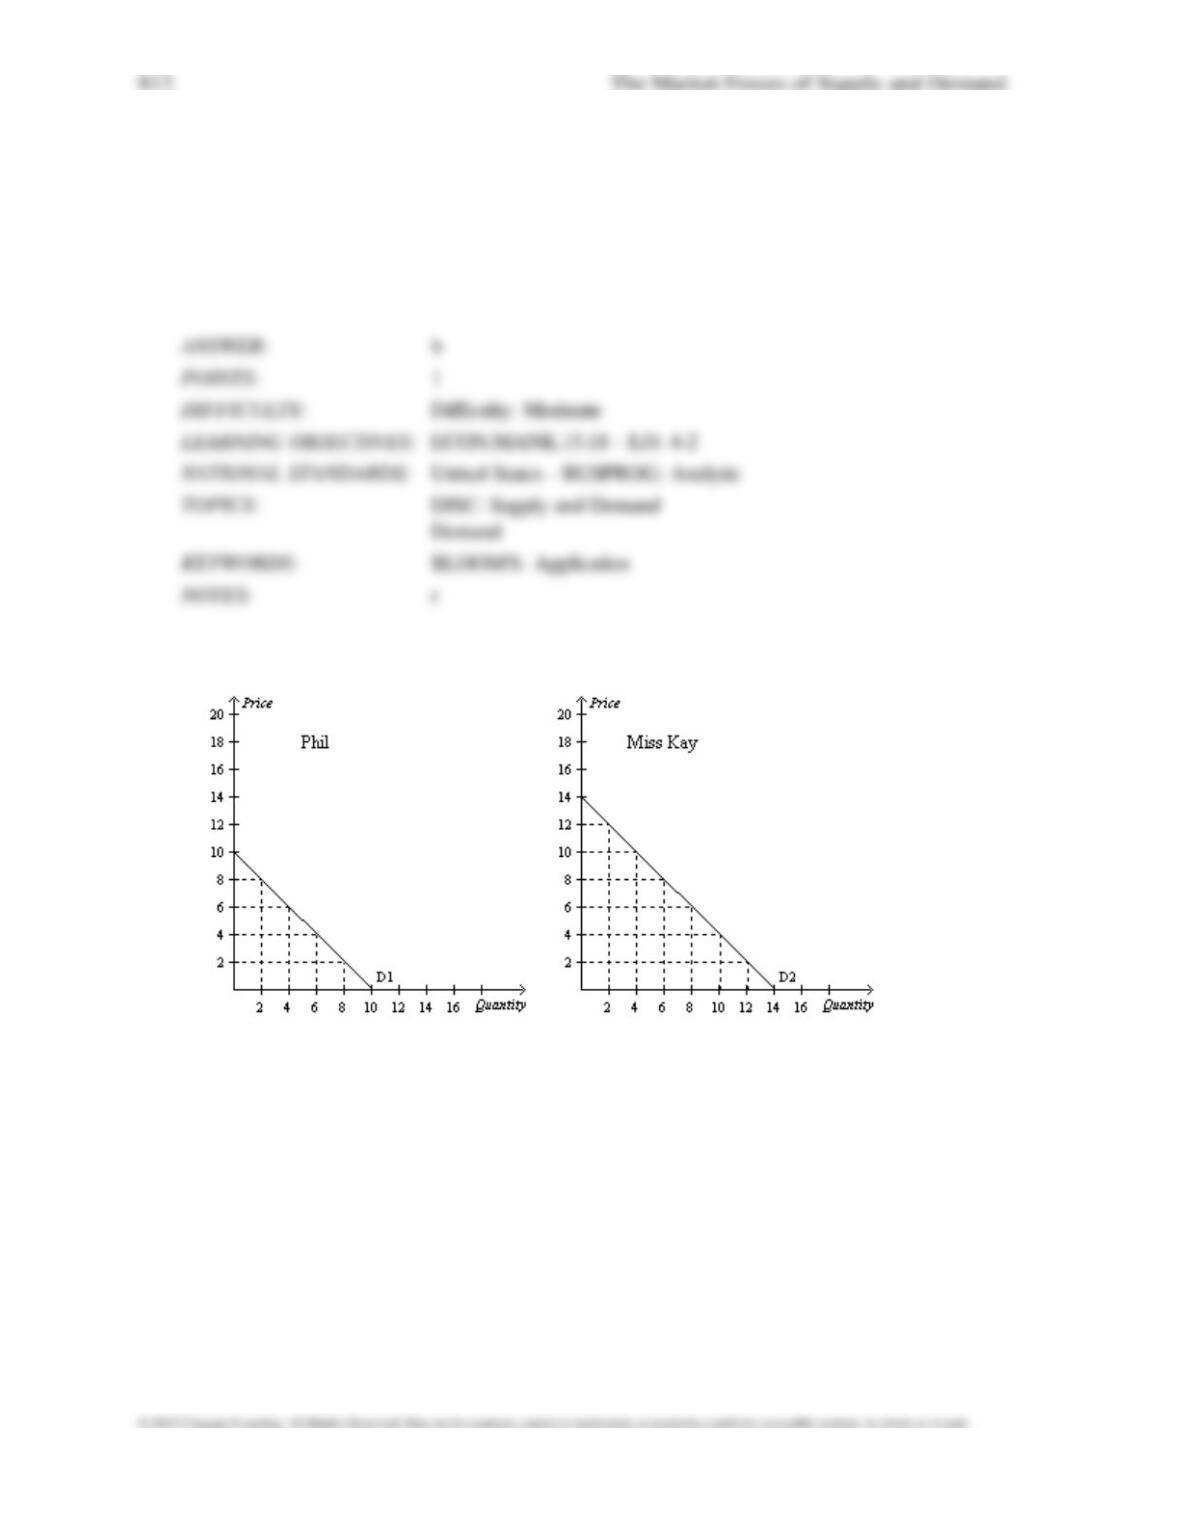
Figure 4-2
The Market Forces of Supply and Demand 813
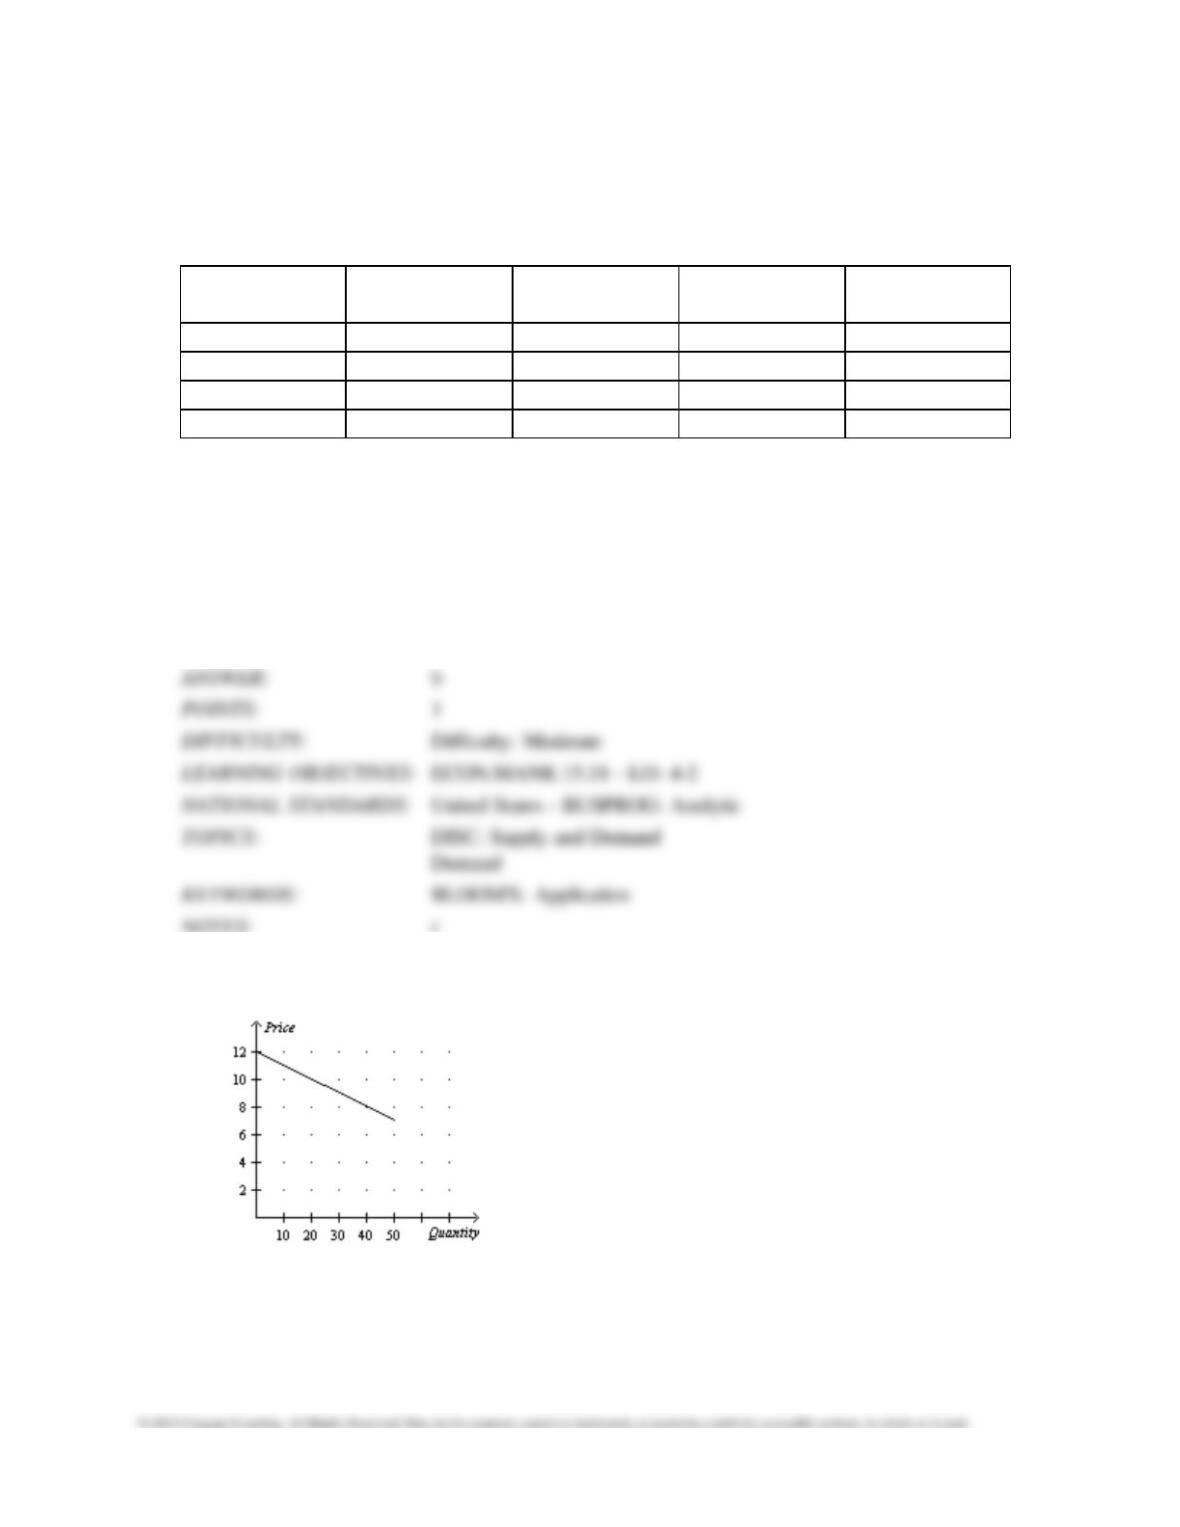
64.
Refer to Figure 4-2. Suppose Phil and Miss Kay are the only consumers in the market. If the
price is $12, then
the market quantity demanded is
a.
0 units.
b.
2 units.
c.
4 units.
d.
6 units.
65.
Refer to Figure 4-2. Suppose Phil and Miss Kay are the only consumers in the market. If the
price is $10, then
the market quantity demanded is
a.
0 units.
b.
2 units.
c.
4 units.
d.
6 units.
66.
Refer to Figure 4-2. Suppose Phil and Miss Kay are the only consumers in the market. If the
price is $6, then the
market quantity demanded is
a.
4 units.
b.
6 units.
c.
8 units.
d.
12 units.
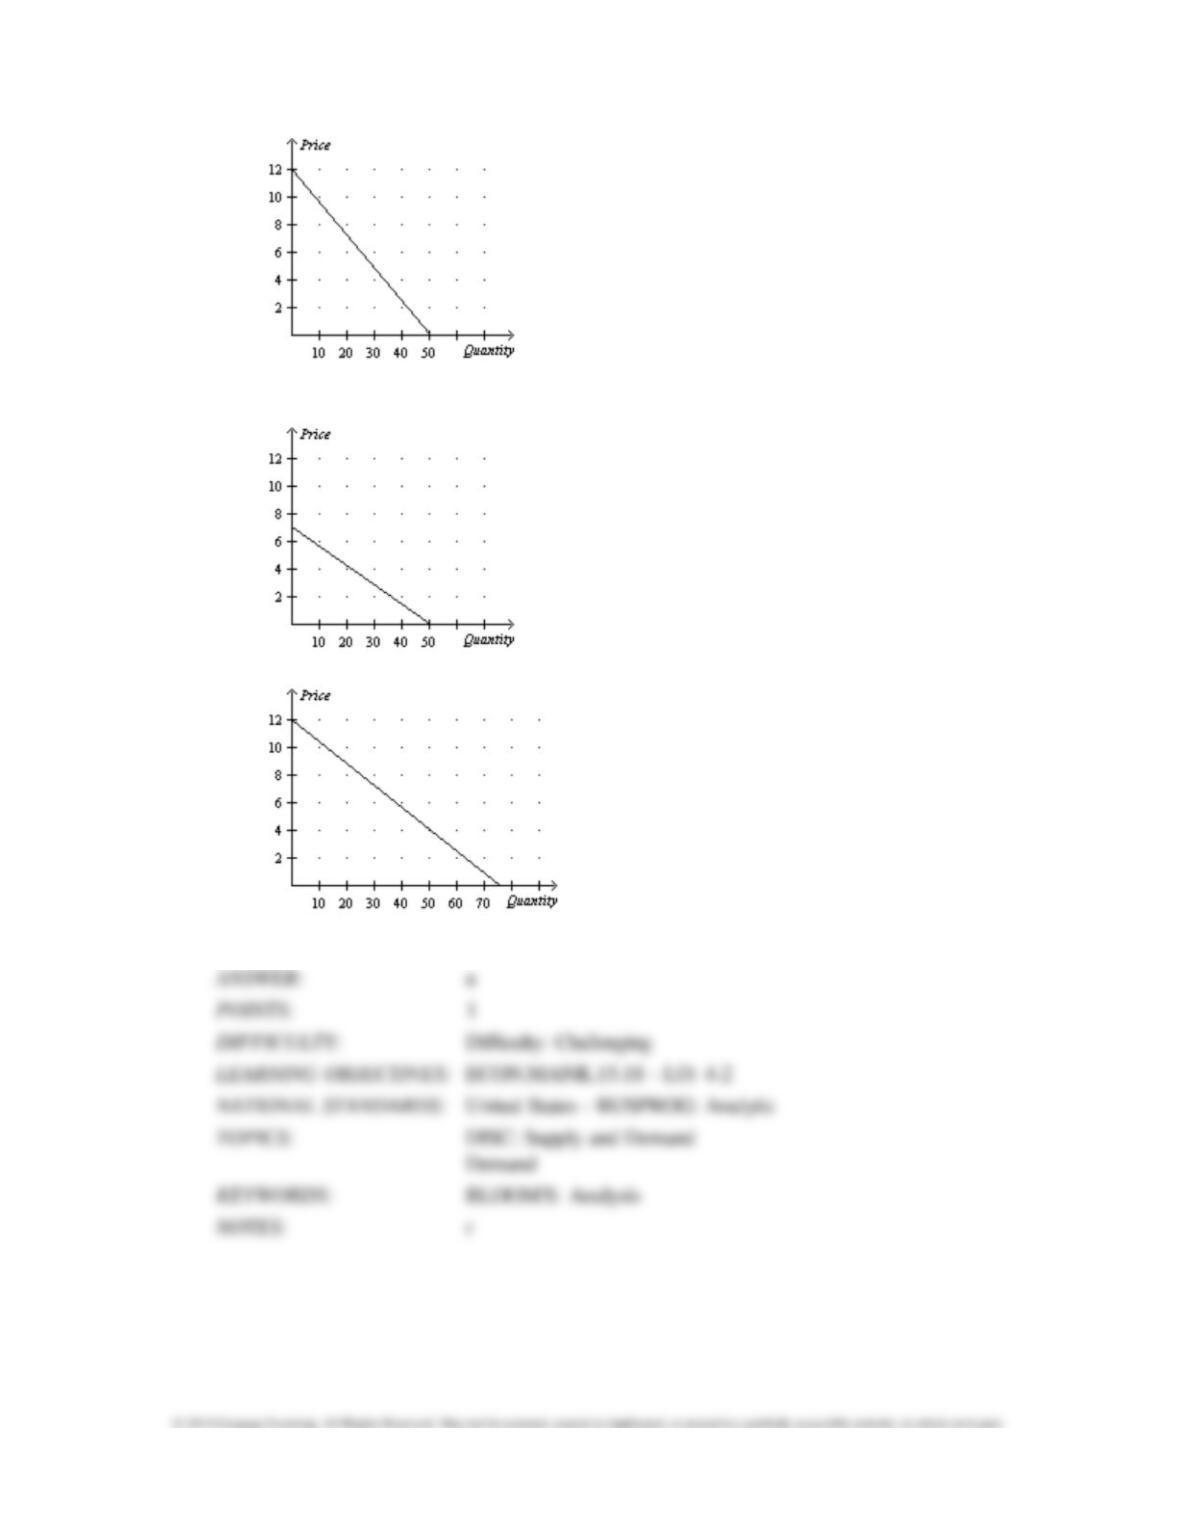
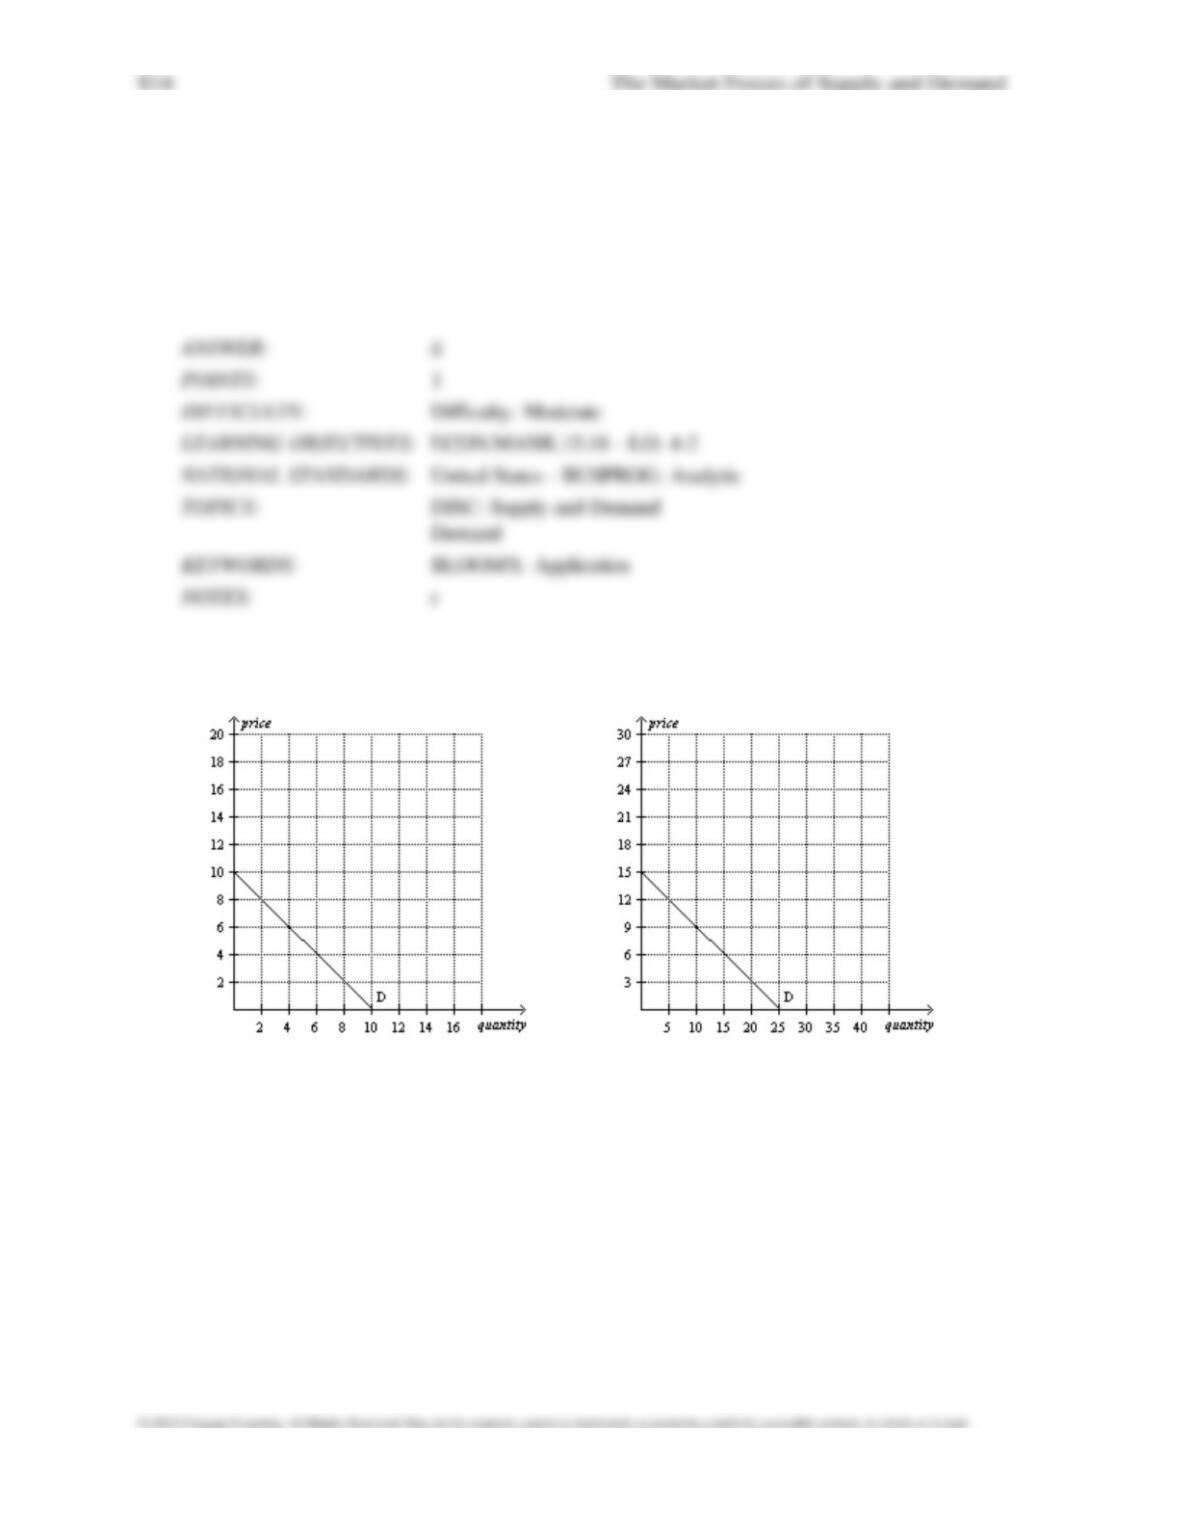
Figure 4-3
Consumer 1 Consumer 2