The Market Forces of Supply and Demand 855
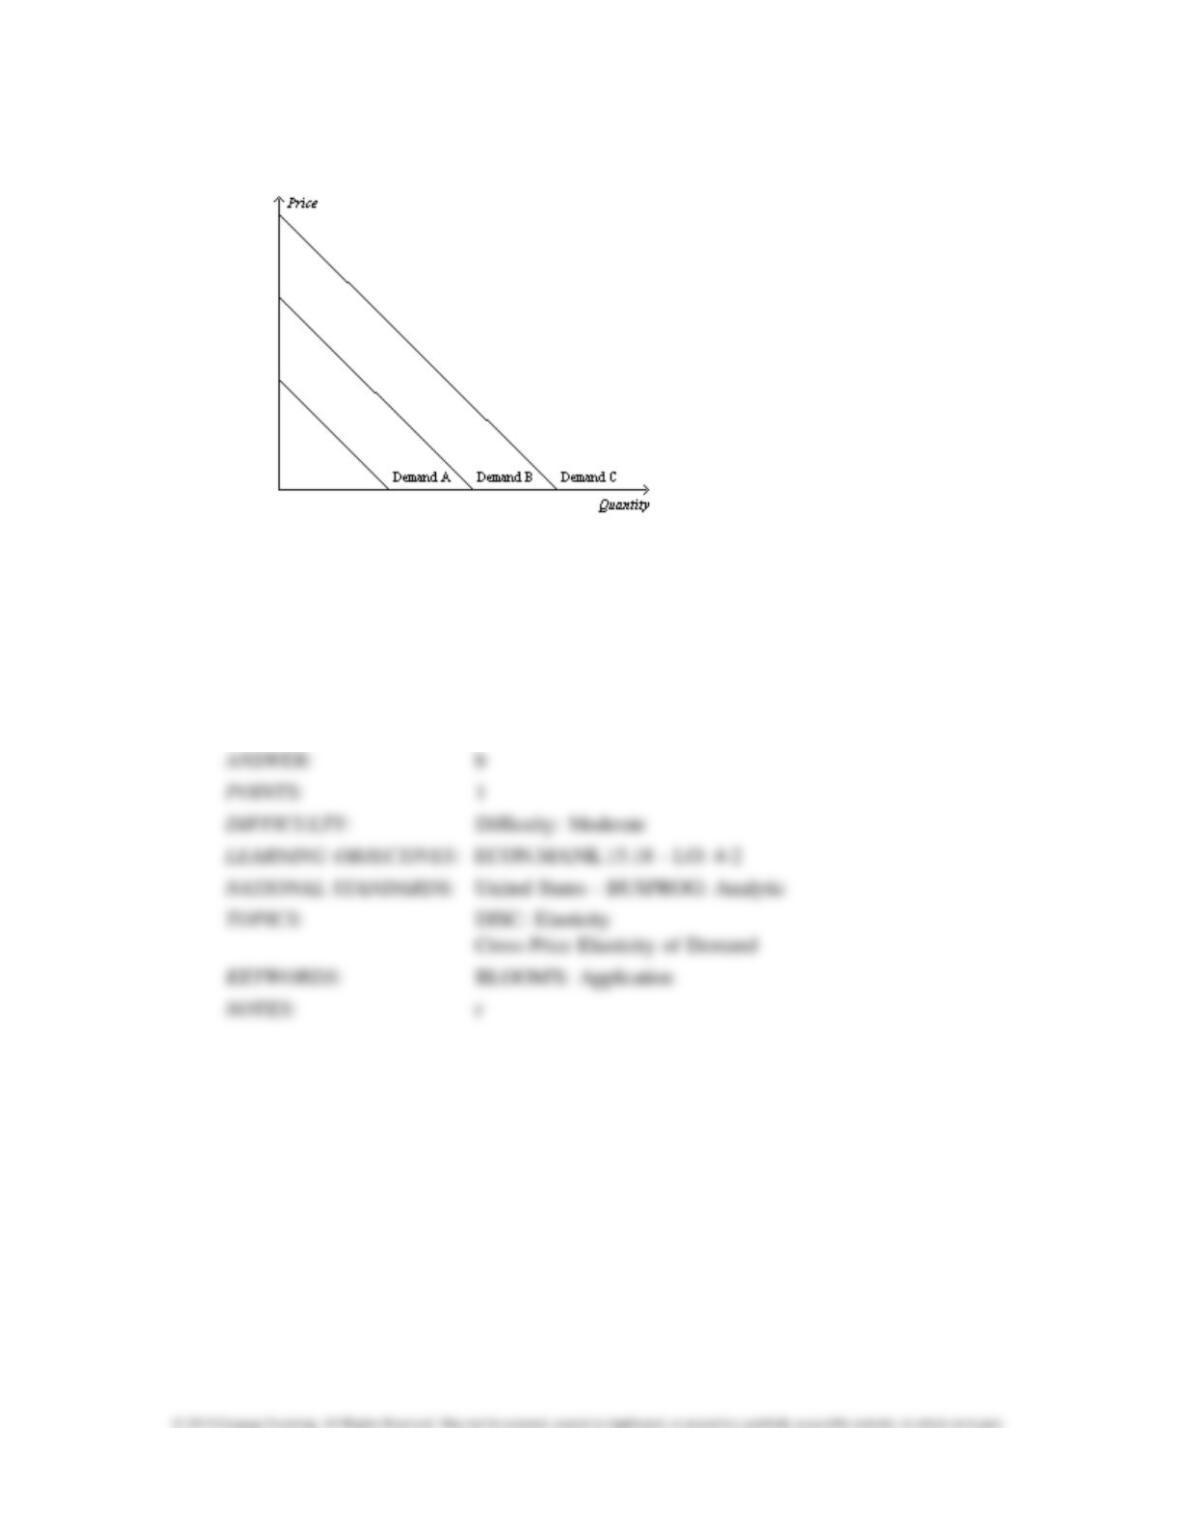
Figure 4-5
146.
Refer to Figure 4-5. Which of the following would cause the demand curve to shift from
Demand B to Demand
C in the market for mattresses?
a.
a decrease in the price of mattresses
b.
a decrease in the price of custom wooden sleigh bed frames
c.
a change in consumer tastes away from wooden bedroom furniture
d.
a decrease in the number of people in the United States
147.
Refer to Figure 4-5. Which of the following would cause the demand curve to shift from
Demand C to Demand
A in the market for DVDs?
a.
an increase in the price of DVDs
b.
a decrease in the price of DVD players
c.
a change in consumer preferences toward watching movies in movie theaters rather than at
home
d.
an expectation by buyers that their incomes will increase in the very near future
148.
Refer to Figure 4-5. Which of the following would cause the demand curve to shift from
Demand C to Demand
A in the market for tennis balls in the United States?
a.
an increase in the price of tennis balls
b.
a decrease in the price of tennis racquets
c.
an expectation by buyers that their incomes will increase in the very near future
d.
a decrease in the number of people in the United States under age 70
149.
Refer to Figure 4-5. Which of the following would cause the demand curve to shift from
Demand A to Demand
B in the market for golf balls in the United States?
a.
a decrease in the price of golf balls
b.
an increase in the price of green fees
c.
an expectation by buyers that their incomes will increase in the very near future
d.
a change in consumer tastes away from golf and toward tennis
150.
Refer to Figure 4-5. Which of the following would cause the demand curve to shift from
Demand A to Demand
B in the market for oranges in the United States?
a.
a freeze in Florida
b.
a technological advance that allows oranges to ripen faster
c.
a decrease in the price of apples
d.
an announcement by the FDA that oranges prevent heart disease
151.
Refer to Figure 4-5. Which of the following would cause the demand curve to shift from
Demand B to Demand
A in the market for oranges in the United States?
a.
a freeze in Florida
b.
a technological advance that allows oranges to ripen faster
c.
a decrease in the price of apples
d.
an announcement by the FDA that oranges prevent heart disease
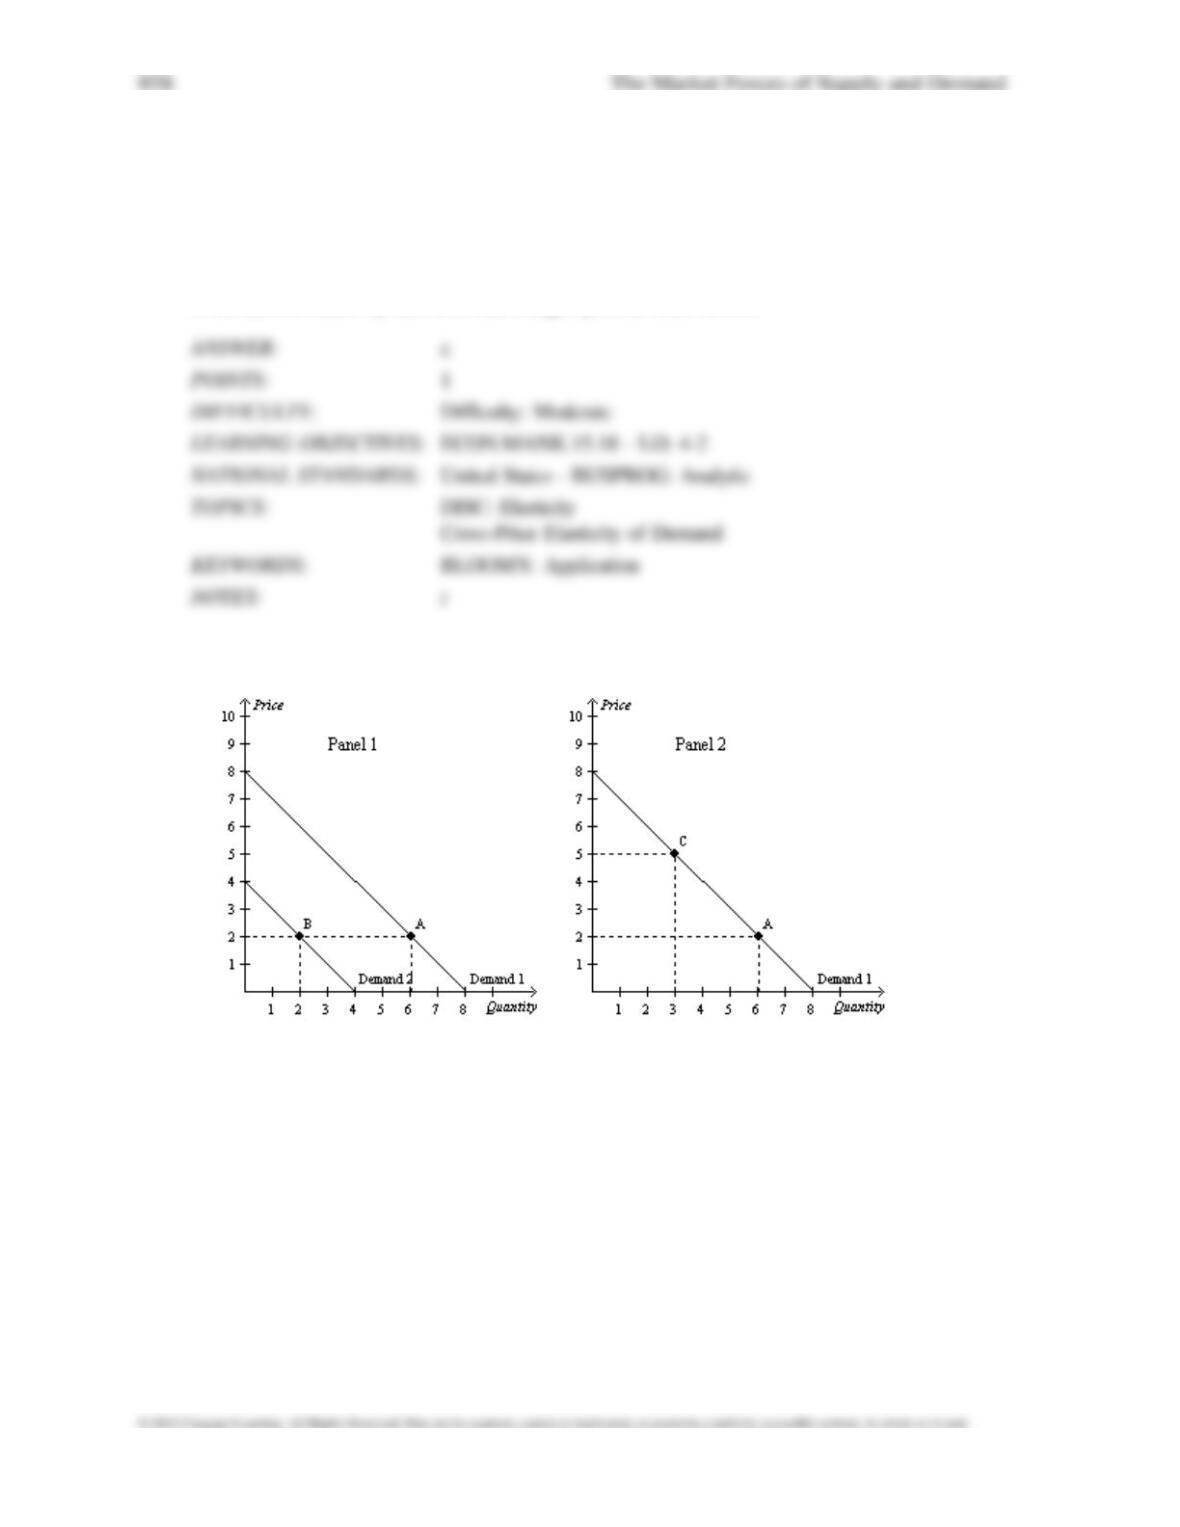
Figure 4-6
The Market Forces of Supply and Demand 859
152.
Refer to Figure 4-6. Suppose that the federal government is concerned about obesity in the
United States. Congress is considering two plans. One would require “junk food” producers to
include warning labels on all junk food. The other would impose a tax on all products considered
to be junk food. If the warning labels are successful, we could illustrate the plan as producing a
movement from
a.
Point A to Point B in Panel 1.
b.
Point B to Point A in Panel 1.
c.
Point A to Point C in Panel 2.
d.
Point C to Point A in Panel 2.
153.
Refer to Figure 4-6. Suppose that the federal government is concerned about obesity in the
United States. Congress is considering two plans. One would require “junk food” producers to
include warning labels on all junk food. The other would impose a tax on all products considered
to be junk food. We could illustrate the tax as producing a movement from
a.
Point A to Point B in Panel 1.
b.
Point B to Point A in Panel 1.
c.
Point A to Point C in Panel 2.
d.
Point C to Point A in Panel 2.
860 The Market Forces of Supply and Demand
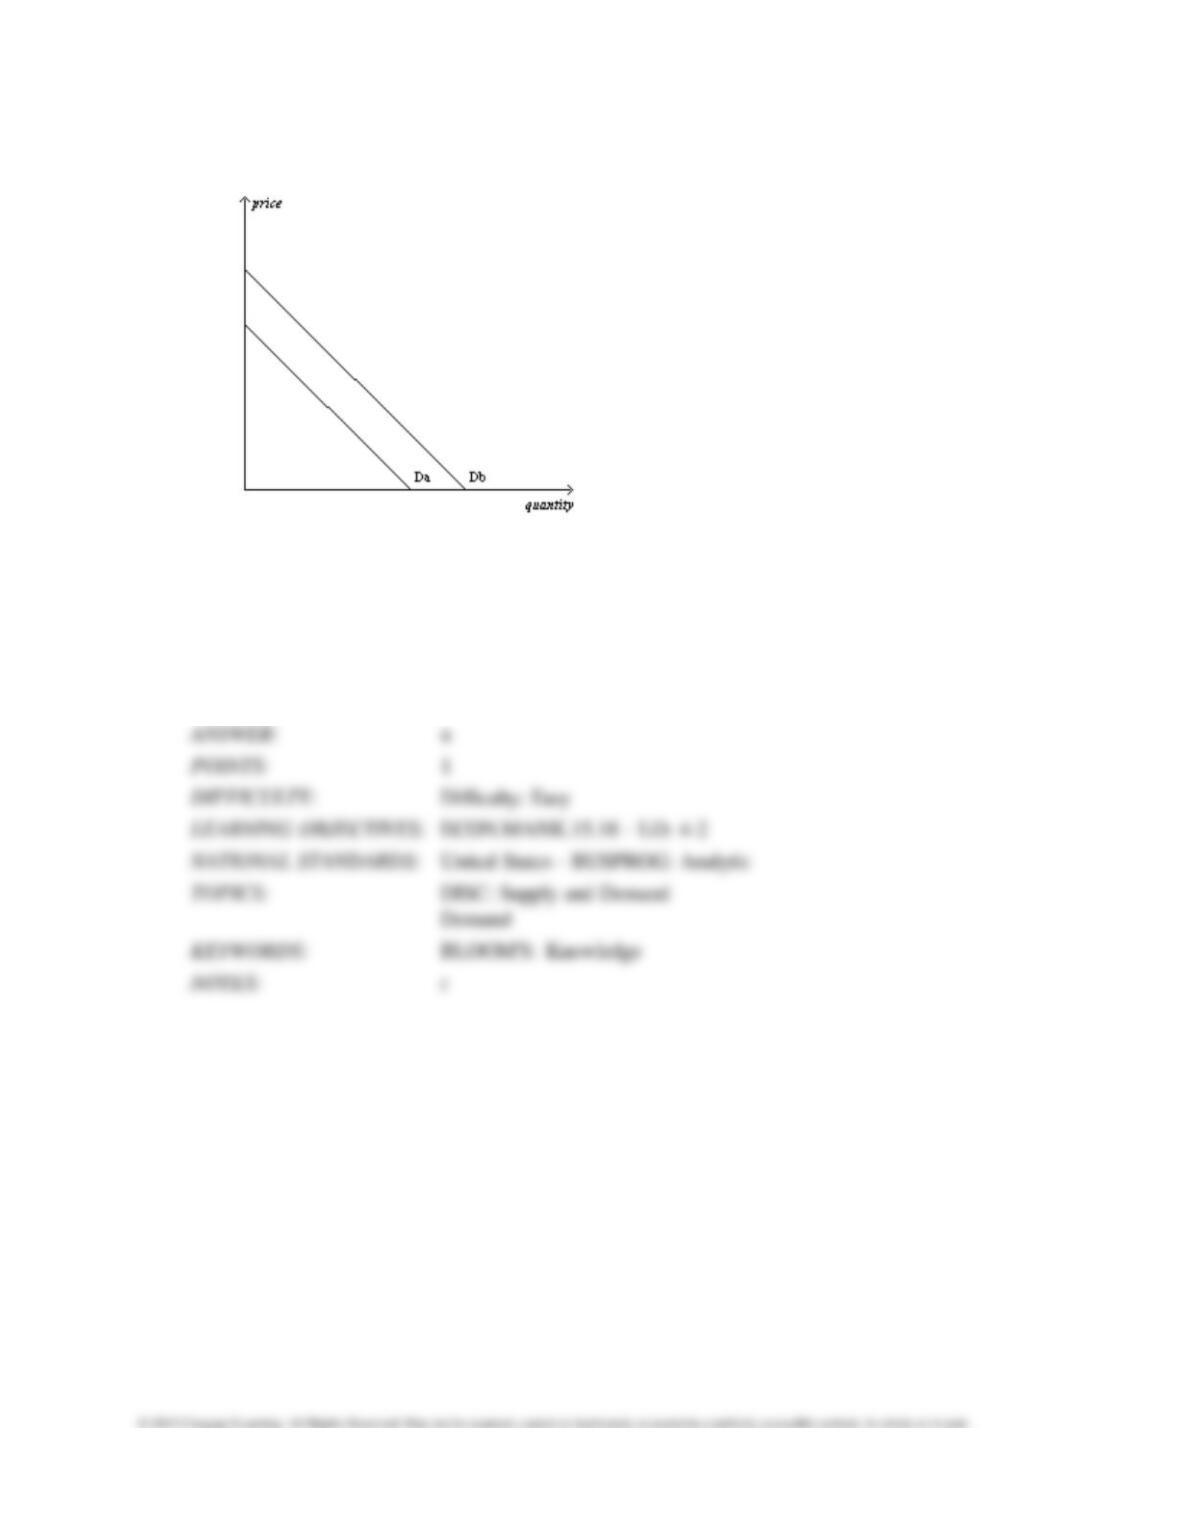
Figure 4-7
154.
Refer to Figure 4-7. The shift from Da to Db is called
a.
an increase in demand.
b.
a decrease in demand.
c.
a decrease in quantity demanded.
d.
an increase in quantity demanded.
The Market Forces of Supply and Demand 861
155.
Refer to Figure 4-7. The shift from Db to Da is called
a.
an increase in demand.
b.
a decrease in demand.
c.
a decrease in quantity demanded.
d.
an increase in quantity demanded.
156.
Refer to Figure 4-7. If the demand curve for Good X shifts from Db to Da, then
a.
firms would be willing to supply more of Good X than before at each possible price.
b.
people are willing to buy less of Good X than before at each possible price.
c.
people’s incomes must have increased.
d.
the price of Good X has increased.
157.
Refer to Figure 4-7. If the demand curve for Good X shifts from Da to Db, then
a.
firms would be willing to supply less of Good X than before at each possible price.
b.
people are willing to buy more of Good X than before at each possible price.
c.
people’s incomes must have decreased.
d.
the price of Good X has decreased.
158.
Refer to Figure 4-7. The movement from Db to Da could be caused by
a.
a decrease in price.
b.
an increase in the price of a complement.
c.
a technological advance.
d.
an increase in the price of a substitute.
159.
Refer to Figure 4-7. The movement from Da to Db could be caused by
a.
a decrease in price.
b.
a decrease in income, assuming the good is inferior.
c.
buyers expecting the price of the good to fall in the near future.
d.
an increase in the price of a complement.
160.
Refer to Figure 4-7. The movement from Da to Db in the market for potato chips could be
caused by a(n)
a.
decrease in the price of potato chips.
b.
decrease in income, assuming that potato chips are a normal good.
c.
announcement by the FDA that potato chips cause cancer.
d.
increase in the price of a pretzels.
161.
Refer to Figure 4-7. The movement from Db to Da in the market for potato chips could be
caused by a(n)
a.
decrease in the price of potato chips.
b.
decrease in income, assuming that potato chips are a normal good.
c.
announcement by the FDA that potato chips lower cholesterol.
d.
increase in the price of a pretzels.
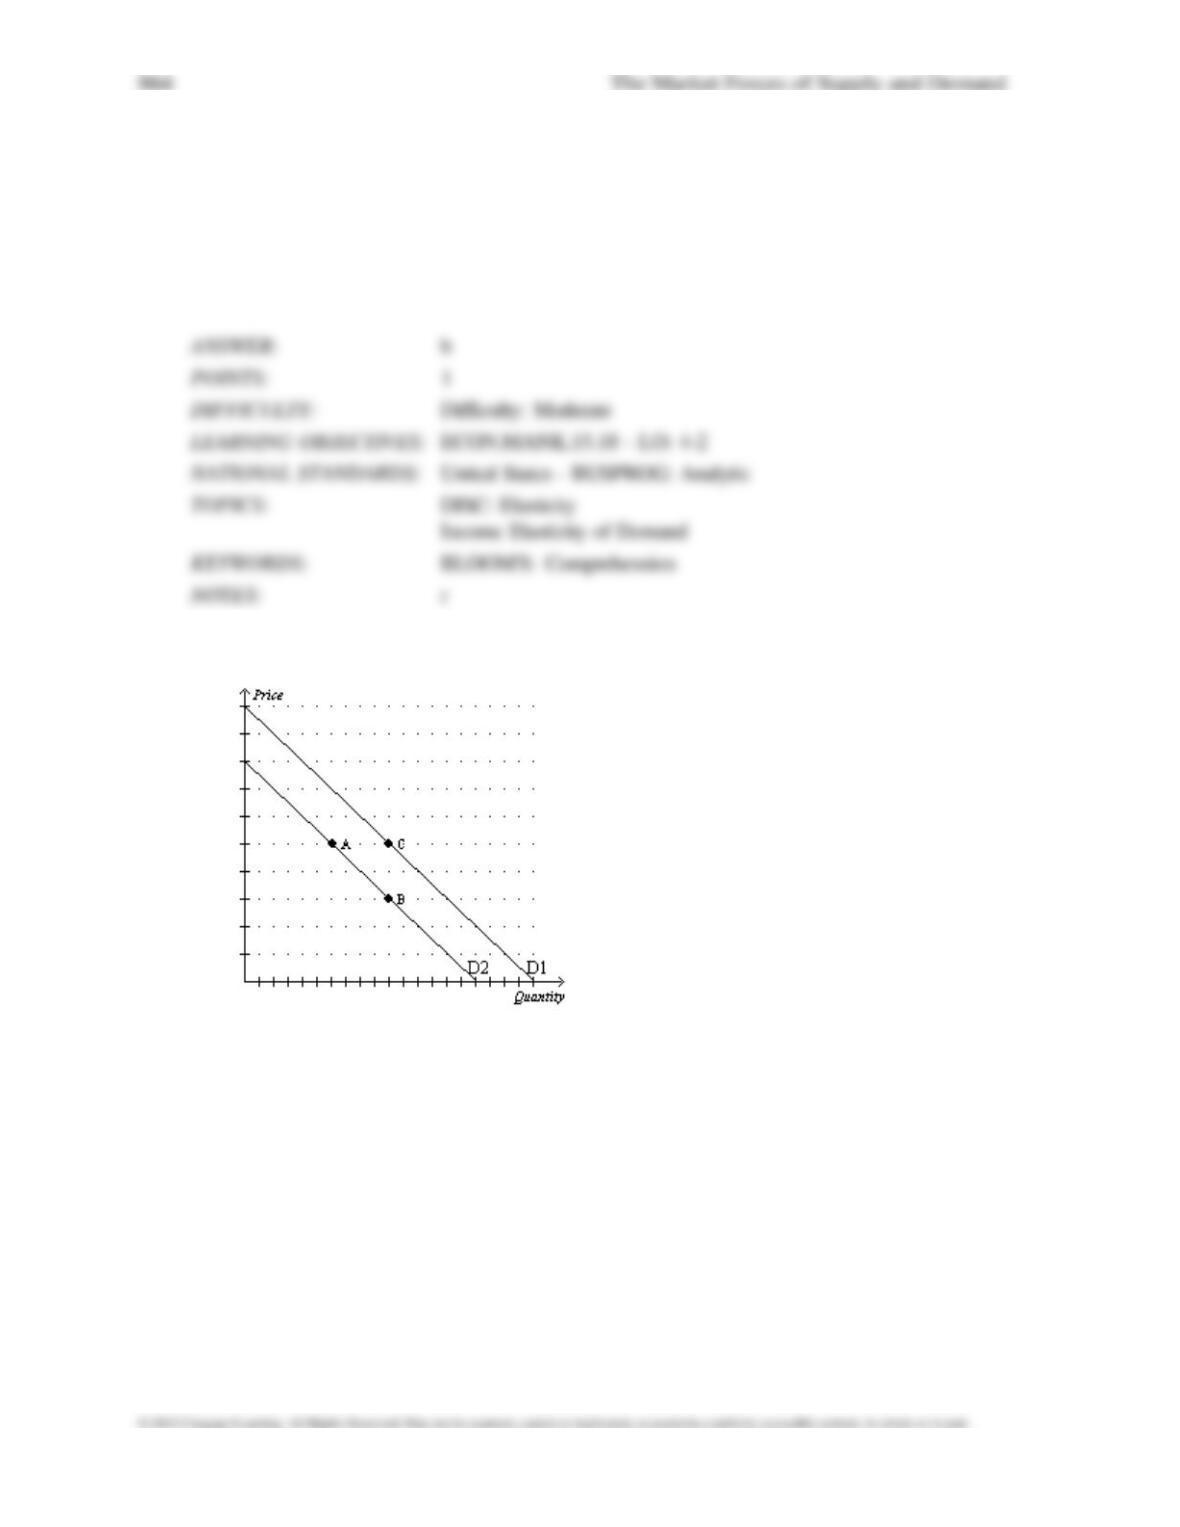
Figure 4-8
The Market Forces of Supply and Demand 865
162.
Refer to Figure 4-8. Suppose the figure shows the market demand for laptop computers.
Suppose the price of
wireless printers, a complementary good, decreases. Which of the following
changes would occur?
a.
a movement along D2 from point A to point B
b.
a movement along D2 from point B to point A
c.
a shift from D1 to D2
d.
a shift from D2 to D1
163.
Refer to Figure 4-8. Suppose the figure shows the market demand for laptop computers.
Suppose the price of
wireless keyboards, a complementary good, increases. Which of the
following changes would occur?
a.
a movement along D2 from point A to point B
b.
a movement along D2 from point B to point A
c.
a shift from D1 to D2
d.
a shift from D2 to D1
164.
Refer to Figure 4-8. Suppose the figure shows the market demand for Big Box e-readers.
Suppose the price of the leading competitor’s ereaders, a substitute good, decreases. Which of
the following changes would occur?
a.
a movement along D2 from point A to point B
b.
a movement along D2 from point B to point A
c.
a shift from D1 to D2
d.
a shift from D2 to D1
165.
Refer to Figure 4-8. Suppose the figure shows the market demand for coffee. Suppose the
price of tea, a
substitute good, increases. Which of the following changes would occur?
a.
a movement along D2 from point A to point B
b.
a movement along D2 from point B to point A
c.
a shift from D1 to D2
d.
a shift from D2 to D1
166.
For the general population, a 10 percent increase in the price of cigarettes leads to a
a.
1 percent reduction in the quantity demanded of cigarettes.
b.
4 percent reduction in the quantity demanded of cigarettes.
c.
10 percent reduction in the quantity demanded of cigarettes.
d.
12 percent reduction in the quantity demanded of cigarettes.
167.
For teenagers, a 10 percent increase in the price of cigarettes leads to a
a.
1 percent reduction in the quantity demanded of cigarettes.
b.
4 percent reduction in the quantity demanded of cigarettes.
c.
10 percent reduction in the quantity demanded of cigarettes.
d.
12 percent reduction in the quantity demanded of cigarettes.
168.
The belief that tobacco is a “gateway drug” is consistent with
a.
the idea that tobacco and marijuana are substitutes.
b.
the idea that an increase in income causes a decrease in the demand for tobacco and an
increase in the
demand for marijuana.
c.
the idea that lower cigarette prices are associated with less use of marijuana.
d.
most of the available evidence.
169.
Most studies indicate that tobacco and marijuana tend to be
a.
substitutes.
b.
complements.
c.
unrelated because one good is legal while the other one is illegal.
d.
inferior goods.
The Market Forces of Supply and Demand 869
170.
Opponents of cigarette taxes often argue that tobacco and marijuana are substitutes so that high
cigarette prices
a.
encourage marijuana use, and the evidence supports this argument.
b.
encourage marijuana use, but the evidence does not support this argument.
c.
discourage marijuana use, and the evidence supports this argument.
d.
discourage marijuana use, but the evidence does not support this argument.
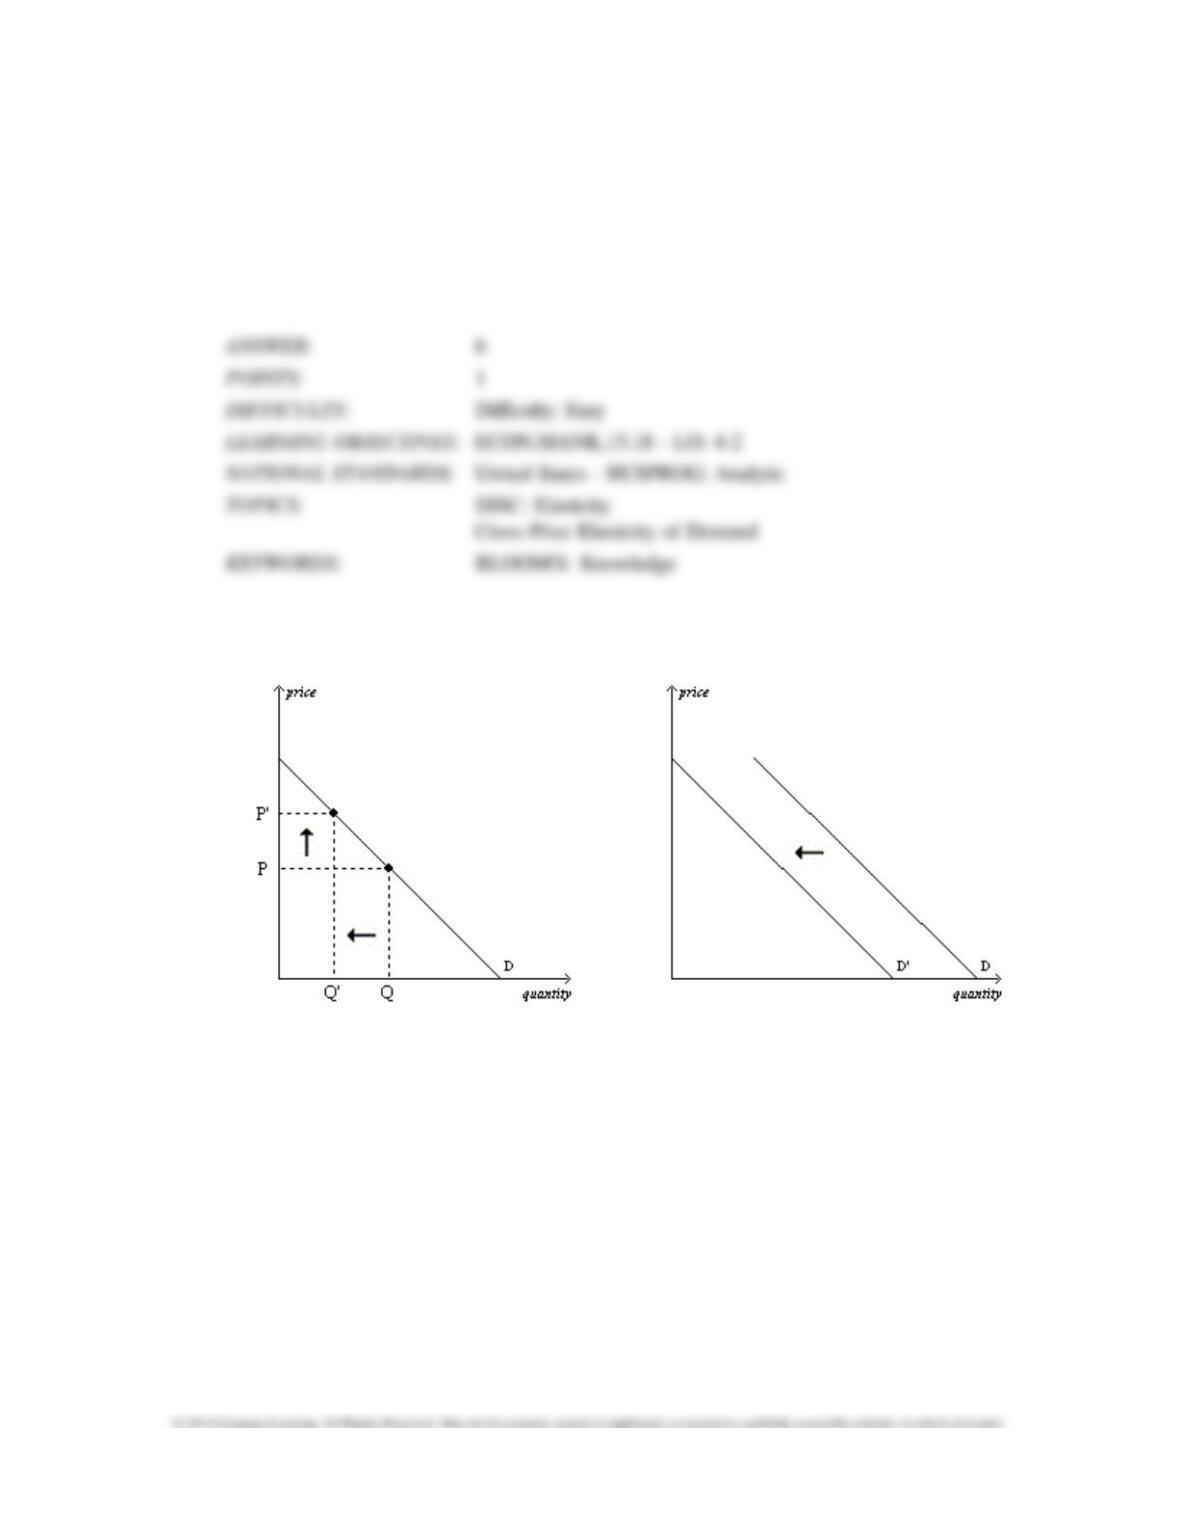
Figure 4-9
Panel (a) Panel (b)
171.
Refer to Figure 4-9. The graphs show the demand for cigarettes. In Panel (a), the arrows are
consistent with
which of the following events?
a.
The price of marijuana, a complement to cigarettes, increased.
b.
Mandatory health warnings were placed on cigarette packages.
c.
Several foreign countries banned U.S. cigarettes in their countries.
d.
A tax was placed on cigarettes.
172.
Refer to Figure 4-9. The graphs show the demand for cigarettes. In Panel (a), the arrows are
consistent with
which of the following events?
a.
Tobacco and marijuana are complements, and the price of marijuana decreased.
b.
Tobacco is a “gateway drug,” and the price of marijuana increased.
c.
The price of cigarettes increased.
d.
The arrows are consistent with all of these events.
173.
Refer to Figure 4-9. The graphs show the demand for cigarettes. In Panel (b), the arrows are
consistent with
which of the following events?
a.
an increase in the price of cigarettes
b.
placing a tax on cigarettes
c.
the prohibition of cigarette advertisements on television
d.
decreasing the price of marijuana, given that tobacco and marijuana are complements
Multiple Choice – Section 03: Supply
1.
The quantity supplied of a good is the amount that
a.
buyers are willing and able to purchase.
b.
sellers are able to produce.
c.
buyers and sellers agree will be brought to market.
d.
sellers are willing and able to sell.

2.
If the price of a good is low,
a.
firms would increase profit by increasing output.
b.
the quantity supplied of the good could be zero.
c.
the supply curve for the good will shift to the left.
d.
firms can and should raise the price of the product.
3.
A decrease in the price of a good will
a.
increase supply.
b.
decrease supply.
c.
increase quantity supplied.
d.
decrease quantity supplied.
4.
An increase in the price of a good will
a.
increase supply.
b.
decrease supply.
c.
increase quantity supplied.
d.
decrease quantity supplied.
5.
When the price of a good or service changes,
a.
the demand curve shifts in the opposite direction.
b.
the supply curve shifts in the opposite direction.
c.
the supply curve shifts in the same direction.
d.
there is a movement along a given supply curve.
6.
A movement along the supply curve might be caused by a change in
a.
production technology.
b.
input prices.
c.
expectations about future prices.
d.
the price of the good or service that is being supplied.
7.
Which of the following would cause a movement along the supply curve for cupcakes?
a.
an improvement in technology for commercial mixers
b.
a decrease in the price of cupcakes
c.
an increase in the price of cake flour
d.
All of the above are correct.