Unlock document.
This document is partially blurred.
Unlock all pages and 1 million more documents.
Get Access
The Market Forces of Supply and Demand 875
8.
Holding the nonprice determinants of supply constant, a change in price would
a.
result in either a decrease in supply or an increase in supply.
b.
result in a movement along a stationary supply curve.
c.
result in a shift of demand.
d.
have no effect on the quantity supplied.
9.
An increase in the price of a good would
a.
increase the supply of the good.
b.
increase the amount purchased by buyers.
c.
give producers an incentive to produce more.
d.
decrease both the quantity demanded of the good and the quantity supplied of the good.

10.
An decrease in the price of oranges would lead to a(n)
a.
increased supply of oranges.
b.
increase in the prices of inputs used in orange production.
c.
a movement down and to the left along the supply curve for oranges.
d.
a movement up and to the right along the supply curve for oranges.
11.
An increase in the price of blueberries would lead to a(n)
a.
increased supply of blueberries.
b.
a movement up and to the right along the supply curve for blueberries.
c.
a movement down and to the left along the supply curve for blueberries.
d.
Both a and b are correct.

The Market Forces of Supply and Demand 877
12.
An increase in quantity supplied
a.
results in a movement downward and to the left along a fixed supply curve.
b.
results in a movement upward and to the right along a fixed supply curve.
c.
shifts the supply curve to the left.
d.
shifts the supply curve to the right.
13.
A decrease in quantity supplied
a.
results in a movement downward and to the left along a fixed supply curve.
b.
results in a movement upward and to the right along a fixed supply curve.
c.
shifts the supply curve to the left.
d.
shifts the supply curve to the right.
878 The Market Forces of Supply and Demand
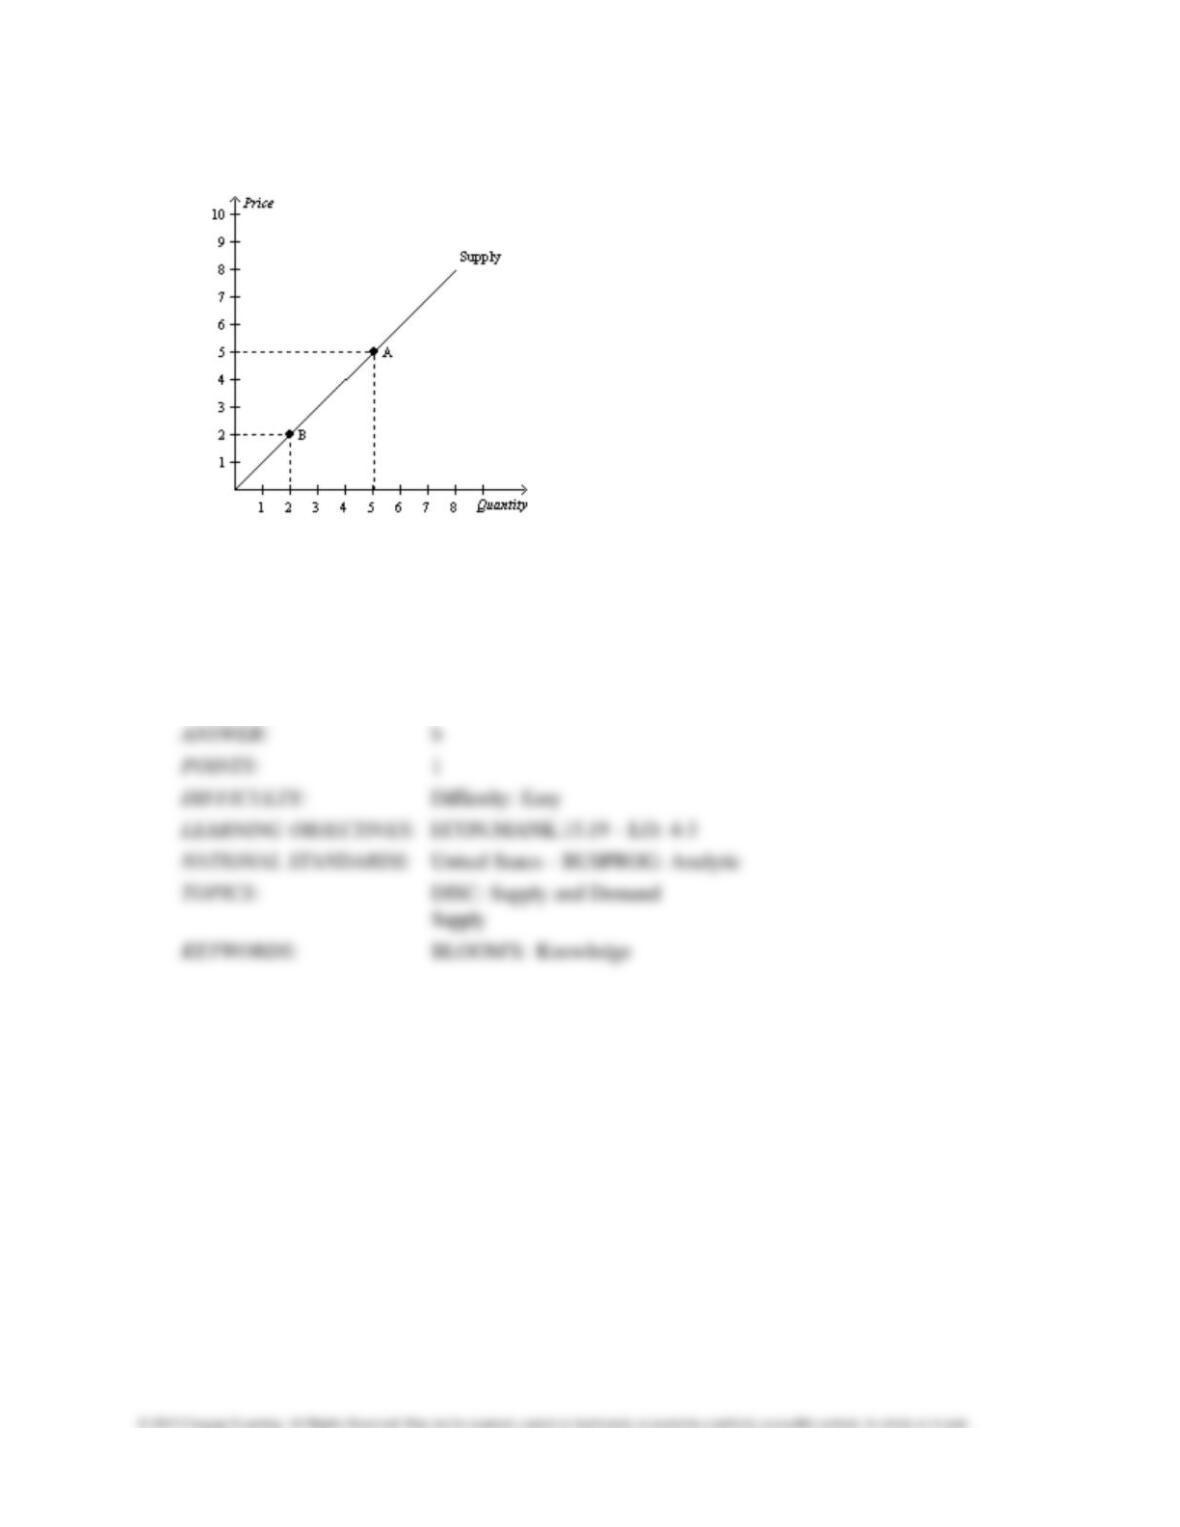
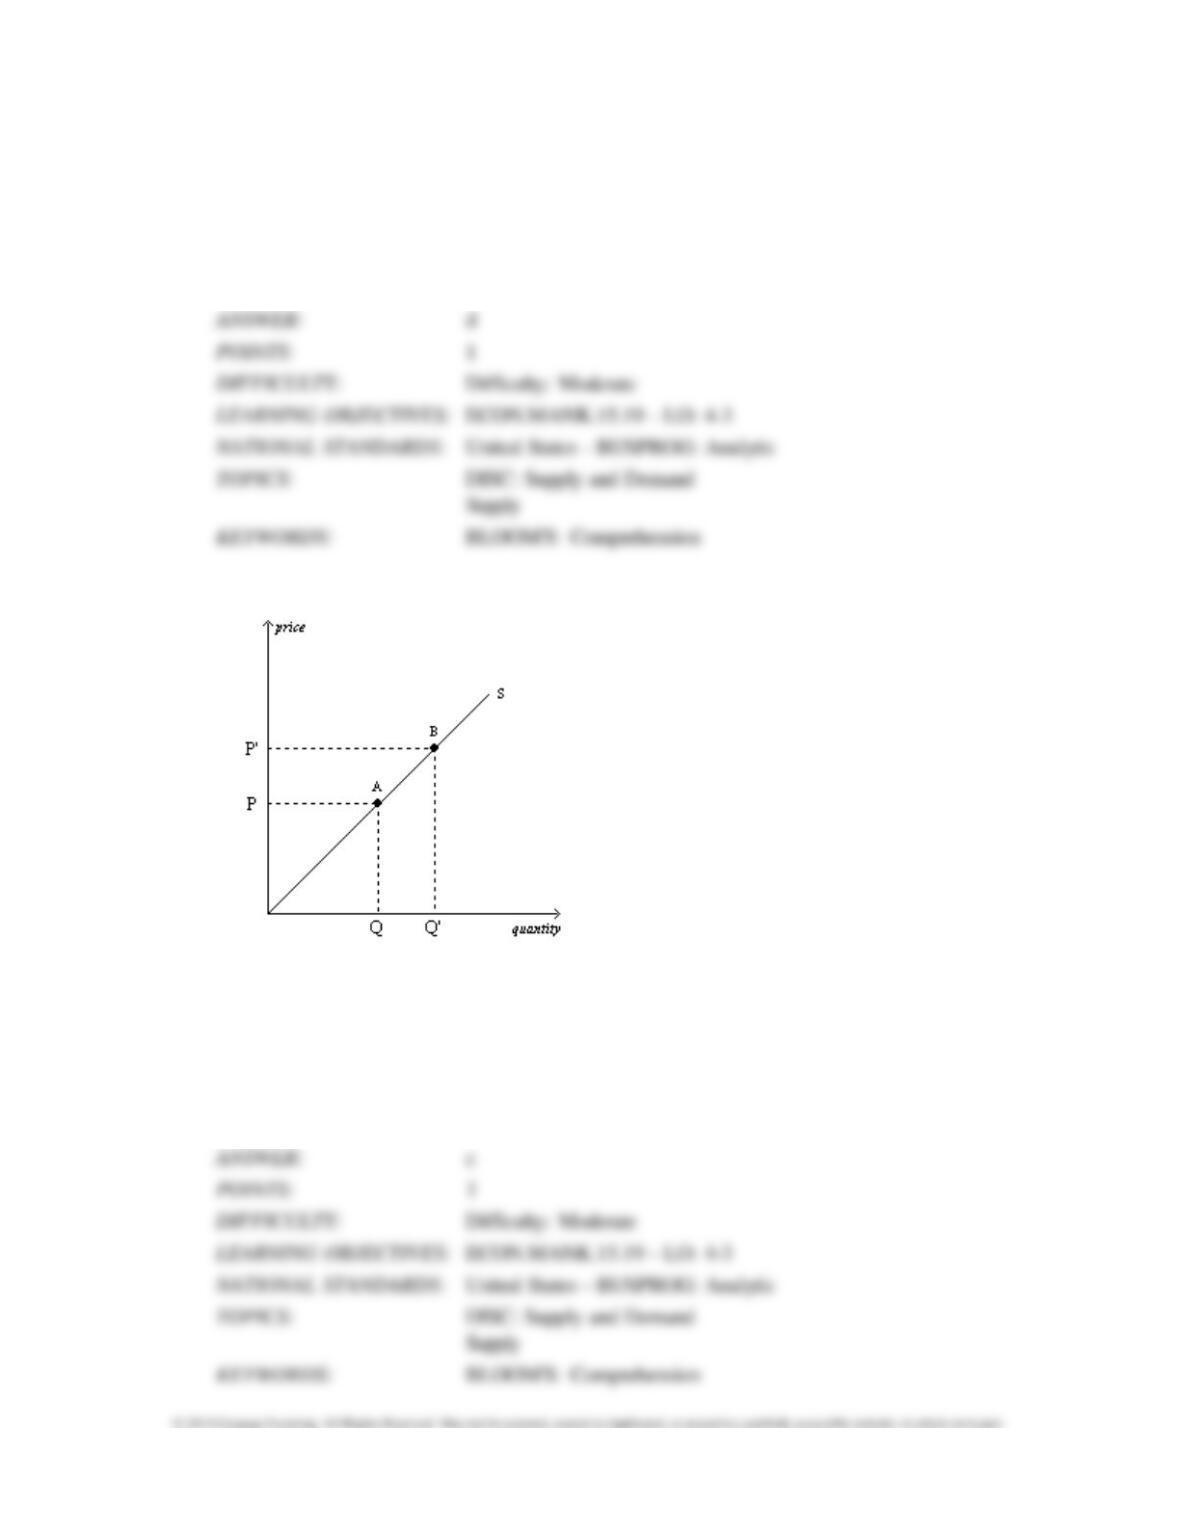
Figure 4-10
14.
Refer to Figure 4-10. The movement from Point A to Point B represents a(n)
a.
shift in the supply curve.
b.
decrease in the quantity supplied.
c.
increase in the quantity supplied.
d.
Both a and b are correct.
The Market Forces of Supply and Demand 879
15.
Refer to Figure 4-10. The movement from Point A to Point B represents a(n)
a.
increase in the price.
b.
decrease in the quantity supplied.
c.
shift in the supply curve.
d.
Both a and b are correct.
16.
“Other things equal, when the price of a good rises, the quantity supplied of the good also rises,
and when the price
falls, the quantity supplied falls as well.” This relationship between price and
quantity supplied
a.
is referred to as the law of supply.
b.
applies only to a few goods in the economy.
c.
is represented by a downward-sloping supply curve.
d.
All of the above are correct.
17.
The law of supply states that, other things equal, when the price of a good
a.
falls, the supply of the good rises.
b.
rises, the quantity supplied of the good rises.
c.
rises, the supply of the good falls.
d.
falls, the quantity supplied of the good rises.
18.
The law of supply states that, other things equal, an increase in
a.
price causes quantity supplied to increase.
b.
price causes quantity supplied to decrease.
c.
quantity supplied causes price to increase.
d.
quantity supplied causes price to decrease.
19.
Other things equal, when the price of a good falls, the
a.
quantity supplied of the good increases.
b.
supply decreases.
c.
quantity supplied of the good decreases.
d.
demand increases.
20.
Which of these statements best represents the law of supply?
a.
When input prices increase, sellers produce less of the good.
b.
When production technology improves, sellers produce less of the good.
c.
When the price of a good decreases, sellers produce less of the good.
d.
When sellers’ supplies of a good increase, the price of the good increases.

21.
A supply curve slopes upward because
a.
as more is produced, total cost of production falls.
b.
an increase in input prices increases supply.
c.
the quantity supplied of most goods and services increases over time.
d.
an increase in price gives producers an incentive to supply a larger quantity.
22.
Which of the following demonstrates the law of supply?
a.
When leather became more expensive, belt producers decreased their supply of belts.
b.
When car production technology improved, car producers increased their supply of cars.
c.
When sweater producers expected sweater prices to rise in the near future, they decreased
their current
supply of sweaters.
d.
When ketchup prices rose, ketchup sellers increased their quantity supplied of ketchup.
The Market Forces of Supply and Demand 883
23.
Which of the following demonstrates the law of supply?
a.
When the price of leather belts rose, leather belt sellers increase their quantity supplied of
leather belts.
b.
When car production technology improved, car producers increased their supply of cars.
c.
When sweater producers expected sweater prices to rise in the near future, they decreased
their current
supply of sweaters.
d.
When ketchup prices rose, ketchup sellers decreased their quantity supplied of ketchup.
24.
The following table contains a supply schedule for a good.
Price
Quantity Supplied
$10
100
$20
Q1
If the law of supply applies to this good, then Q1 could be
a.
0.
b.
50.
c.
100.
d.
150.

25.
A supply schedule is a table that shows the relationship between
a.
price and quantity supplied.
b.
input costs and quantity supplied.
c.
quantity demanded and quantity supplied.
d.
profit and quantity supplied.
26.
Which of the following is not held constant in a supply schedule?
a.
production technology
b.
the price of the good
c.
the prices of inputs
d.
expectations
The Market Forces of Supply and Demand 885
27.
The difference between a supply schedule and a supply curve is that a supply schedule
a.
incorporates demand and a supply curve does not.
b.
incorporates profit and a supply curve does not.
c.
can shift, but a supply curve cannot shift.
d.
is a table, and a supply curve is drawn on a graph.
Figure 4-11
28.
Refer to Figure 4-11. The movement from point A to point B on the graph is called
a.
a decrease in supply.
b.
an increase in supply.
c.
an increase in the quantity supplied.
d.
a decrease in the quantity supplied.
29.
Refer to Figure 4-11. The movement from point A to point B on the graph is caused by
a.
a decrease in the price of the good.
b.
an increase in the price of the good.
c.
an advance in production technology.
d.
a decrease in input prices.
30.
Refer to Figure 4-11. The movement from point A to point B on the graph represents
a.
an increased willingness and ability on the part of suppliers to supply the good at each possible
price.
b.
an increase in the number of suppliers.
c.
a decrease in the price of a relevant input.
d.
an increase in the price of the good that is being supplied and the suppliers’ responses to that
price change.
31.
The supply curve for a good is a line that relates
a.
profit and quantity supplied.
b.
quantity supplied and quantity demanded.
c.
price and quantity supplied.
d.
price and profit.
32.
The line that relates the price of a good and the quantity supplied of that good is called the supply
a.
schedule, and it usually slopes upward.
b.
schedule, and it usually slopes downward.
c.
curve, and it usually slopes upward.
d.
curve, and it usually slopes downward.
33.
When we move along a given supply curve,
a.
only price is held constant.
b.
technology and price are held constant.
c.
all nonprice determinants of supply are held constant.
d.
all determinants of quantity supplied are held constant.
34.
Once the supply curve for a product or service is drawn, it
a.
remains stable over time.
b.
can shift either rightward or leftward.
c.
is possible to move along the curve, but the curve will not shift.
d.
tends to become steeper over time.
35.
If something happens to alter the quantity supplied at any given price, then
a.
we move along the supply curve.
b.
the supply curve shifts.
c.
the supply curve becomes steeper.
d.
the supply curve becomes flatter.
36.
An increase in supply is represented by a
a.
movement downward and to the left along a supply curve.
b.
movement upward and to the right along a supply curve.
c.
rightward shift of a supply curve.
d.
leftward shift of a supply curve.

37.
A decrease in supply is represented by a
a.
movement downward and to the left along a supply curve.
b.
movement upward and to the right along a supply curve.
c.
rightward shift of a supply curve.
d.
leftward shift of a supply curve.
38.
A leftward shift of a supply curve is called a(n)
a.
increase in supply.
b.
decrease in supply.
c.
decrease in quantity supplied.
d.
increase in quantity supplied.
The Market Forces of Supply and Demand 891
39.
A rightward shift of a supply curve is called a(n)
a.
increase in supply.
b.
decrease in supply.
c.
decrease in quantity supplied.
d.
increase in quantity supplied.
40.
A movement upward and to the right along a supply curve is called a(n)
a.
increase in supply.
b.
decrease in supply.
c.
decrease in quantity supplied.
d.
increase in quantity supplied.

41.
A movement downward and to the left along a supply curve is called a(n)
a.
increase in supply.
b.
decrease in supply.
c.
decrease in quantity supplied.
d.
increase in quantity supplied.
42.
When quantity supplied decreases at every possible price, we know that the supply curve has
a.
shifted to the left.
b.
shifted to the right.
c.
not shifted; rather, we have moved along the supply curve to a new point on the same curve.
d.
not shifted; rather, the supply curve has become flatter.
43.
When quantity supplied increases at every possible price, we know that the supply curve has
a.
shifted to the left.
b.
shifted to the right.
c.
not shifted; rather, we have moved along the supply curve to a new point on the same curve.
d.
not shifted; rather, the supply curve has become flatter.
44.
The supply curve for stand up paddle boards
a.
shifts when the price of stand up paddle boards changes because the price of stand up paddle
boards is
measured on the vertical axis of the graph.
b.
shifts when the price of stand up paddle boards changes because the quantity supplied of stand
up paddle
boards is measured on the horizontal axis of the graph.
c.
does not shift when the price of stand up paddle boards changes because the price of stand up
paddle boards
is measured on the vertical axis of the graph.
d.
does not shift when the price of stand up paddle boards changes because the price of stand up
paddle boards
is measured on the horizontal axis of the graph.

45.
Which of the following changes would not shift the supply curve for a good or service?
a.
a change in production technology
b.
a change in the price of the good or service
c.
a change in expectations about the future price of the good or service
d.
a change in input prices
46.
Which of the following would not shift the supply curve for mp3 players?
a.
an increase in the price of mp3 players
b.
a decrease in the number of sellers of mp3 players
c.
an increase in the price of plastic, an input into the production of mp3 players
d.
an improvement in the technology used to produce mp3 players


