40
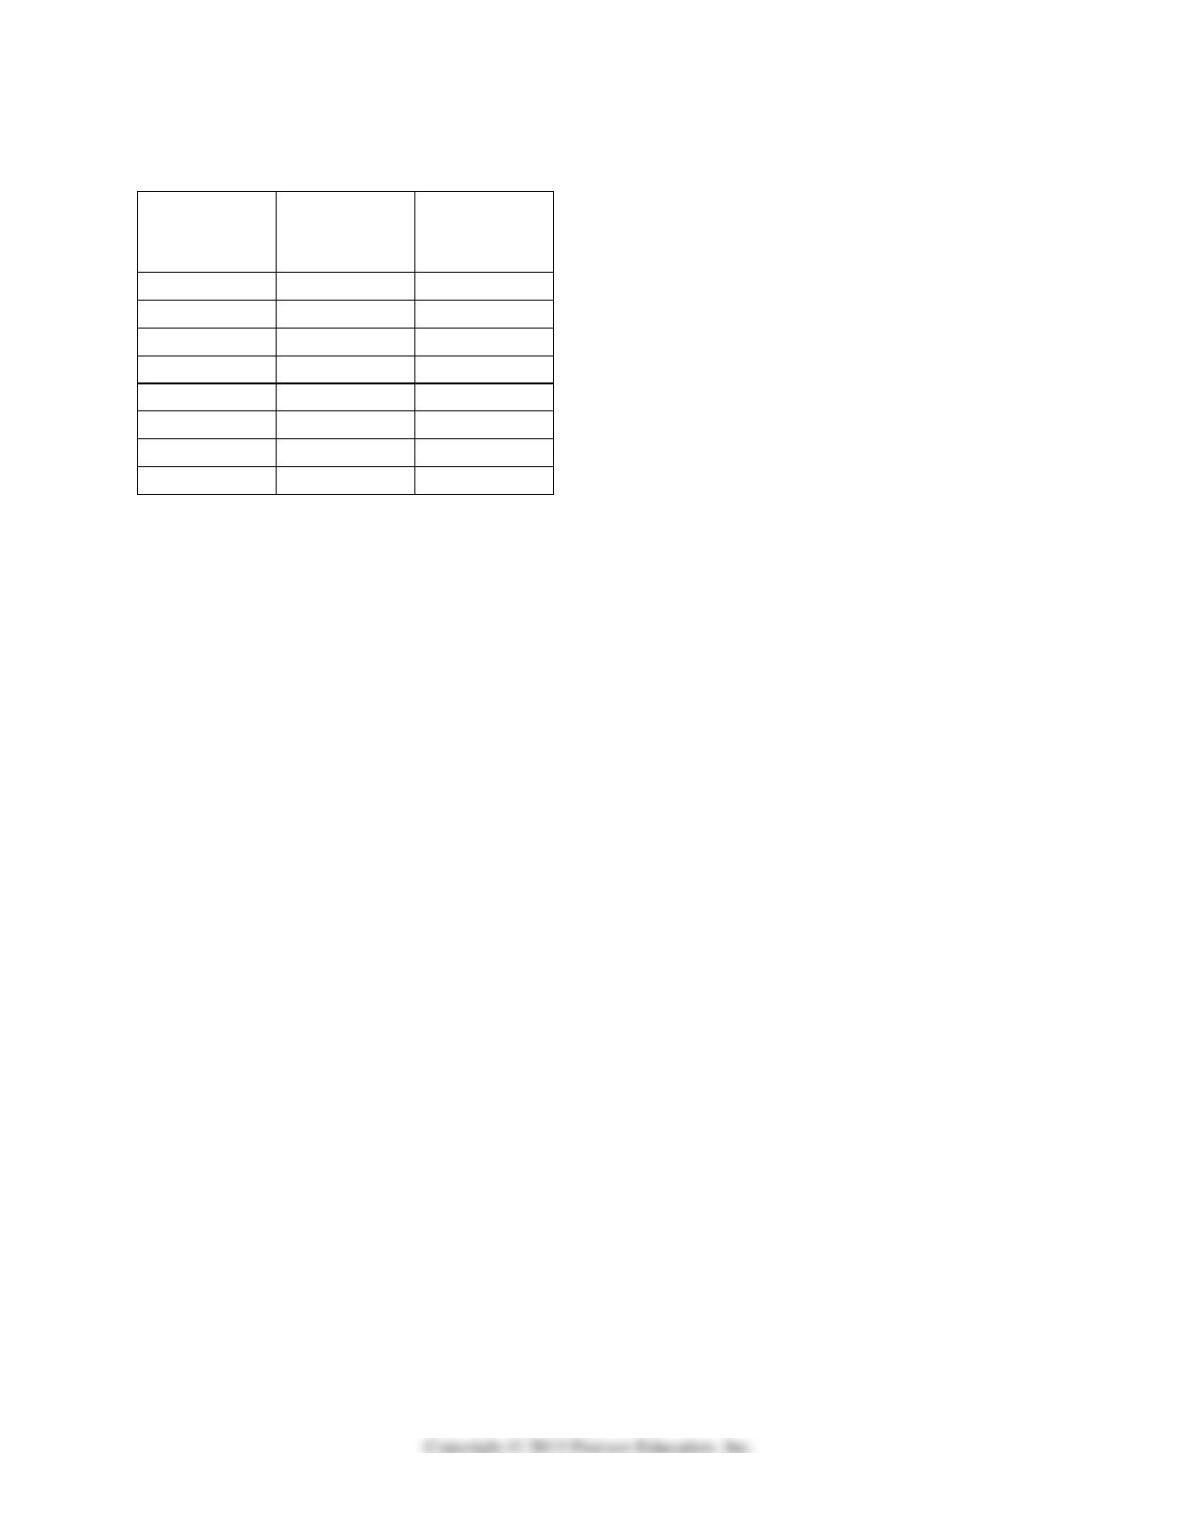
Table 4-4
Price per
Bushel
(dollars)
Quantity
Demanded
(bushels)
Quantity
Supplied
(bushels)
$2
40,000
0
4
34,000
4,000
6
28,000
8,000
8
24,000
16,000
10
20,000
20,000
12
18,000
28,000
14
12,000
36,000
16
6,000
40,000
Table 4-4 above contains information about the corn market. Answer the following questions
based on this table.
38) Refer to Table 4-4. An agricultural price floor is a price that the government guarantees
farmers will receive for a particular crop. Suppose the federal government sets a price floor for
corn at $12 per bushel.
a. What is the amount of shortage or surplus in the corn market as result of the price floor?
b. If the government agrees to purchase any surplus output at $12, how much will it cost the
government?
c. If the government buys all of the farmers’ output at the floor price, how many bushels of corn
will it have to purchase and how much will it cost the government?
d. Suppose the government buys up all of the farmers’ output at the floor price and then sells the
output to consumers at whatever price it can get. Under this scheme, what is the price at which
the government will be able to sell off all of the output it had purchased from farmers? What is
the revenue received from the government’s sale?
e. In this problem we have considered two government schemes: (1) a price floor is established
and the government purchases any excess output and (2) the government buys all the farmers’
output at the floor price and resells at whatever price it can get. Which scheme will taxpayers
prefer?
f. Consider again the two schemes. Which scheme will the farmers prefer?
g. Consider again the two schemes. Which scheme will corn buyers prefer?
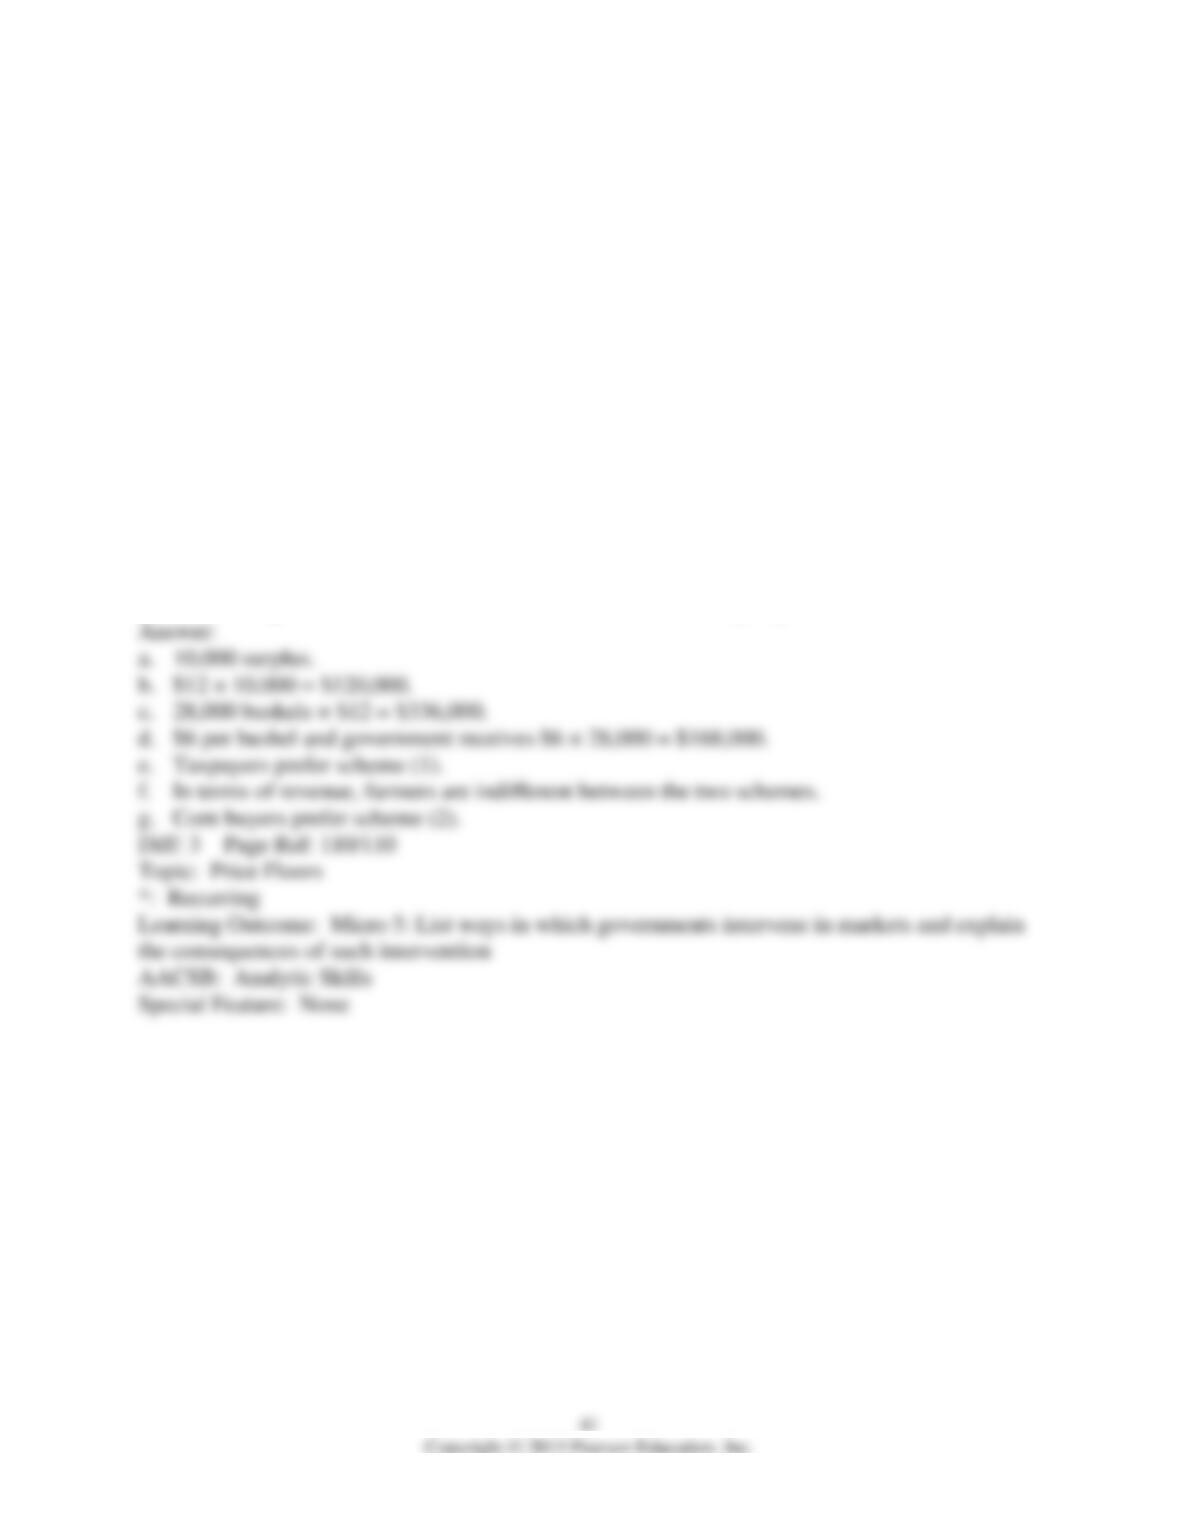
39) The cities of Francistown and Nalady are five miles apart. Francistown enacts a rent control
law that puts a ceiling on rents well below their equilibrium market value. Predict the impact of
this law on the competitive equilibrium rent in Nalady, which does not have a rent control law.
a. Illustrate your answer with one demand and supply graph for the apartment market in
Francistown and another demand and supply graph for the apartment marketing Nalady.
b. Make sure that your graphs clearly show (1) the initial equilibrium before the rent control in
both markets and (2) what happens after the imposition of rent control.
c. Clearly show any shifts in the demand or supply curves, and the movement along the curves
for each market.
d. Label your graphs fully and provide written explanation for your graphs.
4.4 The Economic Impact of Taxes
1) The actual division of the burden of a tax between buyers and sellers in a market is called
A) tax incidence.
B) tax liability.
C) tax bearer.
D) tax parity.
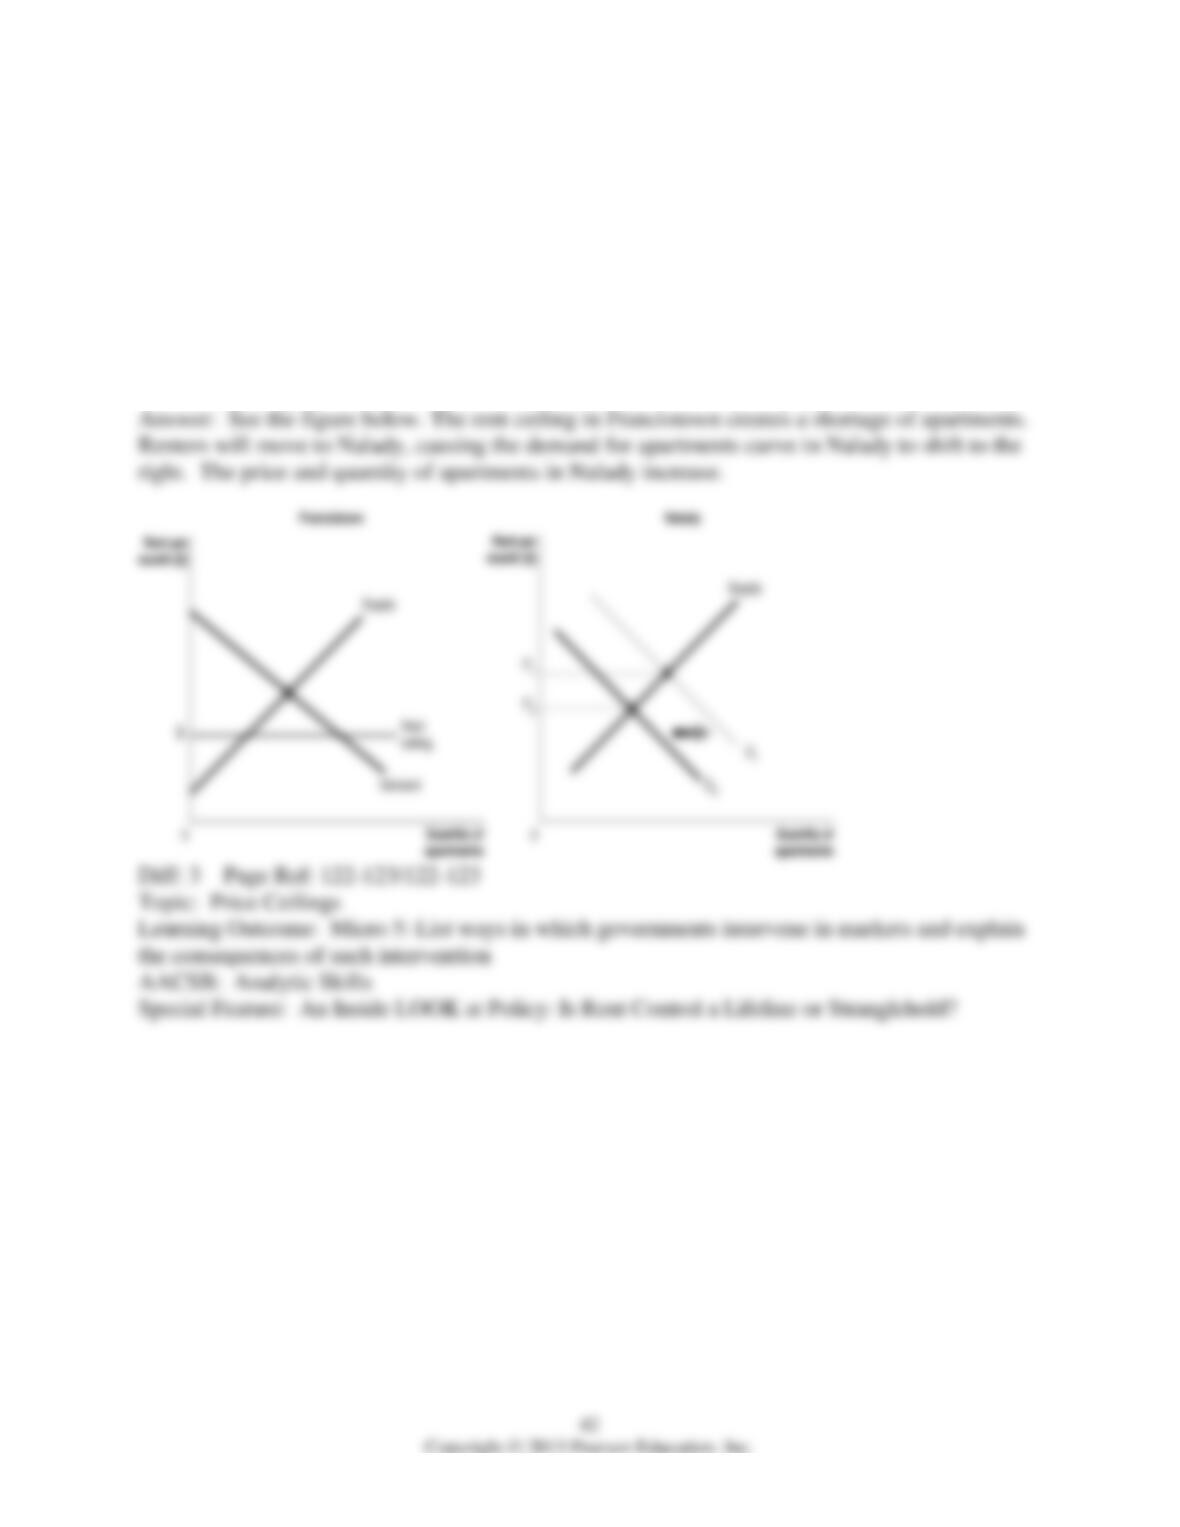
Figure 4-8
Figure 4-8 shows the market for beer. The government plans to impose a unit tax in this market.
2) Refer to Figure 4-8. What is the size of the unit tax?
A) $2
B) $5
C) $7
D) $12
3) Refer to Figure 4-8. How much of the tax is paid by buyers?
A) $2
B) $5
C) $7
D) $12
4) Refer to Figure 4-8. The price buyers pay after the tax is
A) $7.
B) $20.
C) $22.
D) $27.
5) Refer to Figure 4-8. For each unit sold, the price sellers receive after the tax (net of tax) is
A) $20.
B) $22.
C) $27.
D) $32.
6) Refer to Figure 4-8. How much of the tax is paid by producers?
A) $2
B) $5
C) $7
D) $12
7) Refer to Figure 4-8. As a result of the tax, is there a loss in consumer surplus?
A) Yes, because consumers paying a price above the economically efficient price.
B) No, because the producer pays the tax.
C) No, because the market reaches a new equilibrium
D) No, because consumers are charged a lower price to cover their tax burden.
8) The government proposes a tax on imported champagne. Buyers will bear the entire burden
of the tax if the
A) supply curve for imported champagne is vertical.
B) demand curve for imported champagne is vertical.
C) demand curve for imported champagne is horizontal.
D) demand curve is downward sloping and the supply curve is upward sloping.
9) Suppose the demand curve for a product is vertical and the supply curve is upward sloping. If
a unit tax is imposed in the market for this product,
A) sellers bear the entire burden of the tax.
B) buyers bear the entire burden of the tax.
C) the tax burden will be shared equally between buyers and sellers.
D) buyers share the burden of the tax with government.
10) Suppose the demand curve for a product is horizontal and the supply curve is upward
sloping. If a unit tax is imposed in the market for this product,
A) sellers bear the entire burden of the tax.
B) the tax burden will be shared among the government, buyers and sellers.
C) buyers bear the entire burden of the tax.
D) the tax burden will be shared by buyers and sellers.
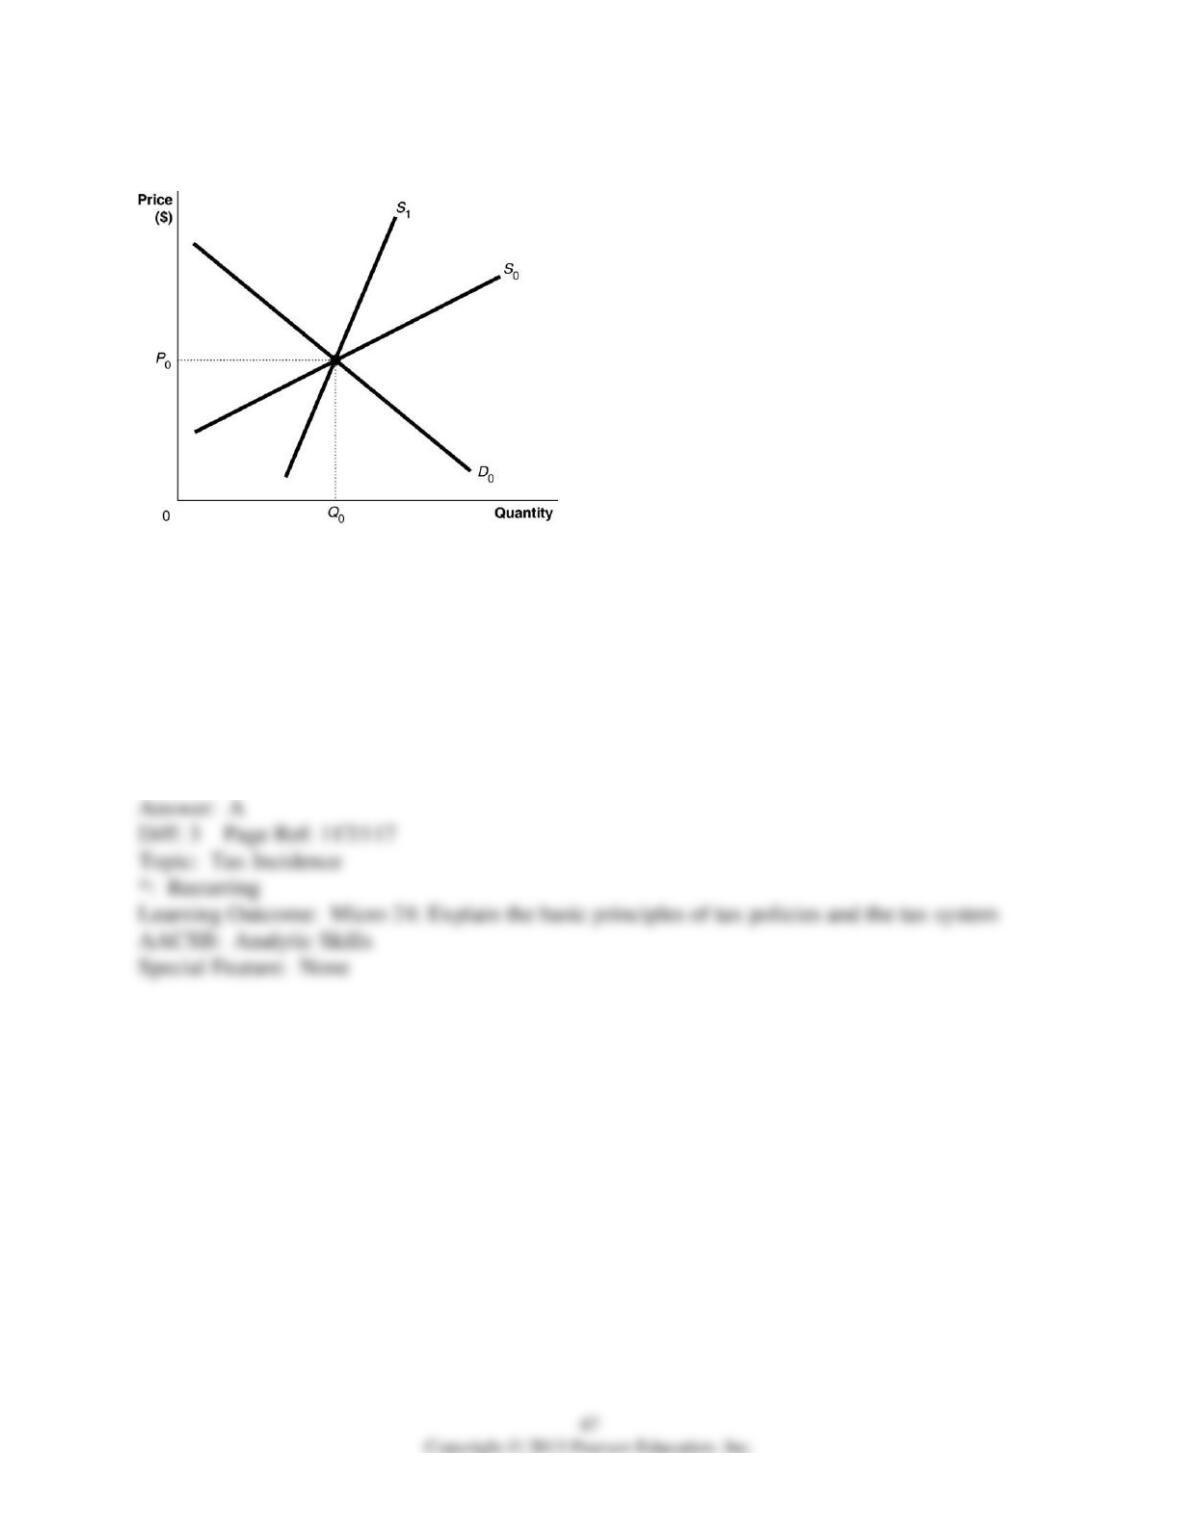
Figure 4-9
11) Refer to Figure 4-9. Suppose the market is initially in equilibrium at price P0 and now the
government imposes a tax on every unit sold. Which of the following statements best describes
the impact of the tax? For demand curve D0
A) the producer bears a greater share of the tax burden if the supply curve is S1.
B) the producer bears a greater share of the tax burden if the supply curve is S0.
C) the producer’s share of the tax burden is the same whether the supply curve is S0 or S1.
D) the producer bears the entire burden of the tax if the supply curve is S0 and the consumer
bears the entire burden of the tax if the supply curve is S1.
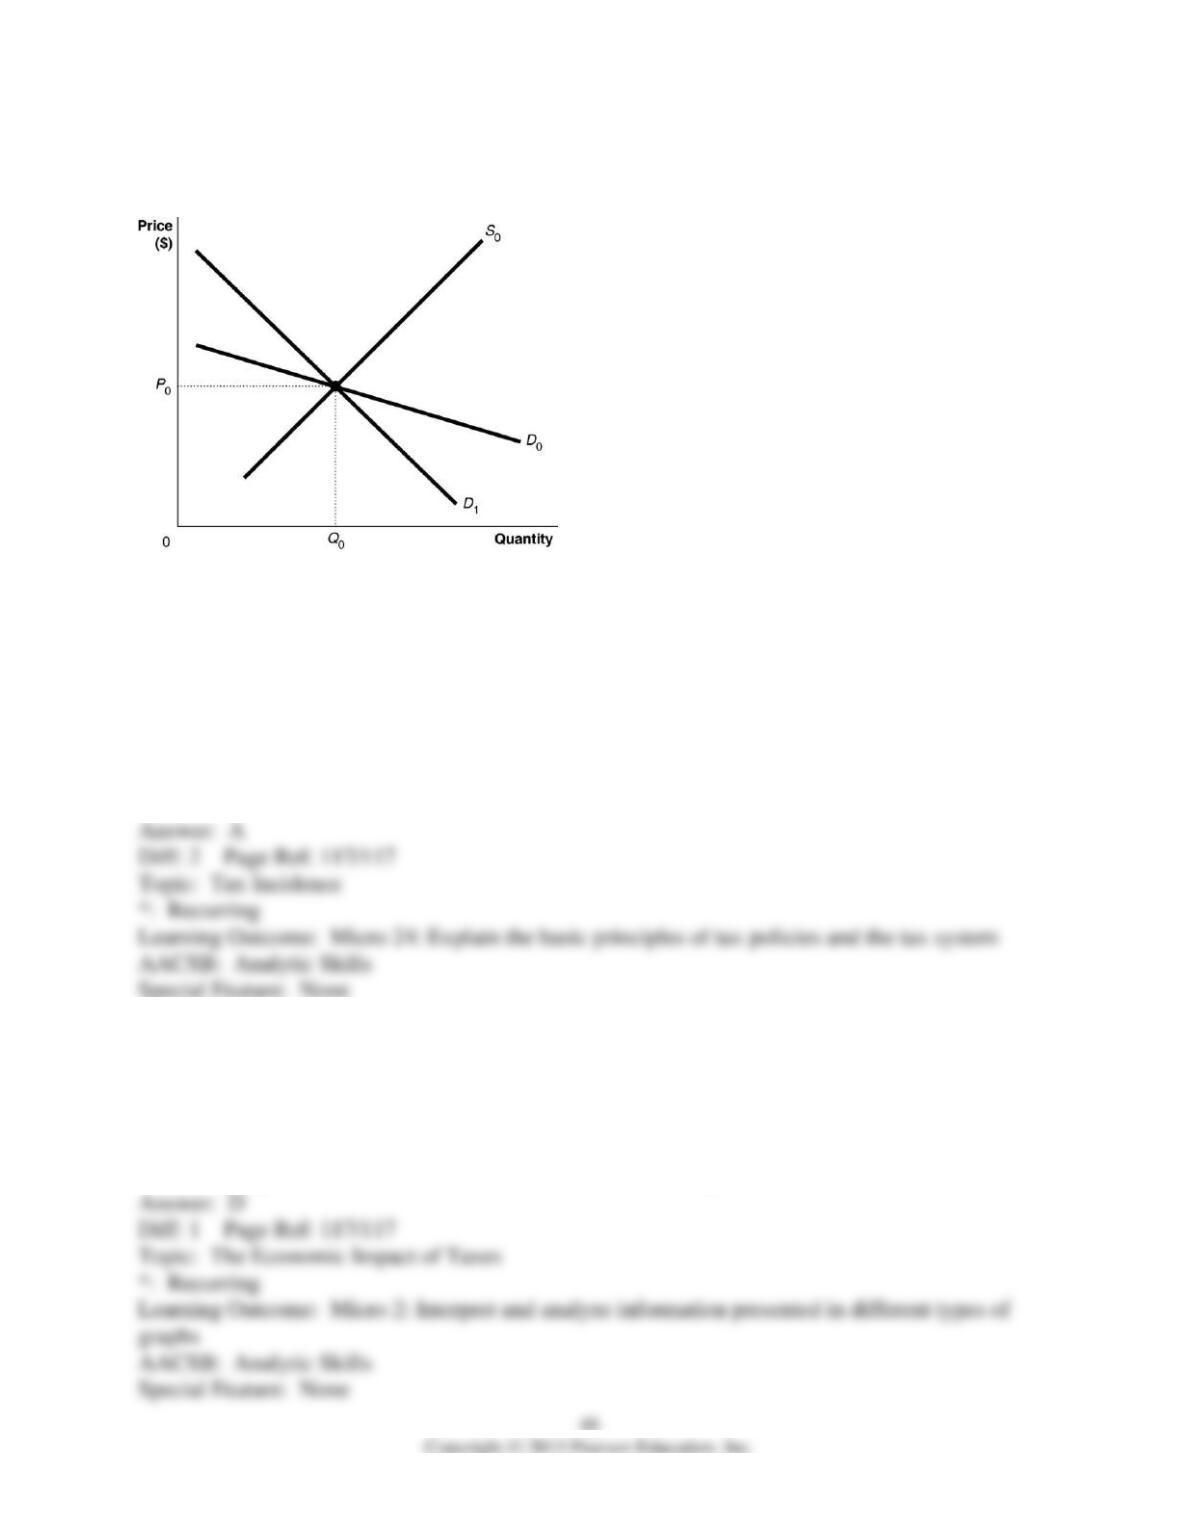
Figure 4-10
12) Refer to Figure 4-10. Suppose the market is initially in equilibrium at price P0 and then the
government imposes a tax on every unit sold. Which of the following statements best describes
the impact of the tax?
A) The consumer will bear a smaller share of the tax burden if the demand curve is D0.
B) The consumer’s share of the tax burden is the same whether the demand curve is D0 or D1.
C) The consumer will bear a smaller share of the tax burden if the demand curve is D1.
D) The consumer will bear the entire burden of the tax if the demand curve is D1 and the
producer will bear the entire burden of the tax if the demand curve is D0.
13) Suppose an excise tax of $1 is imposed on every case of beer sold and sellers are responsible
for paying this tax. How would the imposition of the tax be illustrated in a graph?
A) The supply curve for cases of beer would shift to the right by $1.
B) The supply curve for cases of beer would shift to the left by more than $1.
C) The supply curve for cases of beer would shift to the left by less than $1.
D) The supply curve for cases of beer would shift to the left by $1.
14) Suppose that in Canada the government places a $1,500 tax on the buyers of new
snowmobiles. After the purchase of a new snowmobile, a buyer must pay the government
$1,500. How would the imposition of the tax on buyers be illustrated in a graph?
A) The tax will shift the supply curve to the left by $1,500.
B) The tax will shift the demand curve to the right by $1,500.
C) The tax will shift both the demand and supply curve to the right by $1,500.
D) The tax will shift the demand curve to the left by $1,500.
15) When Congress passed a law that imposed a tax designed to fund its Social Security and
Medicare programs it wanted employers and workers to share the burden of the tax equally.
Most economists who have studied the incidence of the tax have concluded
A) the tax is not high enough to cover the future costs of Social Security and Medicare.
B) the tax on employers is too high because it reduces the employment of low-skilled workers.
C) the burden of the tax falls almost entirely on workers.
D) the tax rate should be greater for high income workers than for low income workers.
16) The payroll tax is a tax imposed on ________ that is used to fund Social Security and
Medicare.
A) employers only
B) workers only
C) employers and workers
D) the unemployed
17) When the government taxes a good or service, it
A) affects the market equilibrium for that good or service.
B) eliminates the deadweight loss associated with the good or service.
C) increases consumer surplus for the good or service.
D) increases producer surplus for the good or service.
18) Economists have shown that the burden of a tax is the same whether the tax is collected from
the buyer or the seller. Why, then, are gasoline and cigarette taxes imposed on sellers?
A) Sellers are more honest than buyers.
B) The demand for both gasoline and cigarettes is very elastic.
C) The Equal Protection Clause of the U.S. Constitution prohibits the government from imposing
taxes like these on buyers.
D) It is more difficult for buyers to keep track of their purchases, and for the government to
verify that the right of amount of tax revenue is collected.
19) A tax that imposes a small excess burden relative to the tax revenue that it raises is
A) a payroll tax.
B) a sin tax.
C) an efficient tax.
D) a FICA tax.
20) The division of the burden of a tax between buyers and sellers in a market is called tax
allocation.
21) If the demand curve for a product is vertical, any tax increase on the product is paid for
entirely by the consumer.
22) One result of a tax is an increase in economic efficiency.
23) What is “tax incidence”? What determines tax incidence in a competitive market?
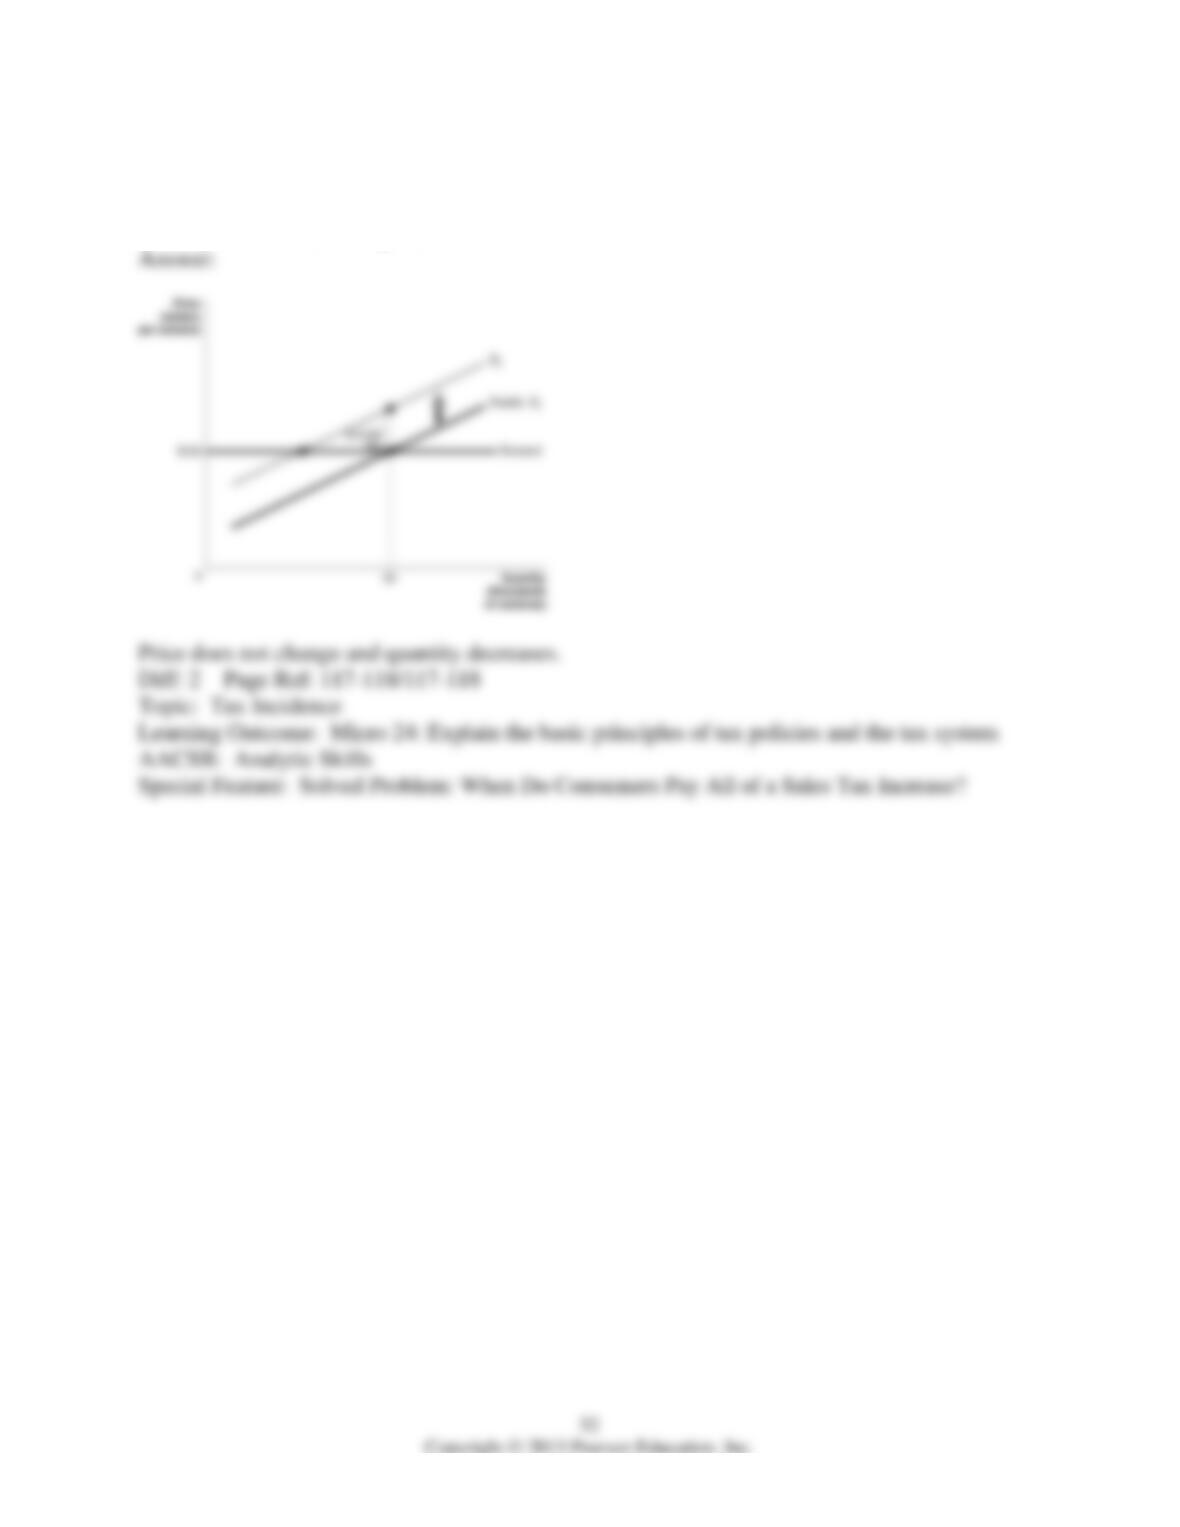
24) Using a supply and demand graph, illustrate the effect of the addition of a $10.00 unit tax on
digital cameras, where the entire tax burden falls on the seller. Assume the equilibrium price
before the tax is $125 and the equilibrium quantity is 50,000. What happens to the price and
quantity after the tax is implemented?
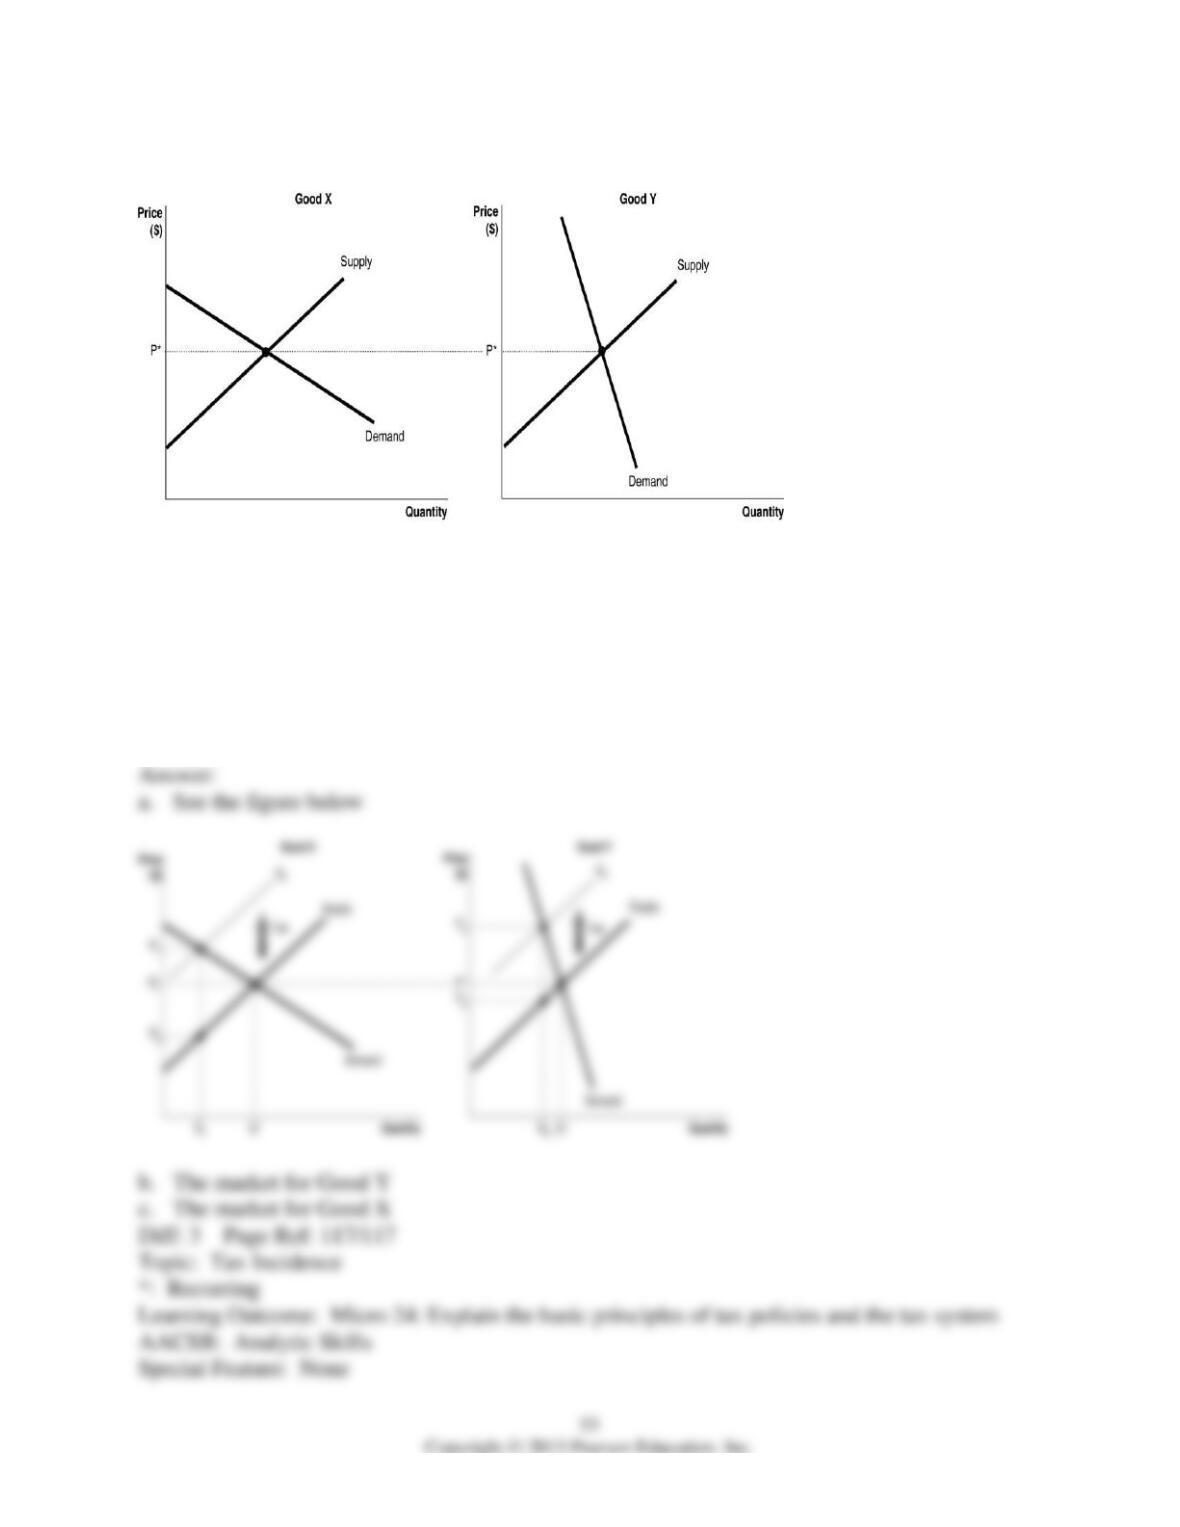
Figure 4-11
25) Refer to Figure 4-11. The figure above illustrates the markets for two goods, Good X and
Good Y. Suppose an identical dollar tax is imposed in each market.
a. Compare the consumer burden and producer burden in each market. Illustrate your answer
graphically.
b. If the goal of the government is to raise revenue with minimum impact to quantity consumed,
in which market should the tax be imposed?
c. If the goal of the government is to discourage consumption, in which market should the tax
be imposed?
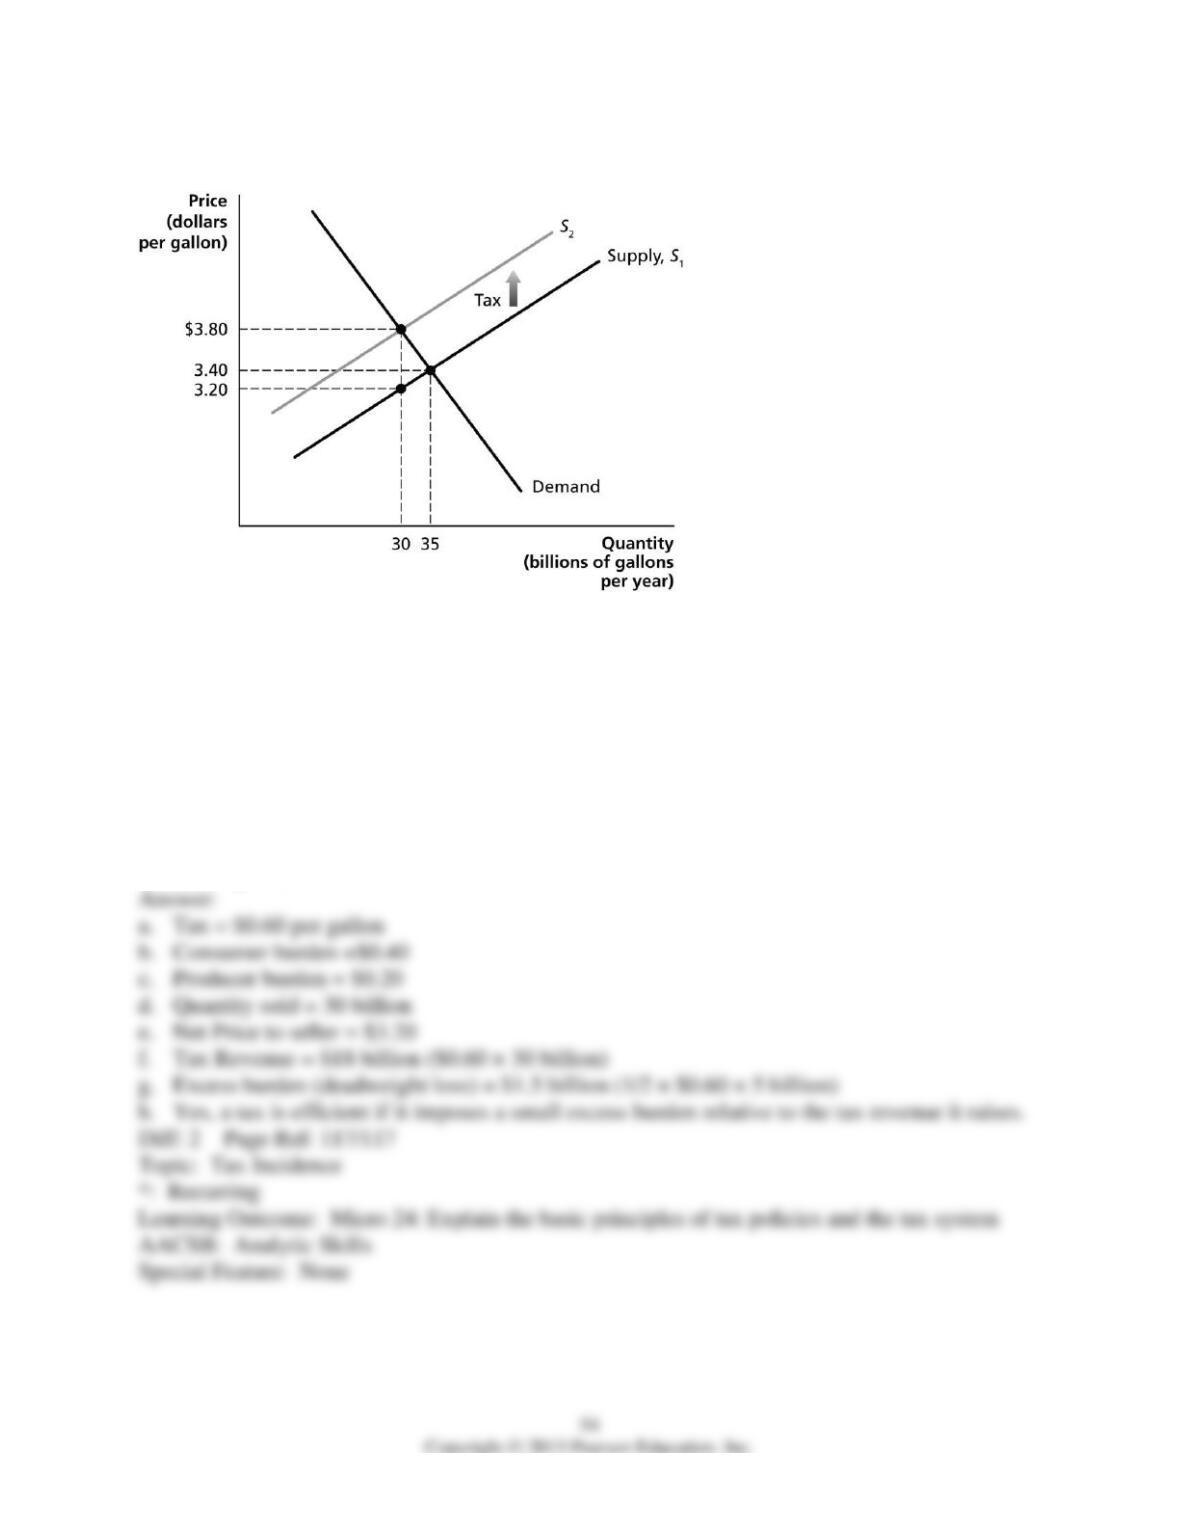
Figure 4-12
26) Refer to Figure 4-12. The figure above represents demand and supply in the market for
gasoline. Use the diagram to answer the following questions.
a. How much is the government tax on each gallon of gasoline?
b. What portion of the unit tax is paid by consumers?
c. What portion of the unit tax is paid by producers?
d. What is the quantity sold after the imposition of the tax?
e. What is the after-tax revenue per gallon received by producers?
f. What is the total tax revenue collected by the government?
g. What is the value of the excess burden of the tax?
h. Is this gasoline tax efficient?
4.5 Appendix: Quantitative Demand and Supply Analysis
1) The following equations represent the demand and supply for silver pendants.
QD = 50 – 2P
QS = -10 + 2P
What is the equilibrium price (P) and quantity (Q – in thousands) of pendants?
A) P = $15; Q = 20 thousand
B) P = $50; Q = 10 thousand
C) P = $20; Q = 15 thousand
D) P = $10; Q = 30 thousand
2) If the price of hairspray is represented by equation P = 10 – 0.2 QD, then the corresponding
quantity of hairspray demanded is represented by the equation
A) QD = 5P – 2.
B) QD = 0.5P + 2.
C) QD = 50 -5P.
D) QD = -10 + 0.2P.
3) If the quantity of fishing poles demanded is represented by the equation QD = 60 – P then the
corresponding price of fishing poles is represented by the equation
A) P = 0.6QD + 10.
B) P = 60 – QD.
C) P = -60 + QD.
D) P = QD + 60.
4) If the quantity of donuts supplied is represented by the equation QS = -15 + 5P then the
corresponding price of donuts is represented by the equation
A) P = 0.2QS + 3.
B) P = 5QS + 75.
C) P = QS – 7.5.
D) P = 15 – 0.5QS.
Table 4-5
Demand
Supply
P = 80 – QD
P = 50 + 1/2 QS
QD = 80 – P
QS = 2P – 100
5) Refer to Table 4-5. The equations above describe the demand and supply for Chef Ernie’s
Sushi-on-a-Stick. What are the equilibrium price and quantity (in thousands) for Chef Ernie’s
sushi?
A) $80 and 80 thousand
B) $60 and 20 thousand
C) $50 and 100 thousand
D) $40 and 50 thousand
6) Refer to Table 4-5. The equations above describe the demand and supply for Chef Ernie’s
Sushi-on-a-Stick. The equilibrium price and quantity for Chef Ernie’s sushi are $60 and 20
thousand units. What is the value of consumer surplus?
A) $100 thousand
B) $200 thousand
C) $600 thousand
D) $800 thousand
7) Refer to Table 4-5. The equations above describe the demand and supply for Chef Ernie’s
Sushi-on-a-Stick. The equilibrium price and quantity for Chef Ernie’s sushi are $60 and 20
thousand units. What is the value of producer surplus?
A) $100 thousand
B) $200 thousand
C) $600 thousand
D) $800 thousand
8) Refer to Table 4-5. The equations above describe the demand and supply for Chef Ernie’s
Sushi-on-a-Stick. The equilibrium price and quantity for Chef Ernie’s sushi are $60 and 20
thousand units. What is the value of economic surplus in this market?
A) $300 thousand
B) $600 thousand
C) $1,200 thousand
D) $1,600 thousand
9) You are given the following market data for Venus automobiles in Saturnia.
Demand: P = 200 – 0.25Q
Supply: P = 130 + 0.10Q
where P = Price and Q = Quantity.
a. Calculate the equilibrium price and quantity.
b. Calculate the consumer surplus in this market.
c. Calculate the producer surplus in this market.
10) The demand and supply equations for the apple market are:
Demand: P = 12 – 0.01Q
Supply: P = 0.02Q
where P= price per bushel, and Q=quantity.
a. Calculate the equilibrium price and quantity.
b. Suppose the government guaranteed producers a price of $10 per bushel. What
would be the effect on quantity supplied? Provide a numerical value.
c. By how much would the $10 price change the quantity of apples demanded? Provide a
numerical value.
d. Would there be a shortage or surplus of apples?
e. What is the size of this shortage or surplus? Provide a numerical value.