22. Economic theory suggests that higher levels of ____________________ in any activity should lead to
higher levels of ___________________________________.
23. All else being equal, firms with high levels of ________________________________________ incur
more risk in their operations and should earn higher rates of return.
24. To reduce the risk inherent in ______________________________ a company should strive for a high
proportion of variable costs in its cost structure.
25. Firms that have either convertible securities or stock options or warrants outstanding have
__________________________________________________.
26. EPS is an ambiguous measure of profitability because it reflects operating performance in the
numerator and ________________________________________ in the denominator.
27. Operating income is negative in an amount equal to _________________________ when revenues are
zero.
28. Firms and industries characterized by heavy fixed capacity costs and lengthy periods required to add
new capacity operate under a ___________________________________.
4-17
SHORT ANSWER
1. Below is financial information for two restaurant retailers. Popper’s Company operates an innovative
retail bakery-cafe business and franchising business. At the end 2010, Popper’s had 132 company–
owned and 346 franchise-operated bakery-cafes. Popper’s located most of their unique bakery-cafe
concept stores in suburban, strip mall, and regional mall locations. As a first mover in this concept, the
company operates in 32 states. Simmer Corporation began operations five years earlier than Popper’s
and purchases and roasts whole bean coffees and sells them, along with numerous coffee drinks and
related products at over 2,900 Company-operated retail stores.
Selected Data for Popper’s Company and Simmer Corporation
(amounts in millions)
Simmer
Popper’s
Net Sales
Sales Simmer $5,000 Popper’s
300
$4,076
$278
Cost of Goods Sold
1,686
97
Interest Expense
0
0
Net Income
268
22
Average Inventory
303
4
Average Fixed Assets
2,163
130
Required:
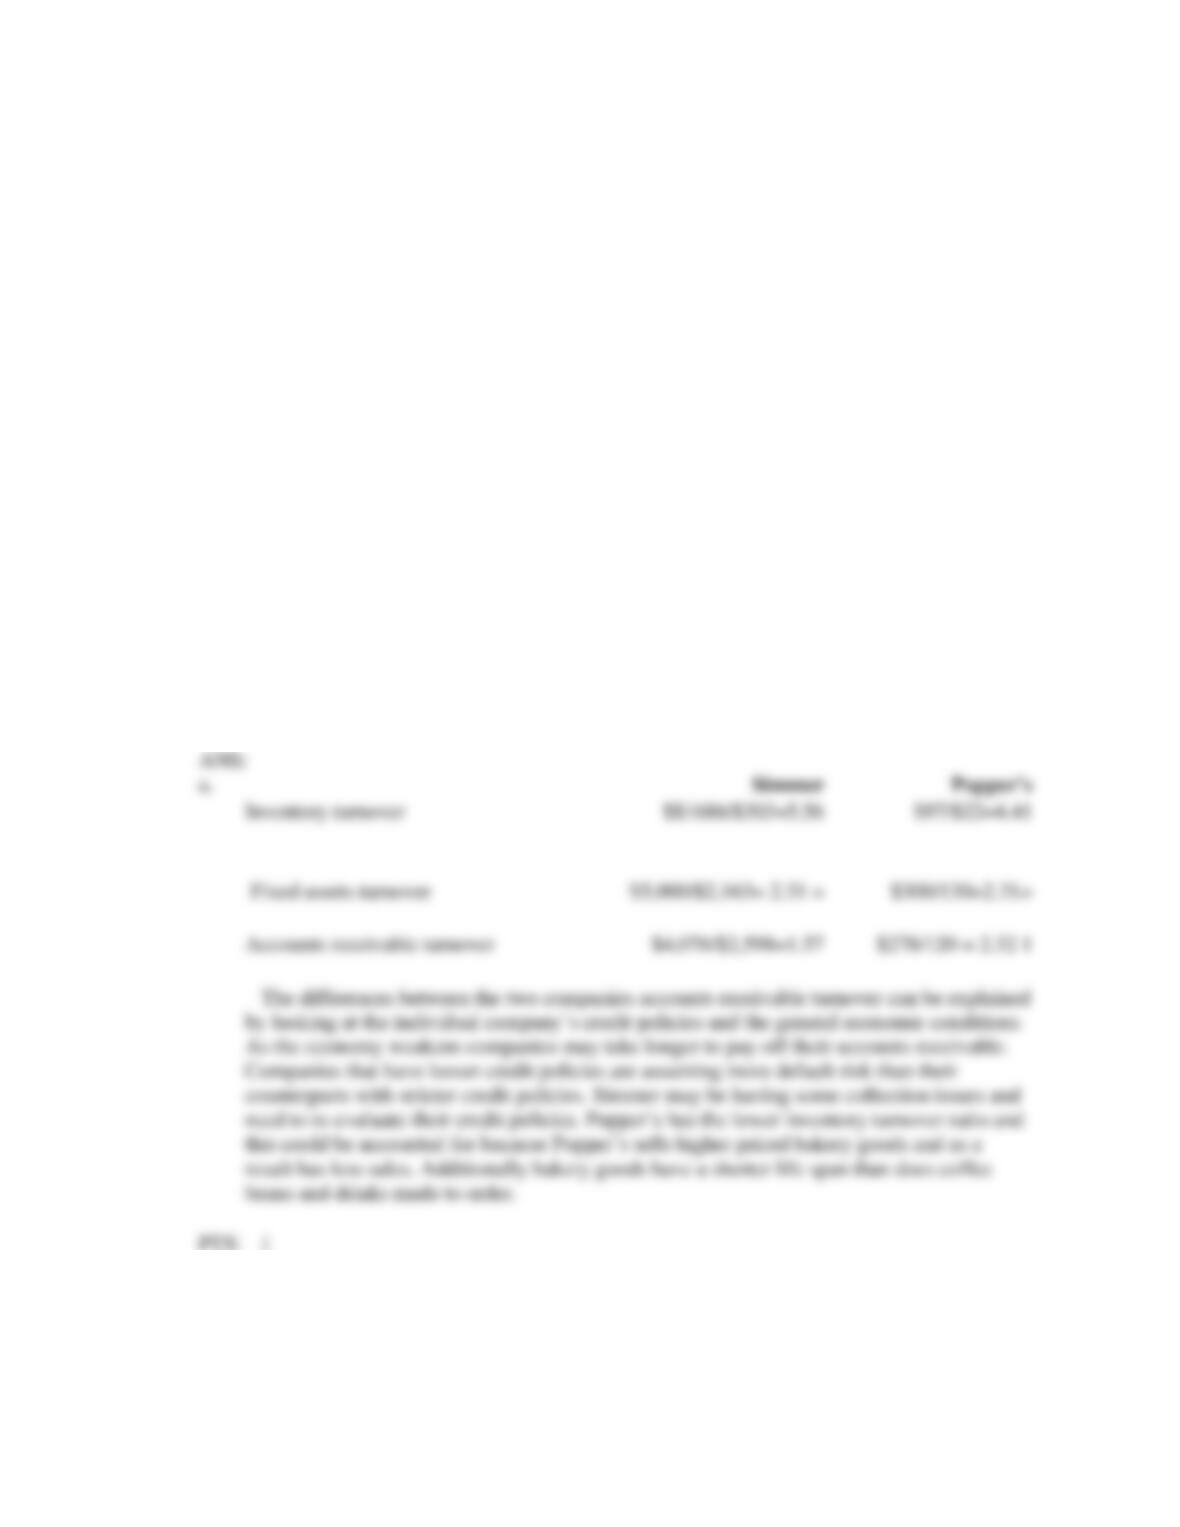
a.
Compute the Inventory turnover, fixed asset turnover, and accounts receivable turnover.
b.
Describe the likely reasons for the difference in the accounts receivable turnover and the
inventory turnover
2. Sensitron and Douglas Tools manufacture and market power tools and accessories. Sensitron targets
customers in the professional contractor market, while Douglas Tools focuses on home users and
professionals. Selected financial data for the companies appears below.
Simmer
Popper’s
4-18
Sensitron
2010
2009
2008
Sales
$2,109,100
$2,095,700
$2,175,700
Average Accounts Receivable
564,500
608,650
631,072
Change in Sales from previous year
0.64%
-3.68%
11.83%
Douglas Tools
2010
2009
2008
Sales
$4,394,000
$4,245,600
$4,474,900
Average Accounts Receivable
718,800
745,850
803,150
Change in Sales from previous year
3.50%
-5.12%
0.59%
Required:
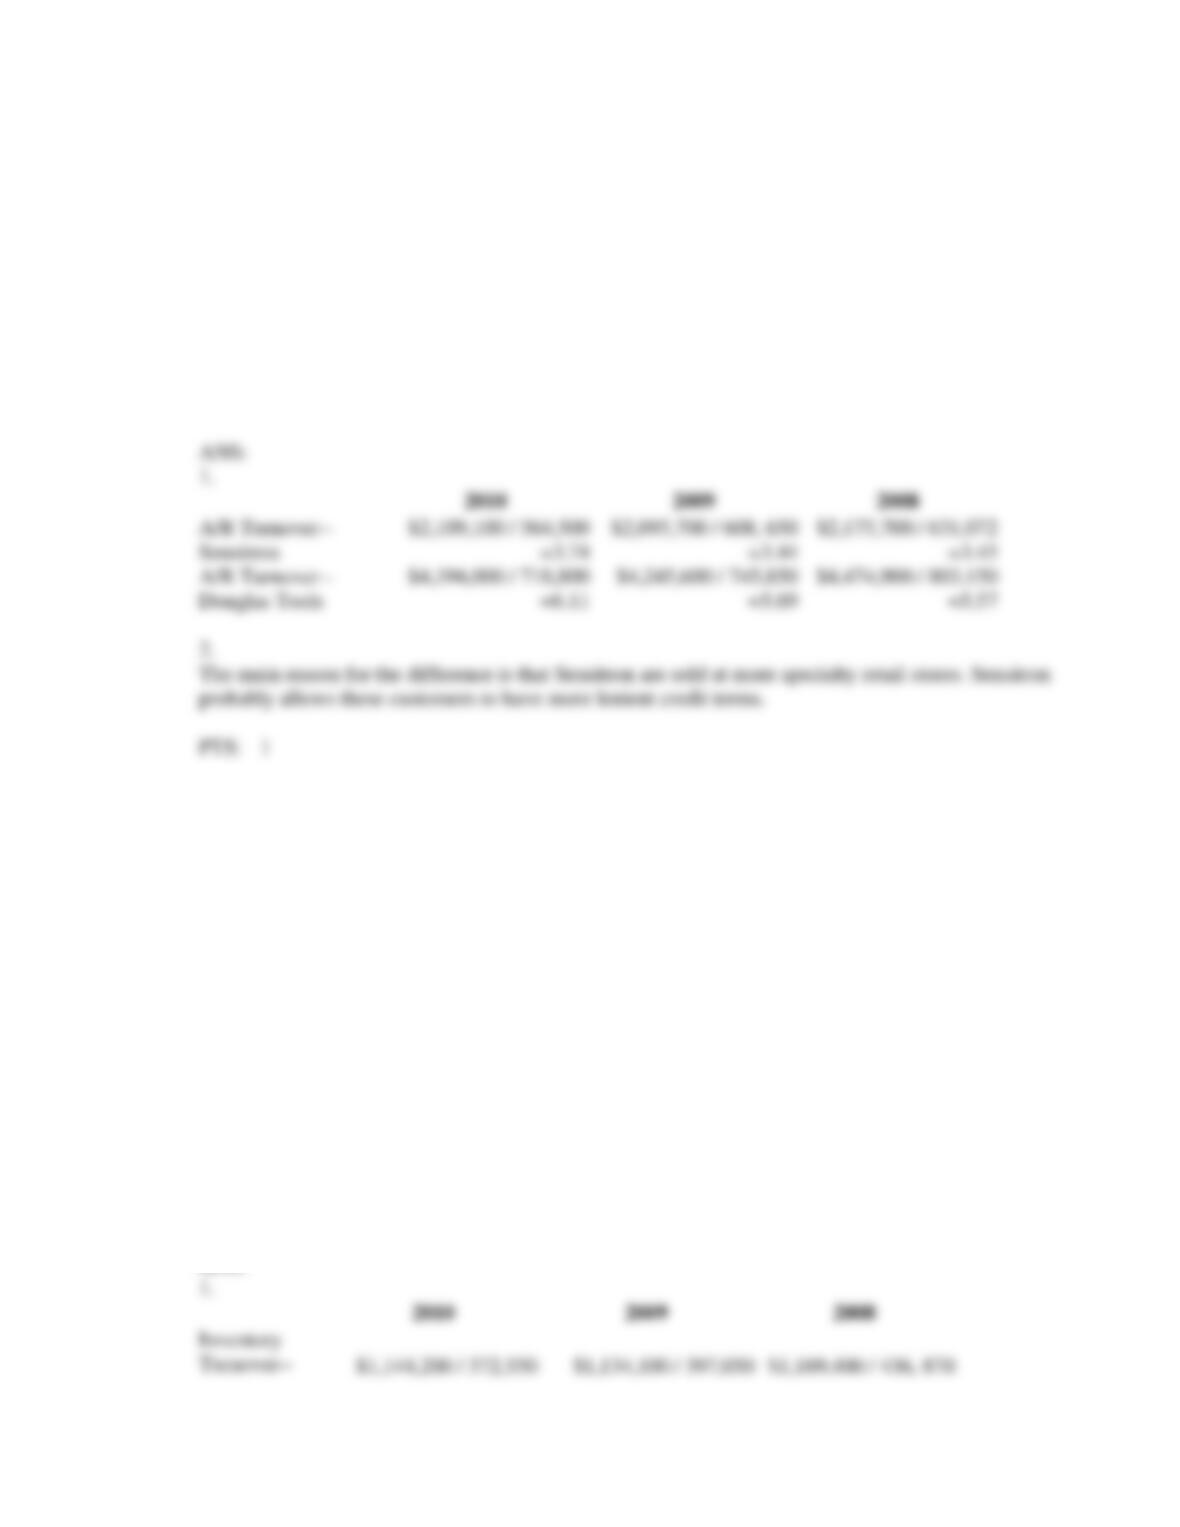
1.
Calculate the accounts receivable turnover ratio for each firm for year 2010, 2009, 2008.
2.
Suggest reasons for the differences in the accounts receivable turnover ratios for these two
firms.
3. Sensitron and Douglas Tools manufacture and market power tools and accessories. Sensitron targets
customers in the professional contractor market, while Douglas Tools focuses on home users and
professionals. Both firms use the same cost flow assumption for valuing inventories and cost of goods
sold. Selected financial data for the companies appears below.
Sensitron
2010
2009
2008
Cost of Goods Sold
$1,144,200
$1,134,100
$1,169,400
Average Inventory
372,550
397,050
436,870
Change in Sales from previous year
0.64%
-3.68%
11.83%
Douglas Tools
2010
2009
2008
Cost of Goods Sold
$2,876,100
$2,846,600
$2,889,000
Average Inventory
730,550
778,100
797,500
Change in Sales from previous year
3.50%
-5.12%
0.59%
Required:
1.
Calculate the inventory turnover ratio for each firm for year 2010, 2009, 2008.
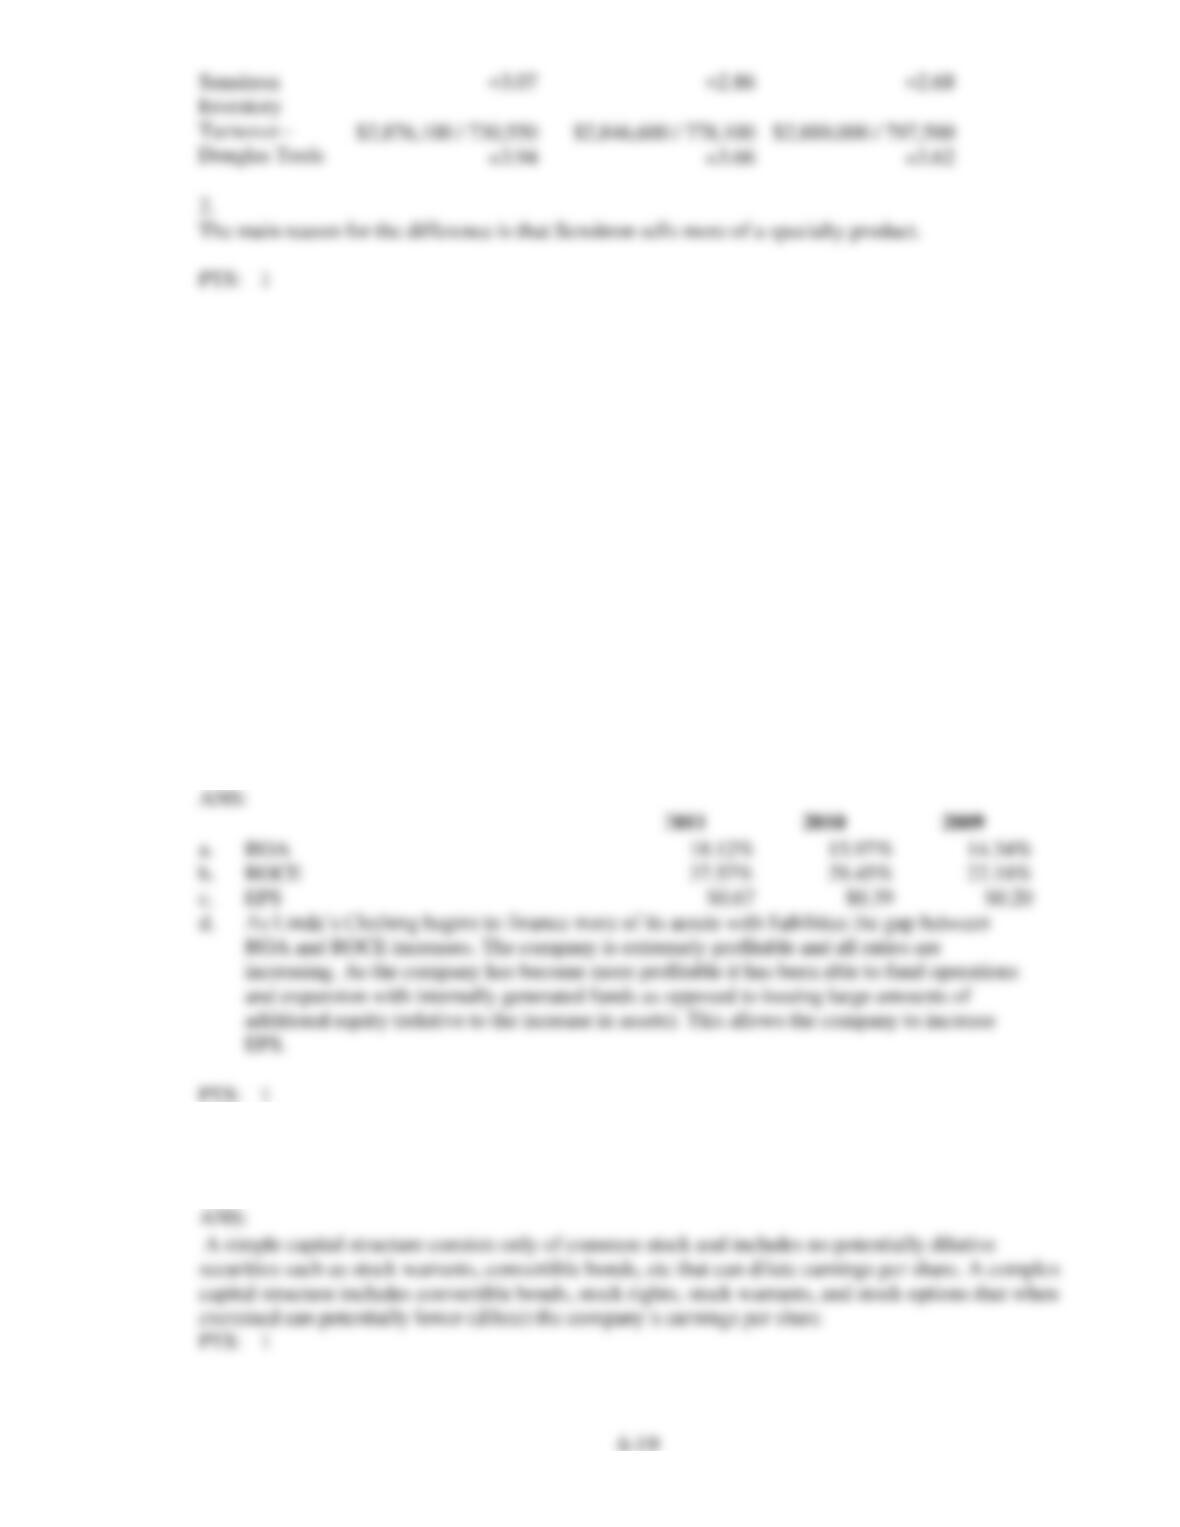
2.
Suggest reasons for the differences in the Inventory turnover ratios for these two firms.
ANS:
Sensitron
4. Linda’s Clothing is a retailer of contemporary women’s clothing. Selected financial information for
Linda’s appears below:
2011
2010
2009
2008
Net Income
$ 56,759
$ 31,150
$ 15,375
$14,750
Total Assets at year-end
$381,500
$246,250
$145,490
$71,268
Weighted Average number of shares
Outstanding
84,215
80,546
77,965
75,888
Total Liabilities at year-end
205,967
119,657
60,522
17,623
Common Stockholders’ Equity at year-end
$175,533
$126,593
$ 84,968
$53,645
Interest Expense
165
195
258
368
Required:
a.
Compute the rate of return on assets for the years 2009-2011. Linda’s has an effective tax
rate of 35%.
b.
Compute the rate of return on common shareholders’ equity for the years 2009-2011.
c.
Compute basic earnings per share for the years 2009-2011.
d.
Interpret the changes in ROA versus ROCE and EPS over the three-year period.
5. Explain the difference between a simple and complex capital structure as the terms are used in the
calculation of EPS.
6. Discuss the economic characteristics of firms that have the following mix of profit margin and asset
turnover. In addition provide an example of an industry that would have the relevant profit margin
asset turnover mix:
A. High profit margin and low asset turnover.
B. Low profit margin and high asset turnover
7. Below is financial information for two sporting goods retailers. Extreme Sports Company operates a
retail business and franchising business. At the end 2011, Extreme Sports had 263 Company-owned
and 120 franchise-operated retail stores. Extreme’s stores are located in suburban, strip mall and
regional mall locations, the company operates in 32 states. All Sports Corporation sells sporting goods
and related products at over 2,500 Company-operated retail stores.
Selected Data for All Sports and Extreme Sports
(amounts in millions)
All Sports
Extreme Sports
Sales
$5,320
$1,344
Cost of Goods Sold
3,897
887
Interest Expense
138
43
Net Income
212
33
Average Accounts Receivable
114
18
Average Inventory
998
286
Average Fixed Assets
1,163
130
Average Total Assets
2,472
662
Average Tax Rate
40%
40%
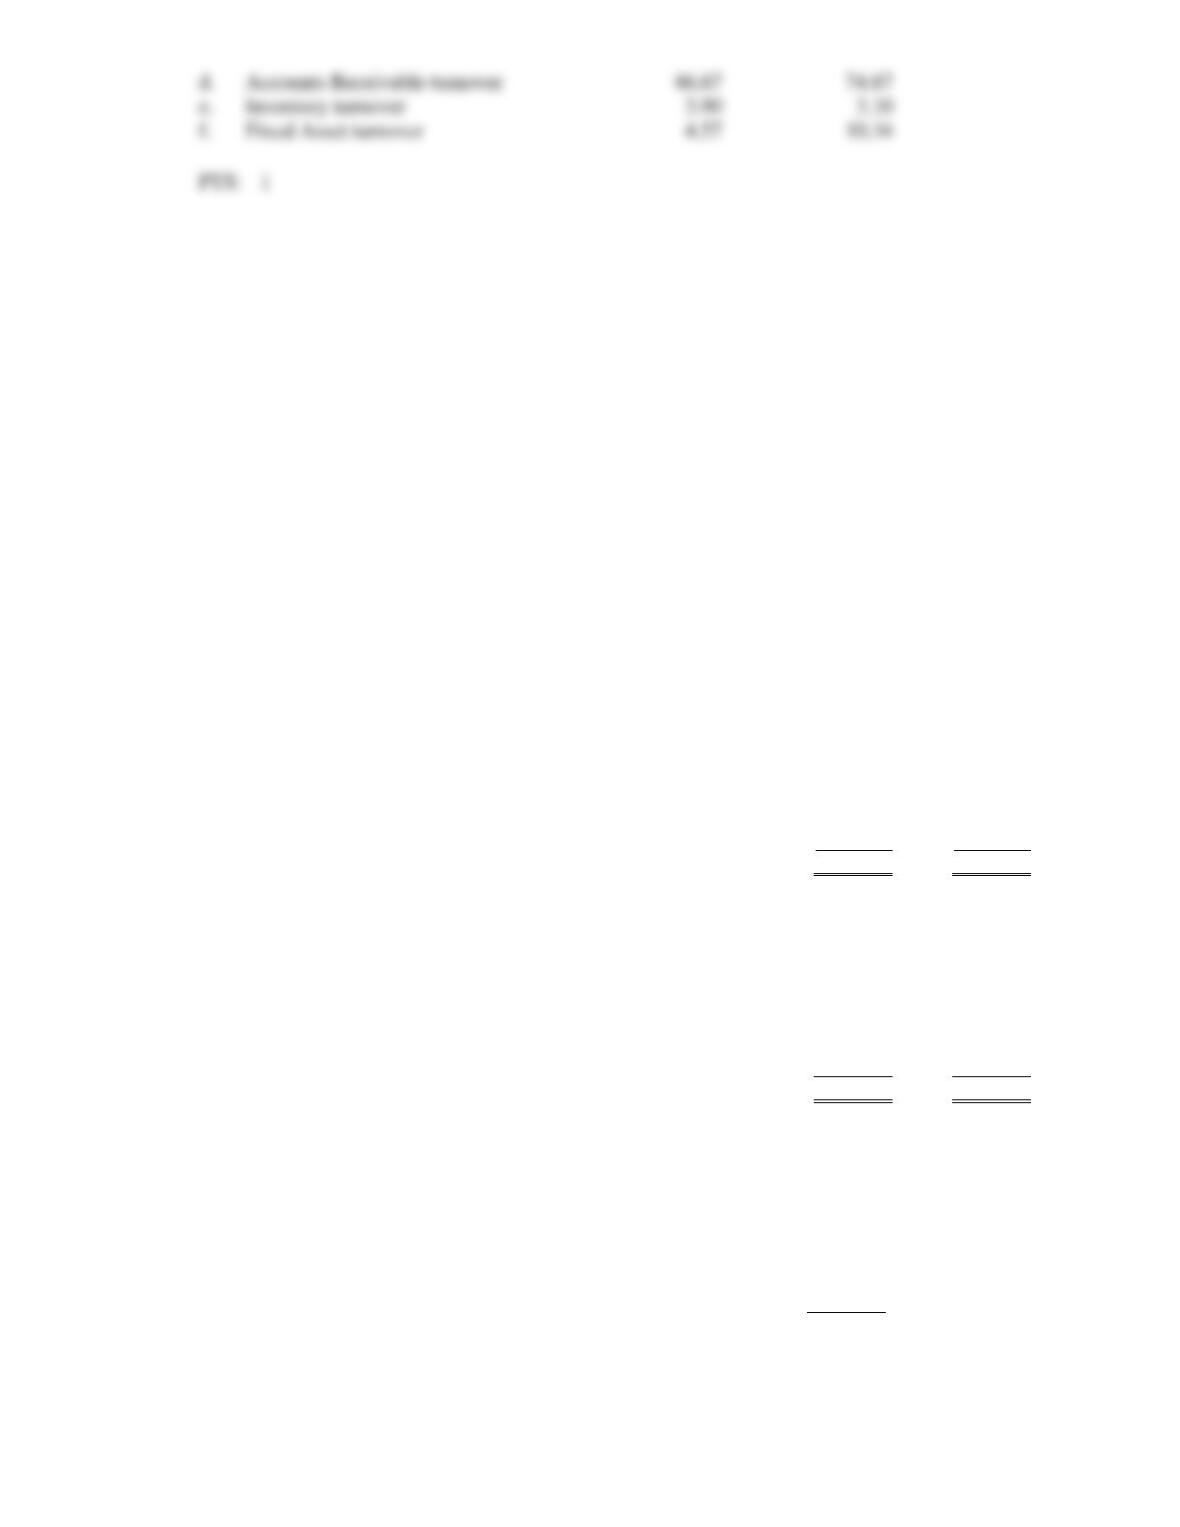
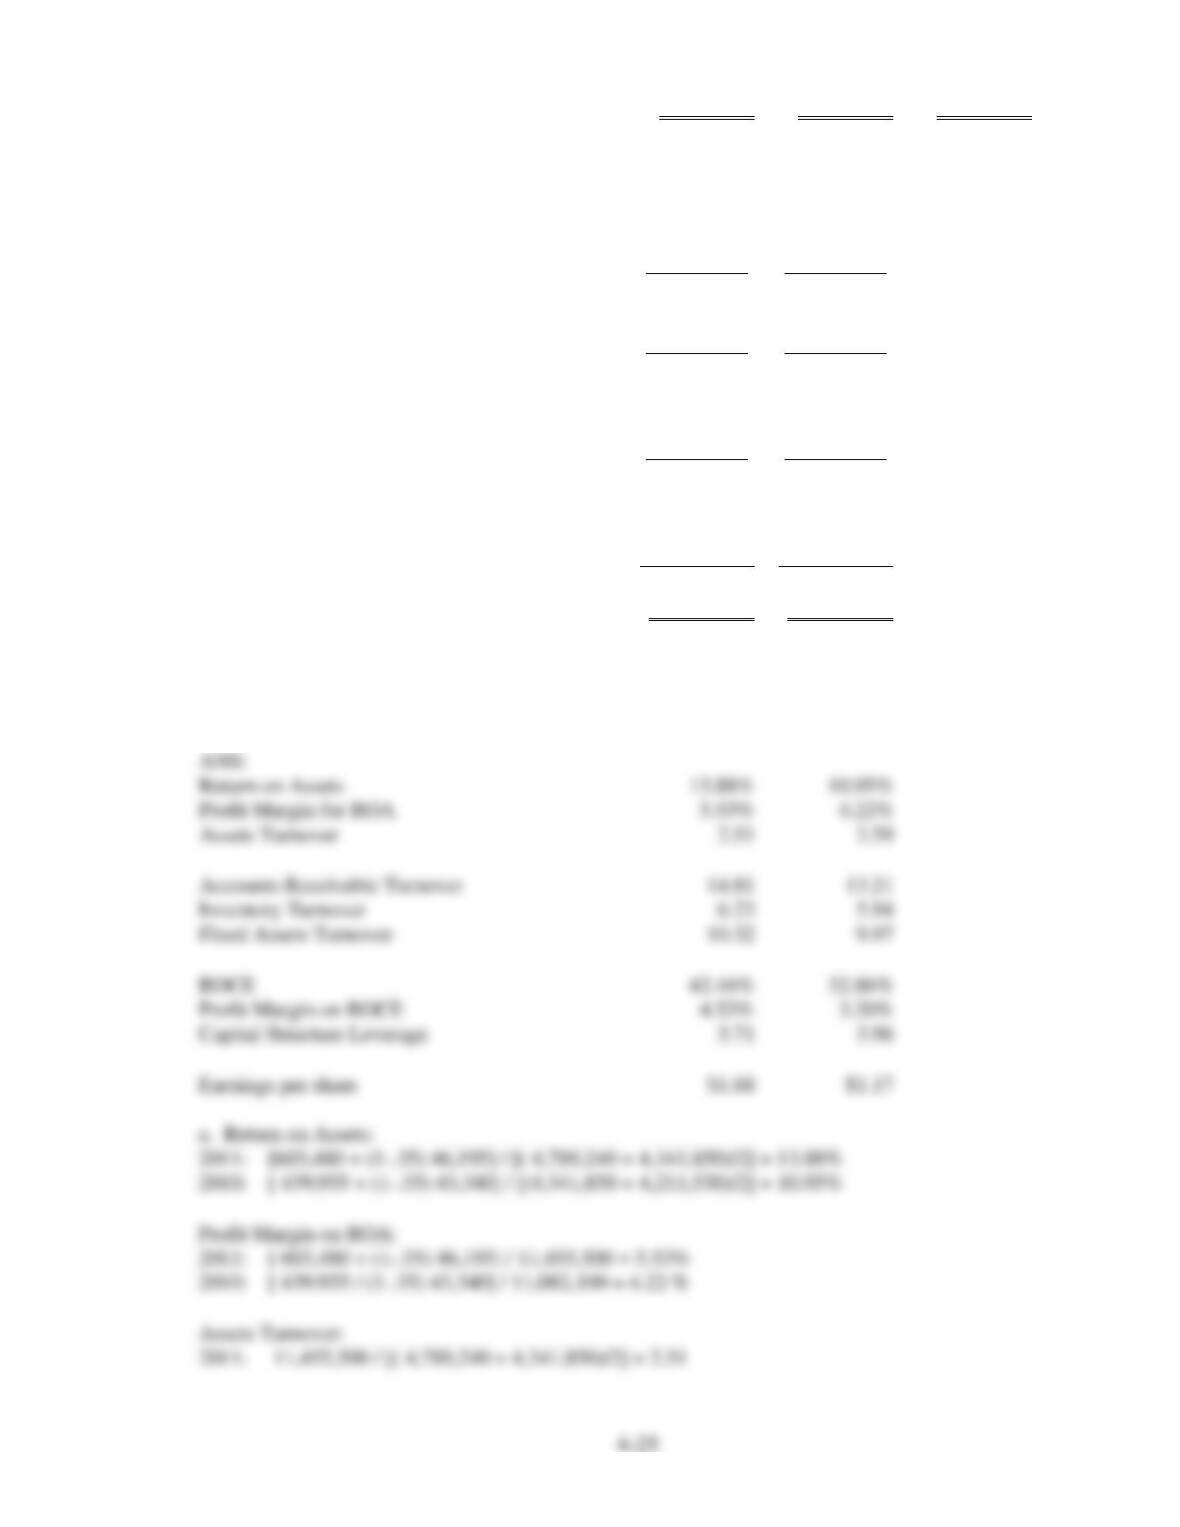
Calculate the following ratios for All Sports and Extreme Sports:
a. Return on assets
b. Profit margin for ROA
c. Assets turnover
d. Accounts receivable turnover
e. Inventory turnover
f. Fixed asset turnover
4-21
PROBLEM
1. Grundig Technologies is a manufacturer. Below are the company’s two most recent balance sheets and
its most recent income statement. Use this information to answer the following questions:
a.
Calculate the rate of return on assets (ROA) for 2011. Disaggregate ROA into the profit
margin for ROA and total assets turnover components.
b.
Calculate the rate of return on common stockholders’ equity (ROCE) for 2011.
Disaggregate ROCE into the profit margin for ROCE, total assets turnover and capital
structure leverage components.
c.
Did financial leverage work to the advantage of the common shareholders during 2011?
Explain.
Grundig Technologies
Balance Sheet
As of December 31
ASSETS
2011
2010
Cash
$ 69,000
$ 22,000
Accounts Receivable
82,000
66,000
Supplies
15,000
19,000
Inventories
180,000
189,000
Land
75,000
110,000
Equipment
260,000
200,000
Accumulated Deprec.-EQ.
(69,000)
(42,000)
TOTAL ASSETS
$612,000
$564,000
LIABILITIES
Accounts Payable
$ 34,000
$ 47,000
Unearned Rent
15,000
19,000
Bonds Payable
150,000
200,000
Stockholders’ Equity
Common Stock( $1 Par Value)
214,000
164,000
Retained Earnings
199,000
134,000
TOTAL LIABILITIES AND EQUITY
$612,000
$564,000
Grundig Technologies
Income Statement
For the year ended December 31, 2011
Sales
$560,000
Cost of Goods Sold
($320,000)
Gross Profit
$240,000
4-22
General and Administrative Expense
($38,000)
Selling Expense
($27,000)
Interest Expense
($17,000)
Income before Income taxes
$158,000
Income Tax Expense (35%)
($55,300)
Net Income
$102,700
2. Use the following information about Sanibel Corporation to calculate the following ratios for 2011
(assume an effective tax rate of 35%):
a.
Return on Assets
b.
Profit margin for ROA
c.
Assets Turnover
d.
Return on Common Shareholders’ Equity
e.
Profit Margin for ROCE
f.
Accounts Receivable Turnover
g.
Inventory Turnover
h.
Fixed Asset Turnover
Sanibel Corporation
Balance Sheet
As of December 31,
2011
2010
Assets:
Cash and cash equivalents
$ 712,300
$ 425,000
Accounts Receivable
408,000
106,250
Inventory
510,000
612,000
Current Assets
1,630,300
1,143,250
Equipment
714,000
654,500
Less: Accumulated depreciation
(238,000)
(119,000)
Land
425,000
170,000
Total assets
$2,531,300
$1,848,750
Liabilities
Accounts Payable
$ 297,500
$ 382,500
Accrued Salaries Payable
93,500
136,000
Rent Expense Payable
37,400
17,000
Income Tax Payable
117,300
68,000
Current Liabilities
545,700
603,500
a.
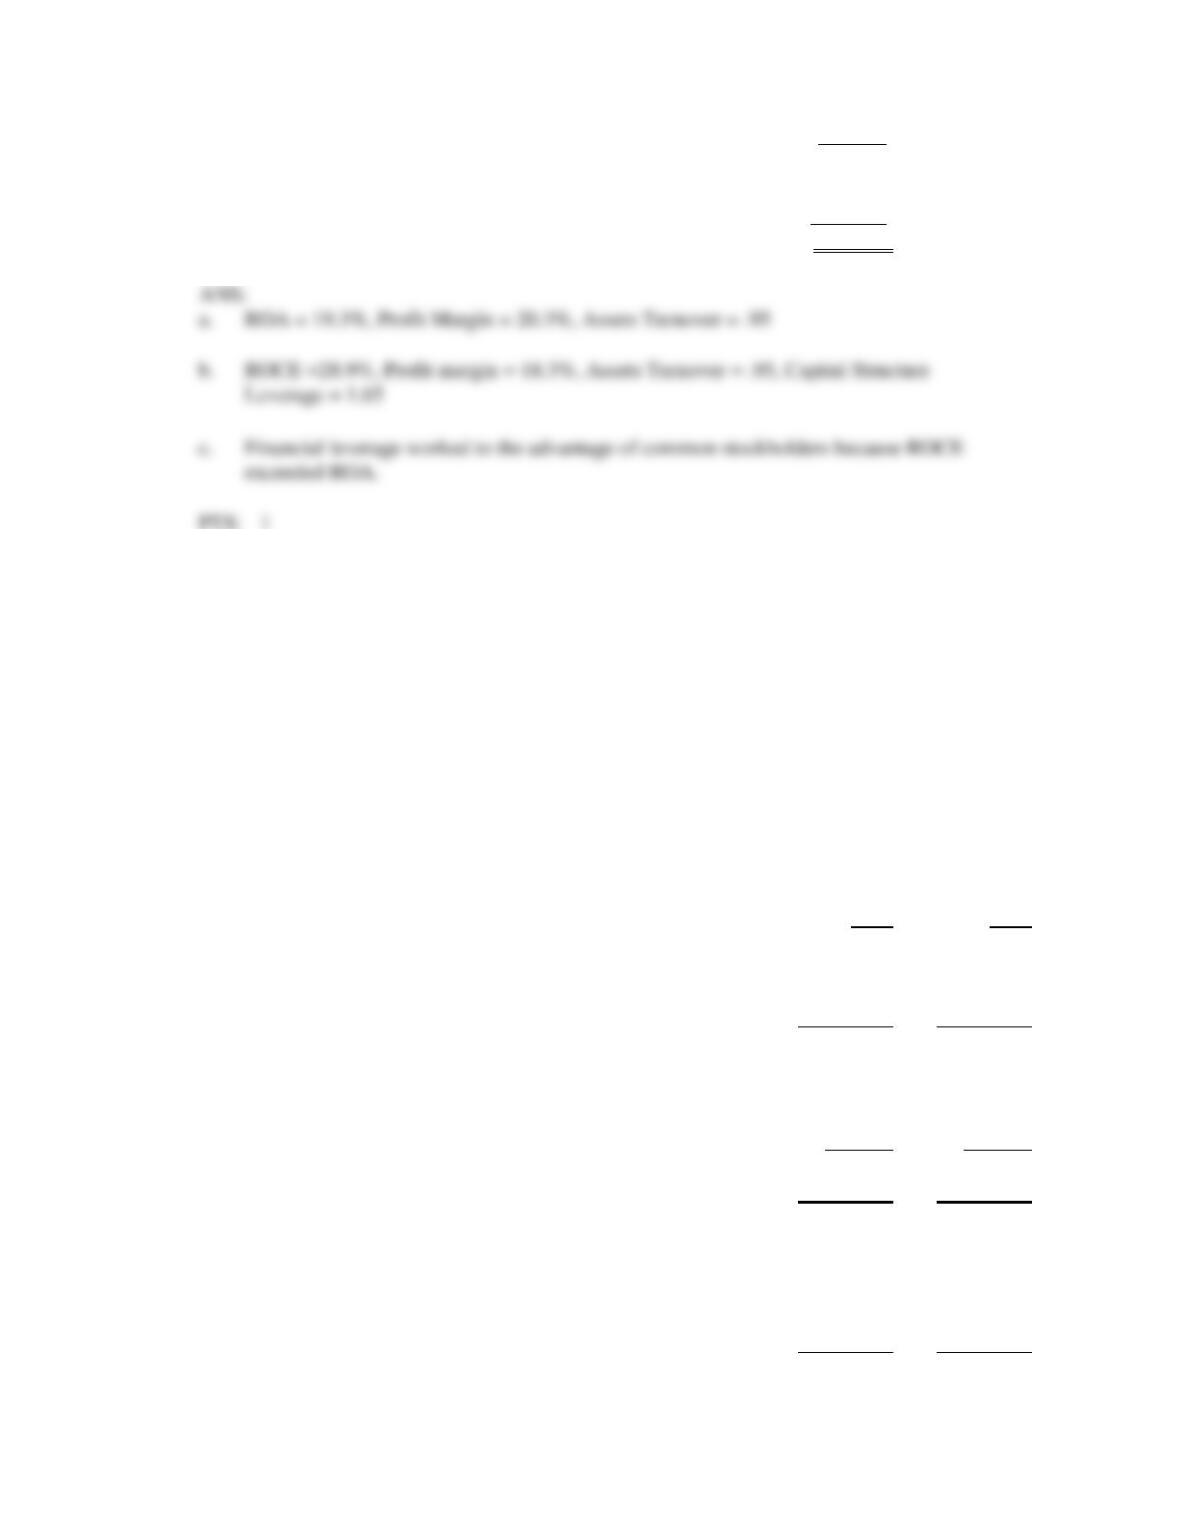
ROA = 19.3%, Profit Margin = 20.3%, Assets Turnover = .95
b.
ROCE =28.9%, Profit margin = 18.3%, Assets Turnover = .95, Capital Structure
Leverage = 1.65
Long-term note payable
850,000
510,000
Total Liabilities
1,395,700
1,113,500
Stockholders’ Equity:
Common stock
714,000
510,000
Retained earnings
421,600
225,250
Total liabilities and stockholders’ equity
$2,531,300
$1,848,750
Sanibel Corporation
Income Statement
For the year ended December 31, 2011
Revenues
$2,499,000
Cost of goods sold
(1,428,000)
Gross Profit
1,071,000
Operating Expenses
Depreciation expense
(112,000)
Salary expense
(233,600)
Insurance Expense
(40,000)
Rent Expense
(160,000)
Interest Expense
(67,200)
Total Operating Expenses
(612,800)
Income from Operations
458,200
Income Tax Expense
(160,370)
Net income
$ 297,830
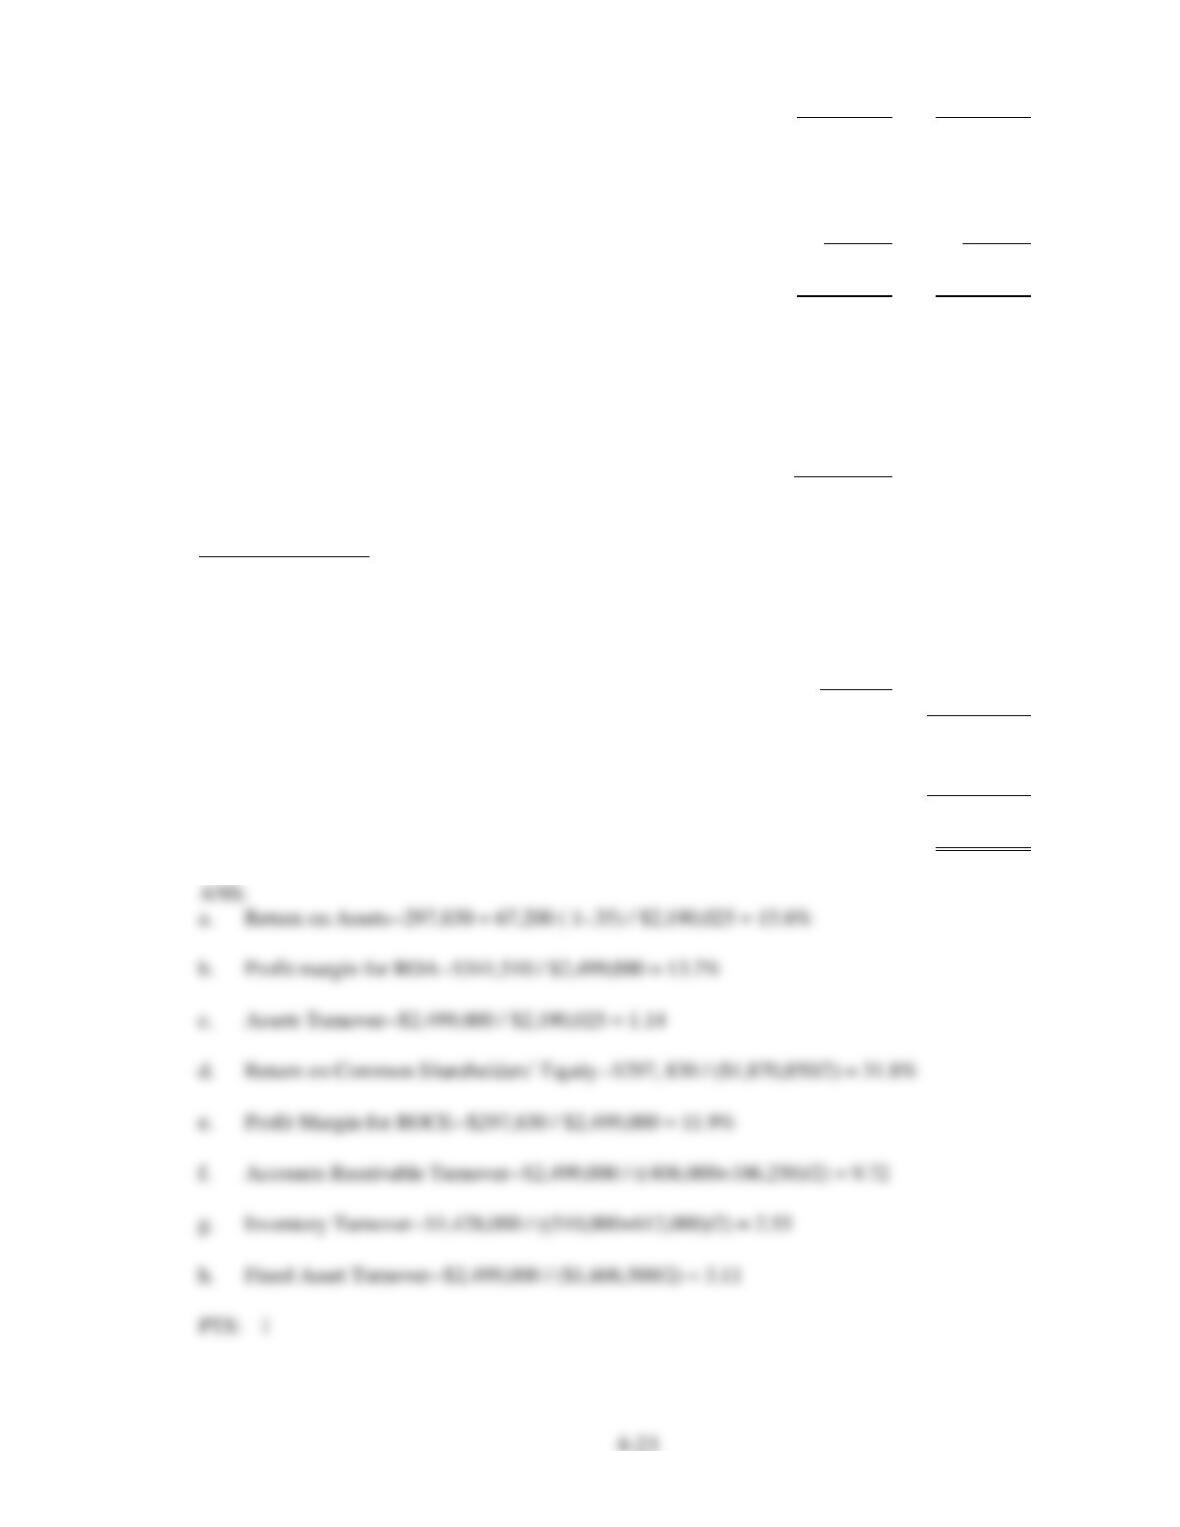
Return on Assets—297,830 + 67,200 ( 1-.35) / $2,190,025 = 15.6%
Profit margin for ROA—$341,510 / $2,499,000 = 13.7%
Assets Turnover—$2,499,000 / $2,190,025 = 1.14
Return on Common Shareholders’ Equity—$297, 830 / ($1,870,850/2) = 31.8%
Accounts Receivable Turnover—$2,499,000 / ((408,000+106,250)/2) = 9.72
Inventory Turnover—$1,428,000 / ((510,000+612,000)/2) = 2.55
Fixed Asset Turnover—$2,499,000 / ($1,606,500/2) = 3.11

4-24
3. The following balance sheets and income statements are for Net Devices Inc., a manufacturer of small
electronic devices, including calculators, personal digital assistants and mp3 players. Use the
information to calculate the following information:
a.
Compute the rate of return on assets for Net Devices for both 2011 and 2010. Disaggregate
the rate of return on assets into the profit margin on ROA and asset turnover components.
The income tax rate is 35%.
b.
Calculate the accounts receivable turnover ratio for Net Devices for 2011 and 2010. All of
the company’s sales were made on account.
c.
Calculate the inventory turnover ratio for Net Devices for 2011 and 2010.
d.
Calculate the fixed assets turnover ratio for Net Devices for 2011 and 2010.
e.
Calculate the rate of return on common shareholders’ equity for Net Devices for 2011 and
2010. The amount of preferred dividends paid each year appear after the income statement.
Calculate profit margin for ROCE.
f.
Determine Net Devices capital structure leverage for 2011 and 2010.
g.
Calculate Net Devices earnings per share for 2011 and 2010.
ASSETS (in thousands)
Fiscal year end
2011
2010
2009
Cash
$ 875,650
$ 571,250
$ 154,230
Marketable securities
6,560
0
0
Receivables
771,580
775,250
902,000
Inventories
1,320,150
1,254,600
1,418,500
Other current assets
249,000
231,200
229,900
Total current assets
3,222,940
2,832,300
2,704,630
Property, plant & equipment
1,118,750
1,100,300
1,122,400
Intangibles
263,050
241,000
215,600
Deposits & other assets
184,500
168,250
168,900
Total assets
$4,789,240
$4,341,850
$4,211,530
LIABILITIES (in thousands)
Fiscal year end
2011
2010
2009
Accounts payable
$1,178,540
$1,061,100
$1,138,250
Current long term debt
18,100
316,500
150,900
Accrued expenses
664,100
615,900
585,400
Income taxes payable
138,900
108,400
38,200
Other current liabilities
0
0
0
Total current liabilities
1,999,640
2,101,900
1,912,750
Long term debt
478,250
378,400
599,630
Other long term liabilities
13,350
0
0
Total liabilities
2,491,240
2,480,300
2,512,380
Preferred stock
850,000
850,000
550,000
Common stock net
4,000
3,950
3,800
Additional Paid-in Capital
869,000
758,000
689,500
Retained earnings
1,430,500
1,055,000
1,245,050
Treasury stock
(855,500)
(805,400)
(789,200)
Shareholders’ equity
2,298,000
1,861,550
1,699,150
Total Liab. & Equity
$4,789,240
$4,341,850
$4,211,530
INCOME STATEMENT (in thousands)
Fiscal year end
2011
2010
Net sales
$11,455,500
$11,082,100
Cost of Goods Sold
(8,026,450)
(7,940,065)
Gross profit
3,429,050
3,142,035
Selling, general & admin. Exp.
(1,836,400)
(1,789,200)
Income before deprec. & amort.
1,592,650
1,352,835
Depreciation & amortization
(785,250)
(757,250)
Interest expense
(46,195)
(43,340)
Income before tax
761,205
552,245
Provision for income taxes
(157,725)
(112,290)
Minority interest
—
—
Net income
$ 603,480
$ 439,955
ADDITIONAL INFORMATION
Outstanding shares
308,515,000
303,095,000
Preferred Dividends—Total
$85,000,000
$85,000,000
Return on Assets
Profit Margin for ROA
Assets Turnover
Accounts Receivable Turnover
Inventory Turnover
Fixed Assets Turnover
Profit Margin on ROCE
Capital Structure Leverage
Earnings per share
a. Return on Assets:
[603,480 + (1-.35) 46,195] / [( 4,789,240 + 4,341,850)/2] = 13.88%
[ 439,955 + (1–.35) 43,340] / [(4,341,850 + 4,211,530)/2] = 10.95%
Profit Margin on ROA:
[ 603,480 + (1-.35) 46,195] / 11,455,500 = 5.53%
[ 439,955 / (1-.35) 43,340] / 11,082,100 = 4.22 %
Assets Turnover:
4-26
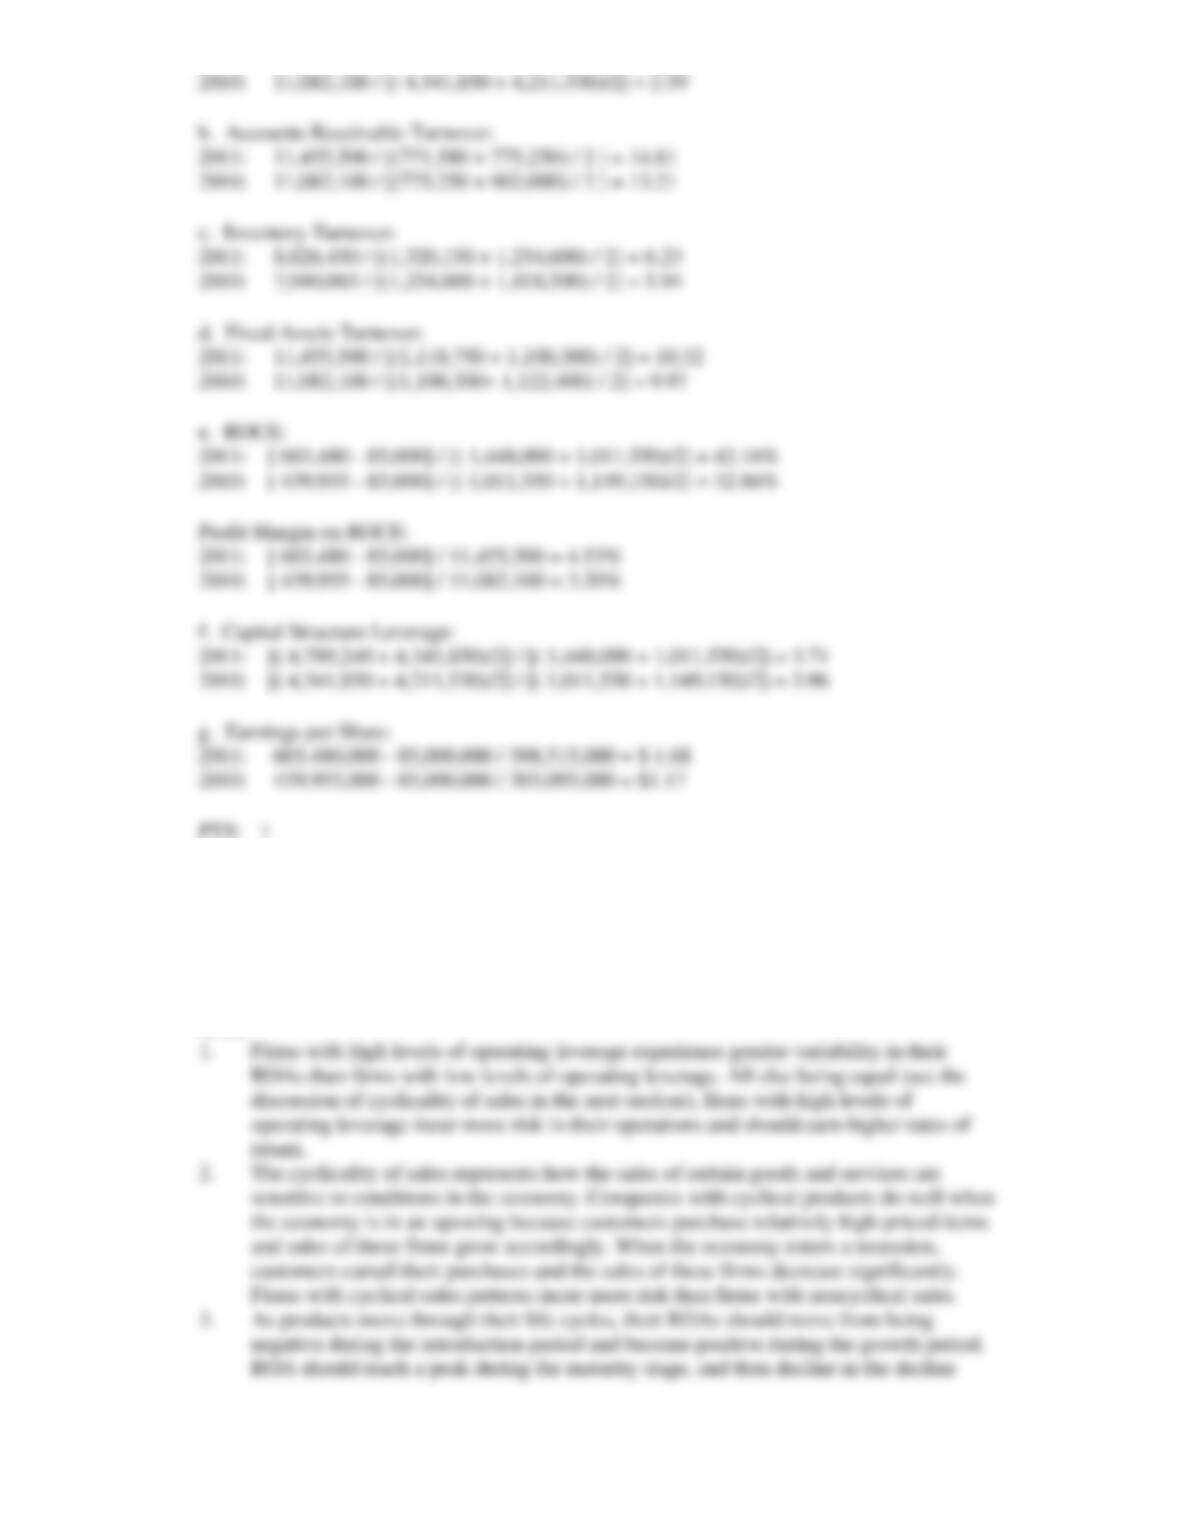
4. Discuss how the following three elements of risk help us understand return on assets differs across
firms and changes over time:
1. Operating leverage
2. Cyclicality of sales
3. Product life cycle
ANS:
4-27
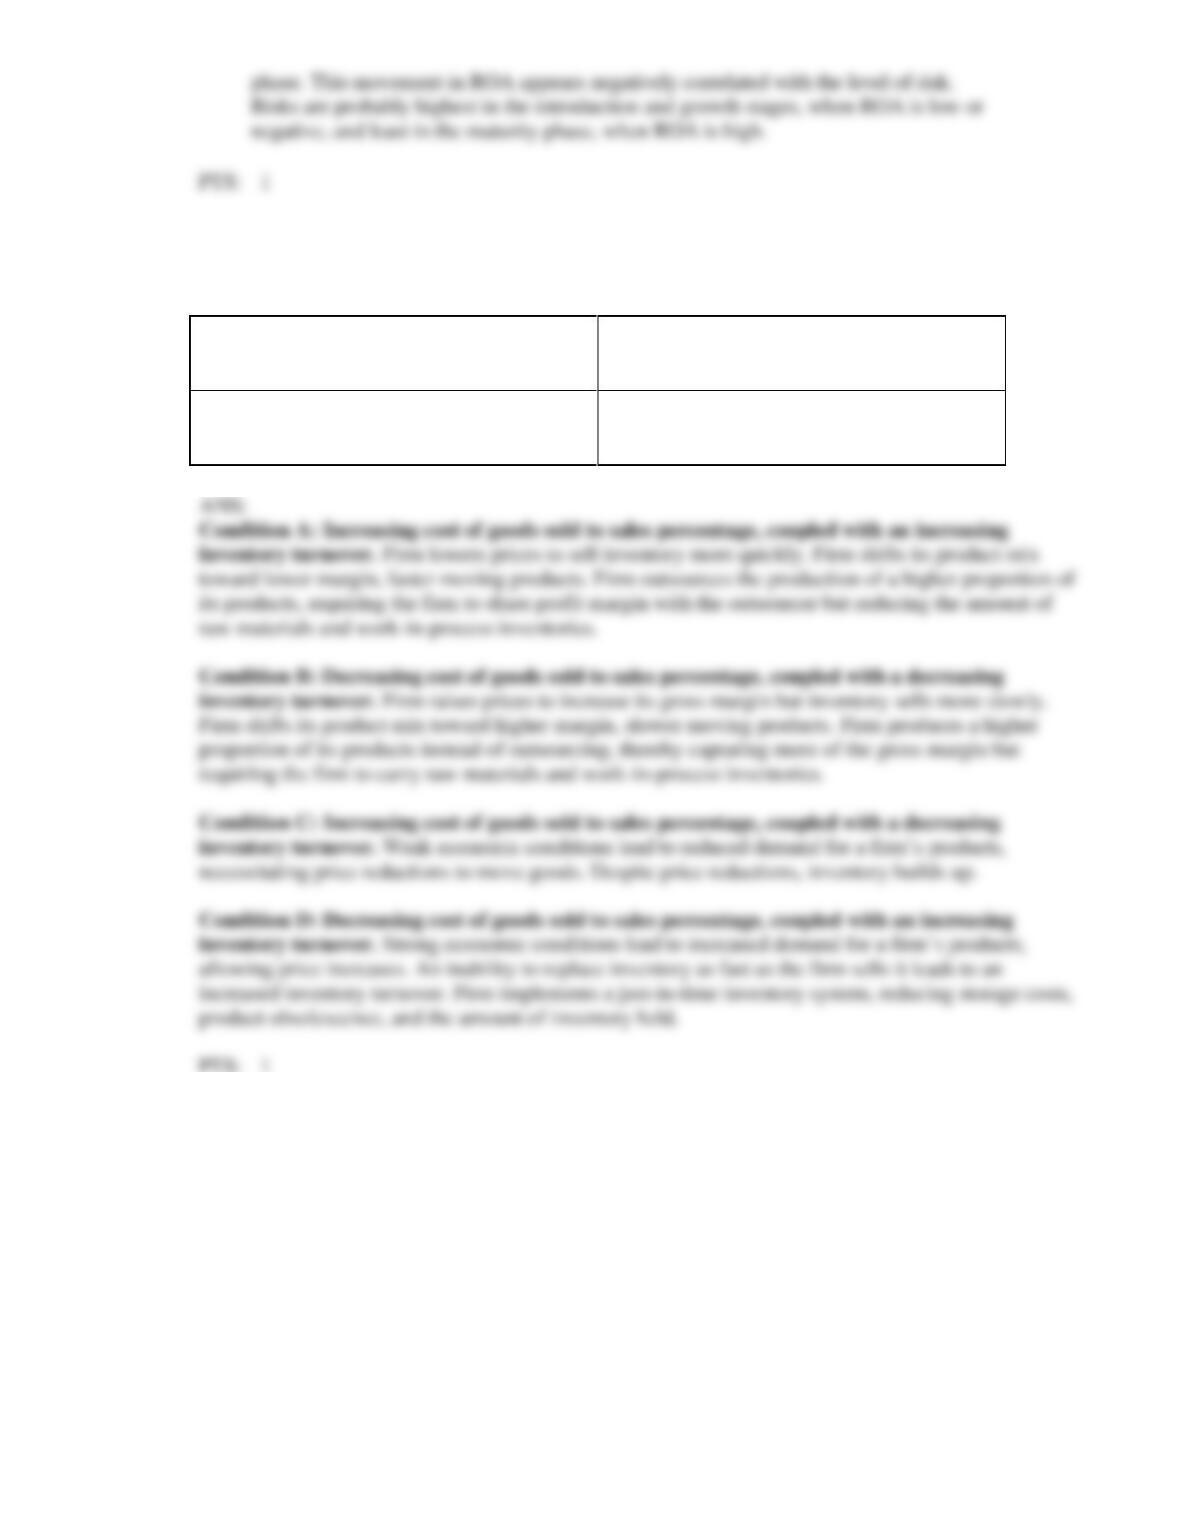
5. Examine the four following conditions involving inventory turnover. Discuss what economic factors
might be leading to the condition and whether it suggests positive or negative future economic
conditions.
Condition A: Increasing cost of goods sold
to sales percentage, coupled with an
increasing inventory turnover.
Condition B: Decreasing cost of goods sold
to sales percentage, coupled with a
decreasing inventory turnover.
Condition C: Increasing cost of goods sold
to sales percentage, coupled with a
decreasing inventory turnover.
Condition D: Decreasing cost of goods sold
to sales percentage, coupled with an
increasing inventory turnover.
6. Carridine Company reported net income of $1,903 on revenues of $55,618 for Year 4. Interest expense
totaled $459, and preferred dividends totaled $13.5. Average total assets for Year 4 were $17,500. The
income tax rate is 40 percent. Average preferred shareholders’ equity totaled $250, and average
common shareholders’ equity totaled $7,500. Assume that all the following amounts are in thousands.
REQUIRED:
a. Compute the rate of ROA. Disaggregate ROA into profit margin for ROA and assets
turnover components.
b. Compute the rate of ROCE. Disaggregate ROCE into profit margin for ROCE, assets
turnover, and capital leverage ratio components.
c. Calculate the amount of net income to common shareholders derived from the
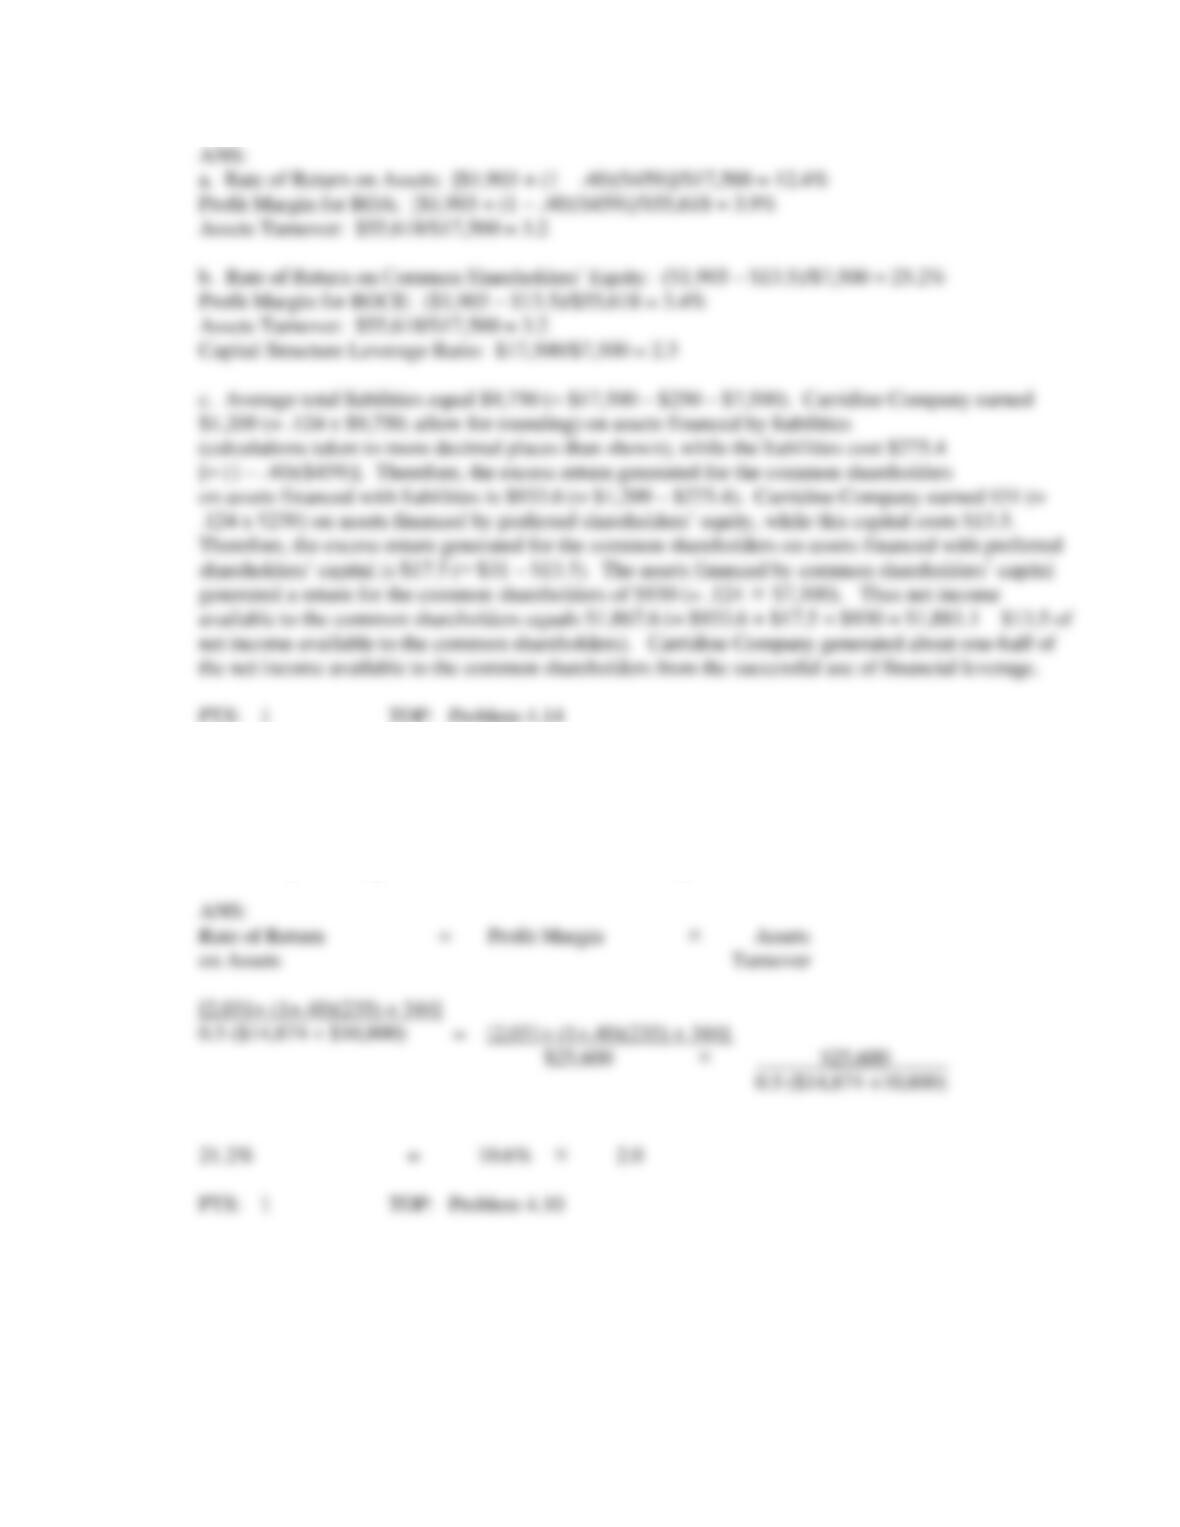
4-28
excess return on creditors’ capital, the excess return on preferred shareholders’ capital,
and the return on common shareholders’ capital.
7. Freedom Company reported net income for 2010 of $2,031 million on sales of $25,600 million.
Interest expense for 2010 was $235 million, and minority interest was $344 million for 2010. The
income tax rate is 40 percent. Total assets were $10,800 million at the beginning of 2010 and $14,874
million at the end of 2010. Compute the rate of ROA for 2010 and disaggregate
ROA into profit margin for ROA and asset turnover components.
8. Rattigan Industries reported net income (amounts in thousands) for Year 4 of $60,615 on sales of
$1,560,235. It declared preferred dividends of $22,100. Preferred shareholders’
equity totaled $265,750 at both the beginning and end of Year 4. Common shareholders’ equity totaled
$298,150 at the beginning of Year 4 and $365,000 at the end of Year
4. Rattigan had no minority interest in its equity. Total assets were $1,440,000 at the beginning of Year
4 and $1,550,000 at the end of Year 4.
9. Krane, Inc.reported net income (amounts in thousands) of $619,700 for Year 4.Included in net income
was income tax expense of $10,400. During the year the company paid the preferred shareholders
$9,000 in dividends. The weighted average of common shares outstanding during Year 4 was 468,810
shares. Krane Inc., subtracted interest expense net of tax saving on convertible debt of $4,820. If the
convertible debt had been converted into common stock, it would have increased the weighted average
common shares outstanding by 20,905 shares. Krane Inc., has outstanding stock options that, if
exercised, would increase the weighted average of common shares outstanding by 7,335 shares.
REQUIRED:
Compute basic and diluted earnings per share for Year 4, showing supporting computations.
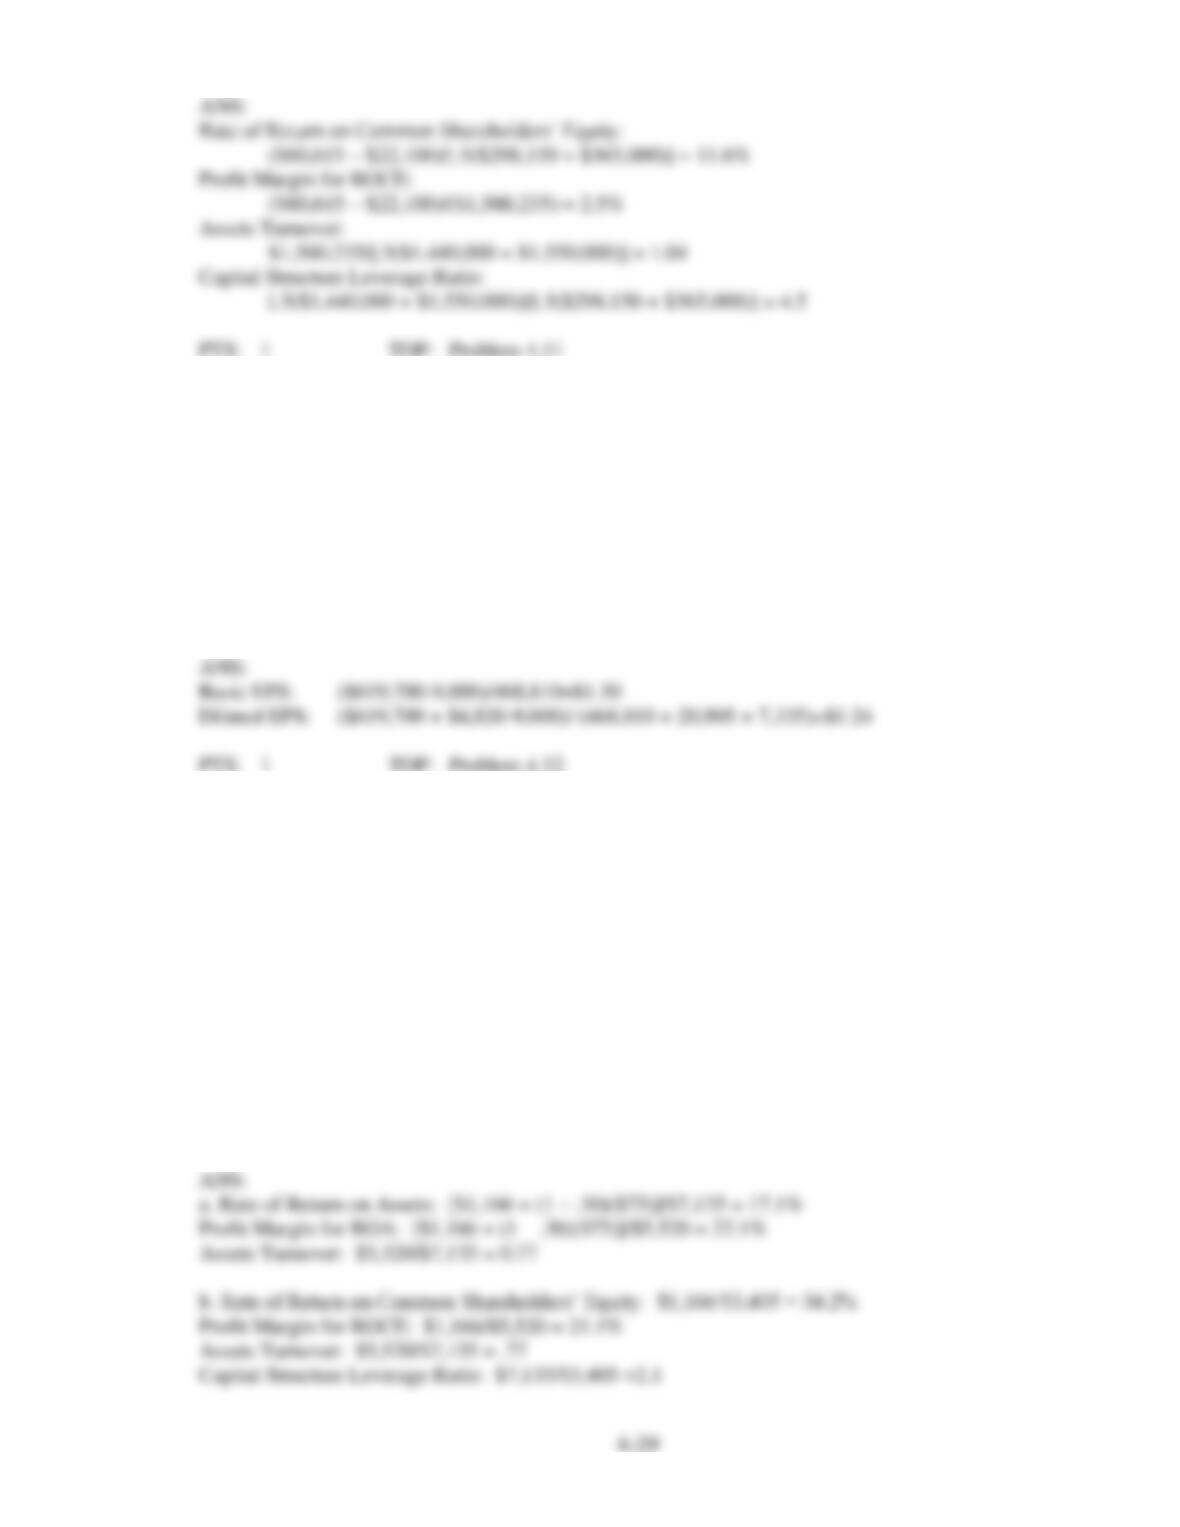
10. Raleigh Manufacturing reported net income (amounts in millions) of $1,166 on sales of $5,520 during
Year 4. Interest expense totaled $75. The income tax rate was 30 percent. Average total assets were
$7,135, and average common shareholders’ equity was $3,405. The firm did not have preferred stock
outstanding or minority interest in its equity.
REQUIRED:
a. Compute the rate of ROA. Disaggregate ROA into profit margin for ROA and assets
turnover components.
b. Compute the rate of ROCE. Disaggregate ROCE into profit margin for ROCE, assets
turnover, and capital structure leverage ratio components.
c. Calculate the amount of net income to common shareholders derived from the
excess return on creditors’ capital and the amount from the return on common
shareholders’ capital.
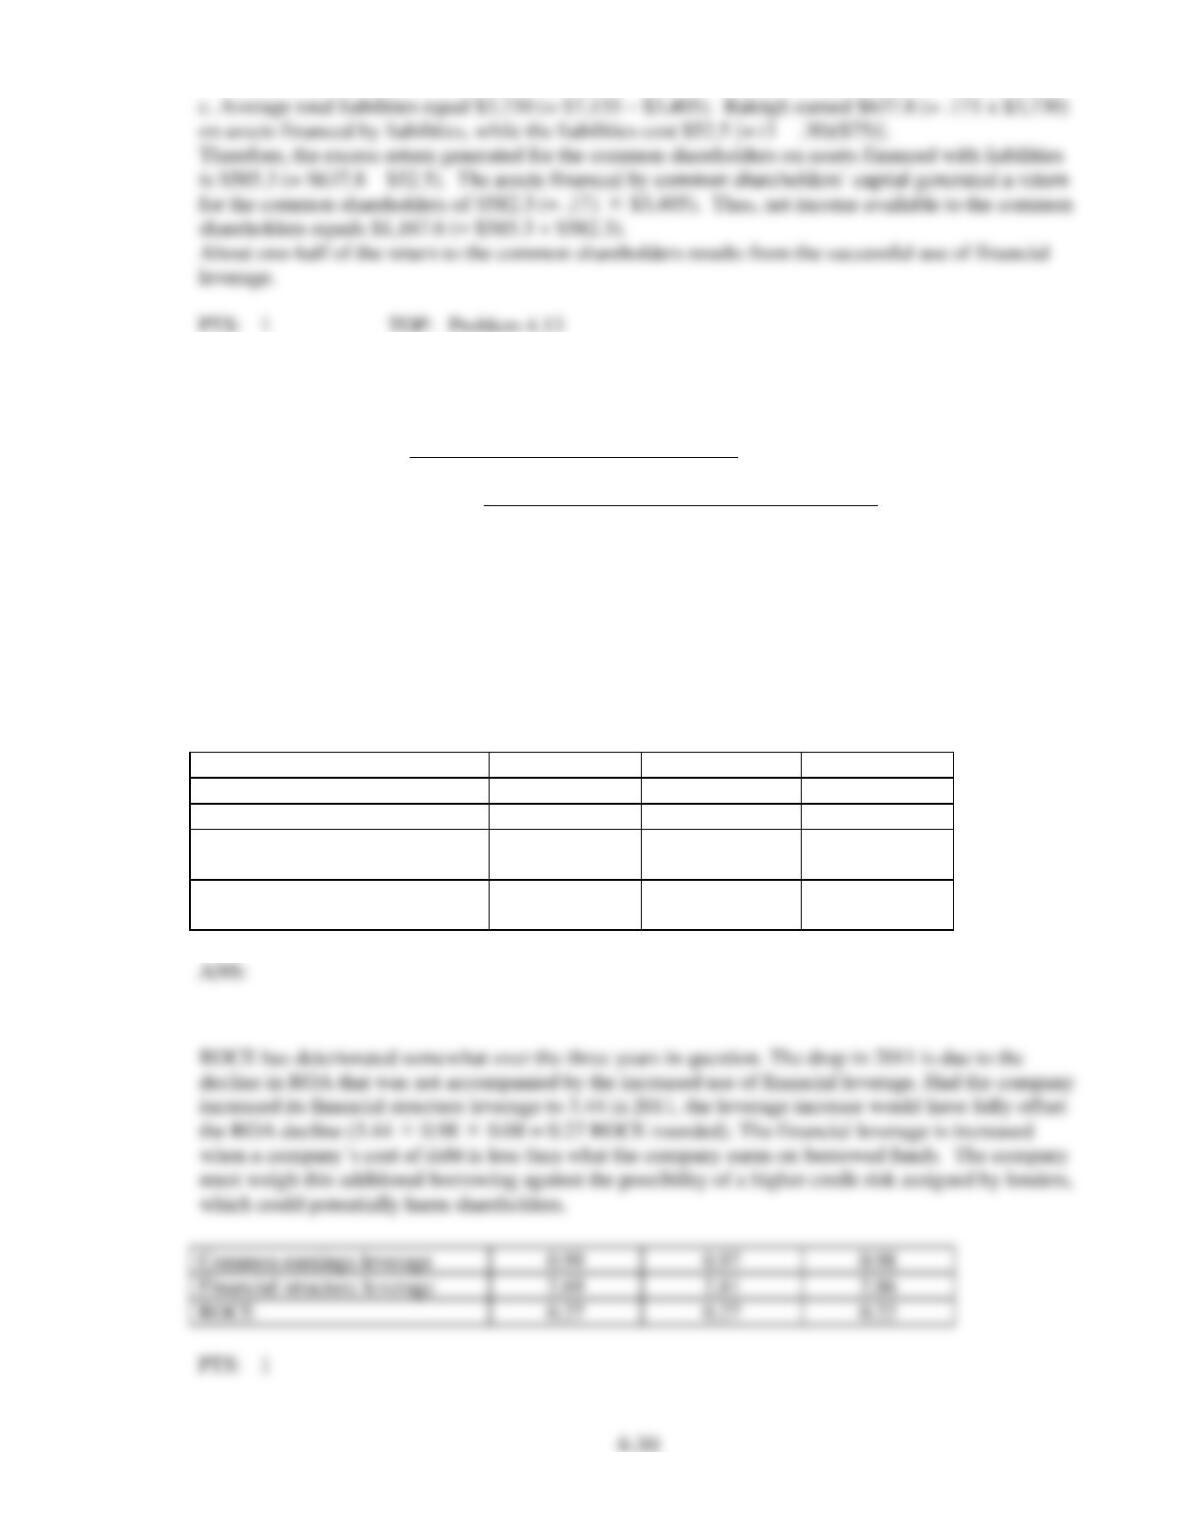
11. Below are three relationships that are important to the determination of profitability. Assume assets
were $22,900,000 on Dec. 31, 2008.
1. Operating leverage = Earnings before interest but after taxes
Average assets.
2. Financial structure leverage = Net income available to common shareholders
Earnings before interest but after taxes
3. ROCE = ROA Common earnings leverage Financial structure leverage
REQUIRED:
Compute the operating leverage, financial structure leverage, and ROCE (rounded to two places).
Then use these relationships to analyze how the profitability of X-Mart changed over the three year
period below. What does the company need to do to reverse this trend? What are the risks of your
strategy?
As of Dec. 31
2009
2010
2011
ROA
0.10
0.10
0.08
Assets
$27,500,000
$23,000,000
$27,600,000
Net income available to common
shareholders
$67,250,000
$68,960,210
$70,910,840
Earnings after taxes but before
interest
$25,000,000
$24,541,000
$24,794,000
Common earnings leverage
0.99
0.97
0.98
ROCE
0.27
0.27
0.22