CHAPTER 4—ENERGY, ENZYMES, AND BIOLOGICAL REACTIONS
MULTIPLE CHOICE
1. The term that best describes all of the chemical reactions of a cell, including acquisition and use of
molecules and energy, is
a.
metabolism.
b.
anabolism.
c.
catabolism.
d.
energy budget.
e.
thermodynamics.
2. The enzyme-catalyzed rate for a reaction that removes a phosphate group from a molecule is
a.
1012 years.
b.
10 milliseconds.
c.
1021 milliseconds.
d.
slower than the uncatalyzed rate.
e.
faster at 1000oC than 100oC.
3. Which of the following is not a form of energy?
a.
heat
b.
diffusion
c.
sound
d.
light
e.
gamma radiation
4. A child swinging on a swing utilizes which type (or types) of energy?
a.
kinetic energy only because the child is in constant motion
b.
potential energy only, because the child has to invest energy to get the swing to go
c.
chemical energy only, because it is the child’s metabolism that powers the muscles that
make the swing move
d.
kinetic and potential energy only, but in constantly changing ratios: when changing
direction it is pure potential energy; at the bottom of the arc, it is pure kinetic energy
e.
kinetic, potential, and chemical energy. The child powers the swing with chemical energy
in the muscle cells and the swing moves like a pendulum with changing ratios of kinetic
and potential energy.
5. The ultimate fate of the energy used by organisms is to
a.
be converted into heat.
b.
be converted into offspring.
c.
be recycled repeatedly without loss.
d.
be used as metabolic heat.
e.
move into the environment by conduction.
6. Identify the closed system in the following list.
a.
a human
b.
a gas-powered automobile
c.
a single-celled organism
d.
a propane furnace
e.
the Earth
7. According to the first law of thermodynamics,
a.
matter can be created and destroyed.
b.
matter only changes forms.
c.
energy can be created and destroyed.
d.
energy only changes forms.
e.
matter and energy can be interconverted.
8. Which of the following is a part of the first law of thermodynamics?
a.
Energy can be neither created nor destroyed.
b.
Energy cannot be transformed.
c.
The entropy of the universe is constant.
d.
The entropy of the universe is decreasing.
e.
Potential energy is the energy of motion.
9. In general, the form of energy that is least useful to living organisms is
a.
chemical.
b.
electrical.
c.
heat.
d.
light.
e.
sound.
10. We can calculate whether a reaction is spontaneous by calculating the change in free energy and
accounting for entropy. Your paycheck always lists your gross pay, net (take home) pay, and tax
withholdings. Which of the following best correlates your paycheck to the changes in free energy?
a.
gross = net − tax; free energy = total energy − entropy
b.
net salary = gross salary − tax; free energy = total energy − entropy
c.
tax = gross − net salary; entropy = free energy − total energy
d.
gross salary = tax − net salary; total energy = entropy − free energy
e.
net salary = gross salary + tax; total energy = free energy + entropy
11. During every energy transformation, it can be said that
a.
the entropy of the universe increases.
b.
the entropy of the universe decreases.
c.
there is an increase in the free energy of the universe.
d.
there is a change in the total energy of the universe.
e.
the system becomes more organized.
12. Identify the exergonic reaction in the list below.
a.
burning wood for a campfire
b.
folding laundry
c.
building a tower out of blocks
d.
synthesizing a protein
e.
storing the third slice of pie in the form of fat
13. In a system in which temperature is uniform, free energy is
a.
the energy available to do work.
b.
equivalent to entropy.
c.
the total energy absorbed by the system
d.
the kinetic energy of the system
e.
the total energy of the system.
14. Which of the following is true for exergonic reactions?
a.
A net input of energy is necessary for the reaction to proceed.
b.
The products have less free energy than the reactants.
c.
The products have more free energy than the reactants.
d.
The reactants will always be completely converted to products.
e.
The entropy of the system is reduced.
15. Eating and digesting a candy bar for energy during a sports event is a good example of
a.
catabolism.
b.
anabolism.
c.
converting kinetic energy into potential energy.
d.
metabolism.
e.
converting potential chemical energy into kinetic chemical energy.
16. When a reaction reaches equilibrium,
a.
there is no longer entropy in the system.
b.
the chemical reactions cease.
c.
the rate of the forward and reverse reactions are equal.
d.
the concentration of reactants equals the concentration of products.
e.
ATP is no longer required to drive the reaction.
17. Reversible reactions in a cell rarely reach equilibrium because
a.
the products are generally reactants in other reactions and are thus immediately used.
b.
a cell at equilibrium is dead.
c.
most reactions in a cell are not reversible, allowing the cell to devote additional resources
to regulating the few reversible reactions that do occur.
d.
cells have no way of measuring the relative ratios of reactants and products.
e.
conditions in the cell change too rapidly for any reaction to ever reach equilibrium.
18. Metabolic pathways
a.
are always catabolic.
b.
are always anabolic.
c.
can be either catabolic or anabolic.
d.
are irreversible.
e.
proceed until they reach equilibrium.
19. Which reaction is most likely to have more products than reactants when the reaction reaches
equilibrium?
a.
G = −25 kcal/mol
b.
G = −50 kcal/mol
c.
G = −75 kcal/mol
d.
G = −100 kcal/mol
e.
They will all have the same ratio of products to reactants regardless of the G value.
20. A reaction in progress has
a.
more entropy than the same reaction at equilibrium.
b.
less entropy than the same reaction at equilibrium.
c.
the same entropy than the same reaction at equilibrium.
d.
much less entropy than the same reaction at equilibrium.
e.
an entropy level that is impossible to determine without additional information.
21. When there are more reactants than products for a reaction,
a.
the reaction is pulled towards generating more reactants.
b.
the greater concentration of reactants pushes the reaction forward, toward generating more
products.
c.
the reaction is pulled in the forward direction by the high concentration of products.
d.
the reaction is pushed toward the reactants by the low concentration of products.
e.
the reaction will proceed to completion and no reactants will remain.
22. Hydrolysis of ATP is used to drive all of the following reactions in a cell except for
a.
active transport of solutes.
b.
catabolic reactions.
c.
protein activation.
d.
phosphorylation of target proteins.
e.
all of the other answers reflect functions of ATP in a cell.
23. When ATP is split into ADP and Pi,
a.
the energy is released in the form of heat.
b.
the energy is directly transferred to the target molecule by an unknown mechanism.
c.
the binding of ADP or Pi to the target molecule allows the energy of ATP hydrolysis to be
transferred to the target molecule.
d.
the two remaining phosphates acquire the energy that had been present in the linkage of
three phosphates.
e.
the resulting delta G is positive.
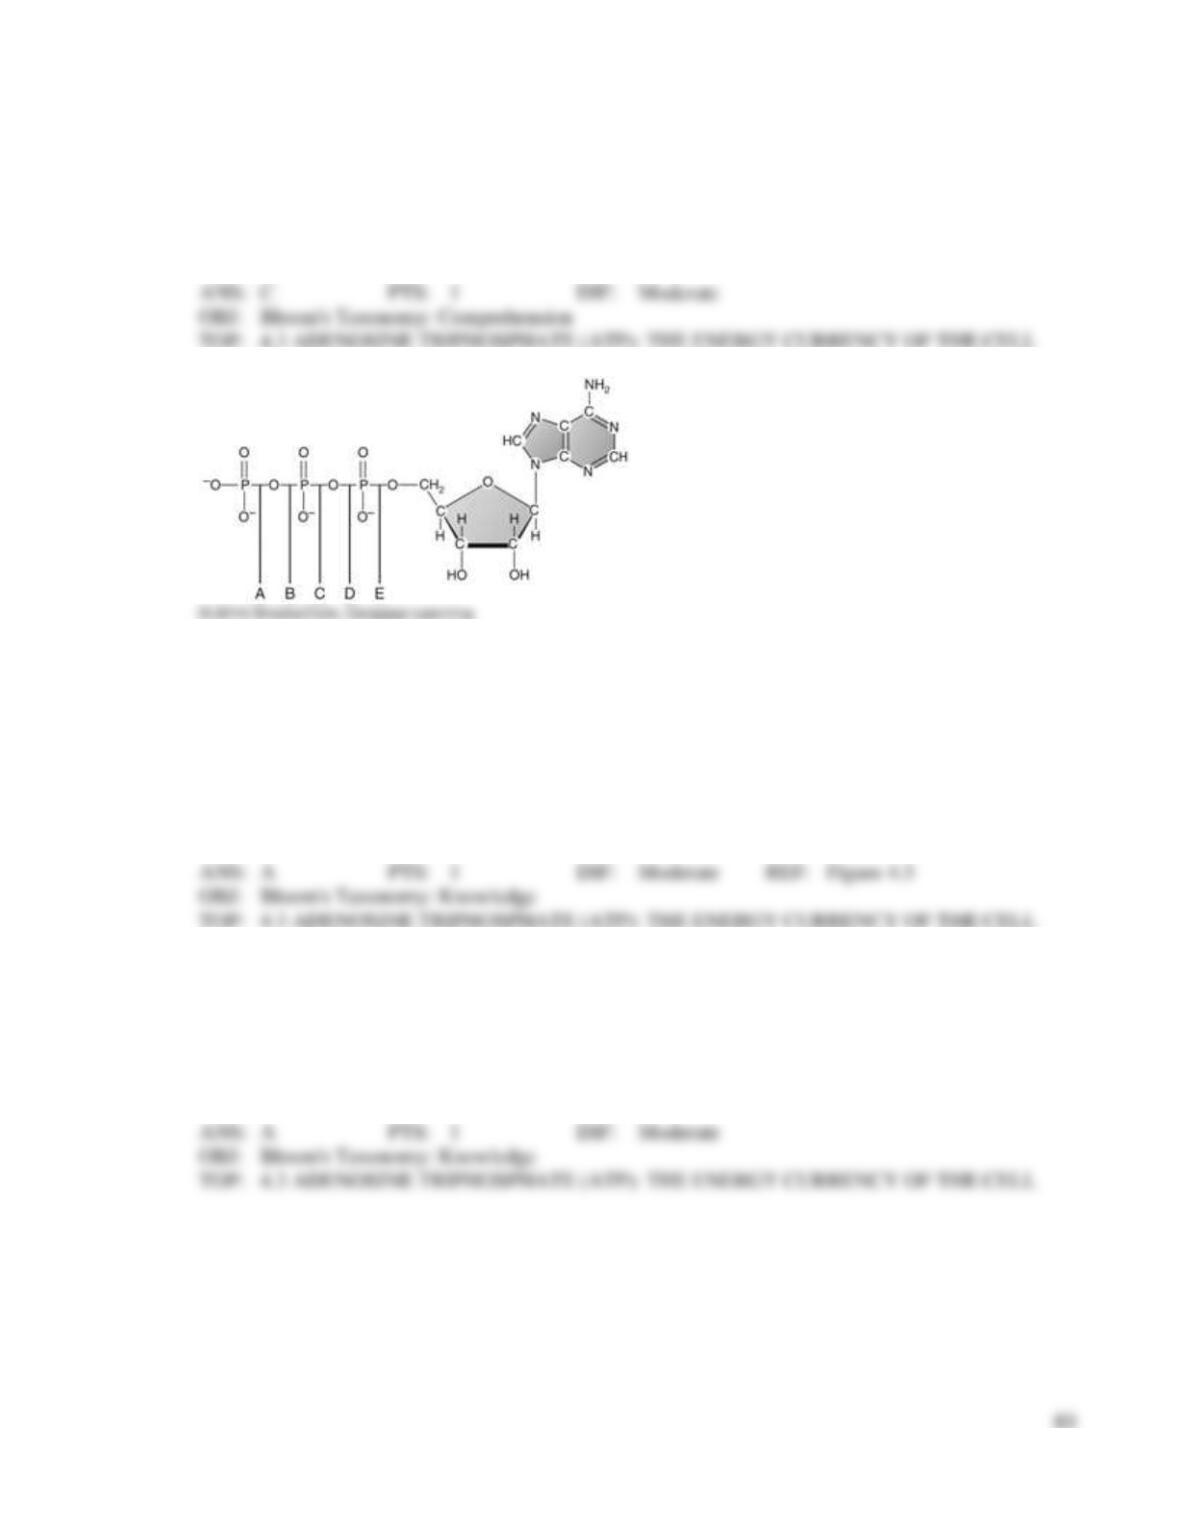
24. In the figure shown above, identify the bond that is cleaved when this molecule is coupled with an
endergonic reaction to drive the endergonic reaction to completion. (The molecule of water also
required for this reaction is not shown.)
a.
A
b.
B
c.
C
d.
D
e.
E
25. The coupling of endergonic to ____ reactions is used to generate ____ in a cell.
a.
exergonic, ATP
b.
endergonic, AMP
c.
exergonic, AMP
d.
endergonic, ATP
e.
endergonic, ADP
26. Enzymes aid in metabolism by
a.
changing the G of the reaction.
b.
adding additional reactants to the system.
c.
slowing the rate of some reactions and increasing the rate of other reactions.
d.
increasing the rate of a reaction.
e.
removing unused reactants from the system.
27. Ribozymes
a.
are RNA catalysts.
b.
are proteins that catalyze RNA synthesis.
c.
are RNA molecules that slow the rate of protein synthesis.
d.
are the products of RNA degradation.
e.
are amino acids that catalyze RNA synthesis
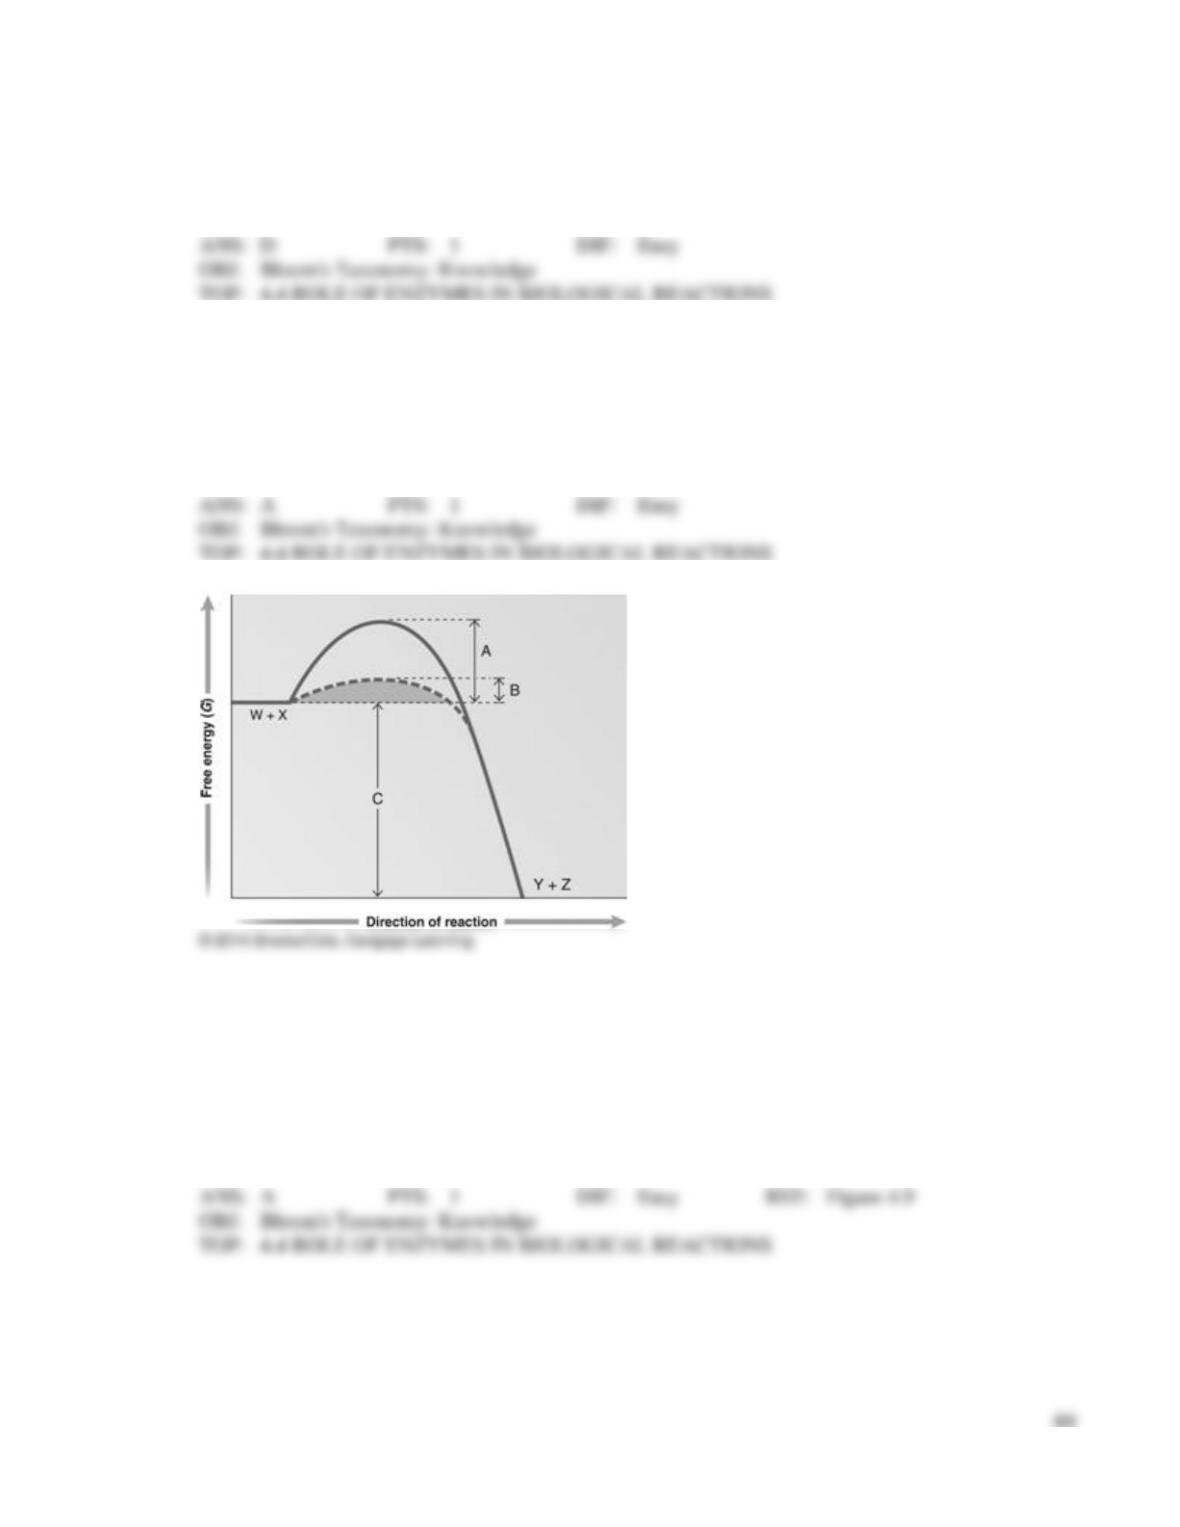
Use the figure above for the following question(s).
28. This portion of the graph shows the activation energy when there is no enzyme.
a.
A
b.
B
c.
C
d.
W + X
e.
Y + Z
29. This portion of the graph shows the activation energy when there is an enzyme.
a.
A
b.
B
c.
C
d.
W + X
e.
Y + Z
30. This portion of the graph shows the free energy of the reaction.
a.
A
b.
B
c.
C
d.
W + X
e.
Y + Z
31. This portion of the graph shows the free energy of the reactants.
a.
A
b.
B
c.
C
d.
W + X
e.
Y + Z
32. This portion of the graph shows the shows the free energy of the products.
a.
A
b.
B
c.
C
d.
W + X
e.
Y + Z
33. The difference between cofactors and coenzymes is that
a.
cofactors are not necessary and coenzymes are necessary.
b.
cofactors can be inorganic or organic, coenzymes are always inorganic.
c.
cofactors can be inorganic or organic, coenzymes are just another name for organic
cofactors.
d.
cofactors are always vitamins, coenzymes are always ions.
e.
cofactors help with essential metabolic reactions, coenzymes assist with nonessential
metabolic reactions.
34. Enzymes
a.
change the rate of a reaction.
b.
change the direction of a reaction.
c.
change the free energy of a reaction.
d.
are used up in a reaction.
e.
are present in concentrations approaching their substrates’ concentrations.
35. Which of the following statements regarding enzymes is true?
a.
Enzymes are permanently altered by the reactions they catalyze.
b.
Enzymes only work on endergonic reactions.
c.
Enzymes alter the chemical composition of the products of a reaction.
d.
Enzymes increase reaction rates.
e.
Enzymes prevent changes in substrate concentrations from having an effect on reaction
rate.
36. Enzymes function primarily by
a.
forcing the reactants into an altered environment which in turn creates a change in the free
energy of the reactants relative to the products.
b.
altering the equilibrium point of a particular reaction to favor the formation of products.
c.
increasing the probability that the reactants will come into close proximity to each other in
the proper orientation for forming the transition state molecule.
d.
removing reactants from solution in a set ratio that enhances the chances of the remaining
individual reactants interacting with each other.
e.
changing the ratio of reactants to products so that the forward reaction is favored.
37. Which of the following does not always alter the activity of the enzyme?
a.
temperature
b.
pH
c.
reactant concentrations
d.
inhibitors
e.
lack of required cofactors
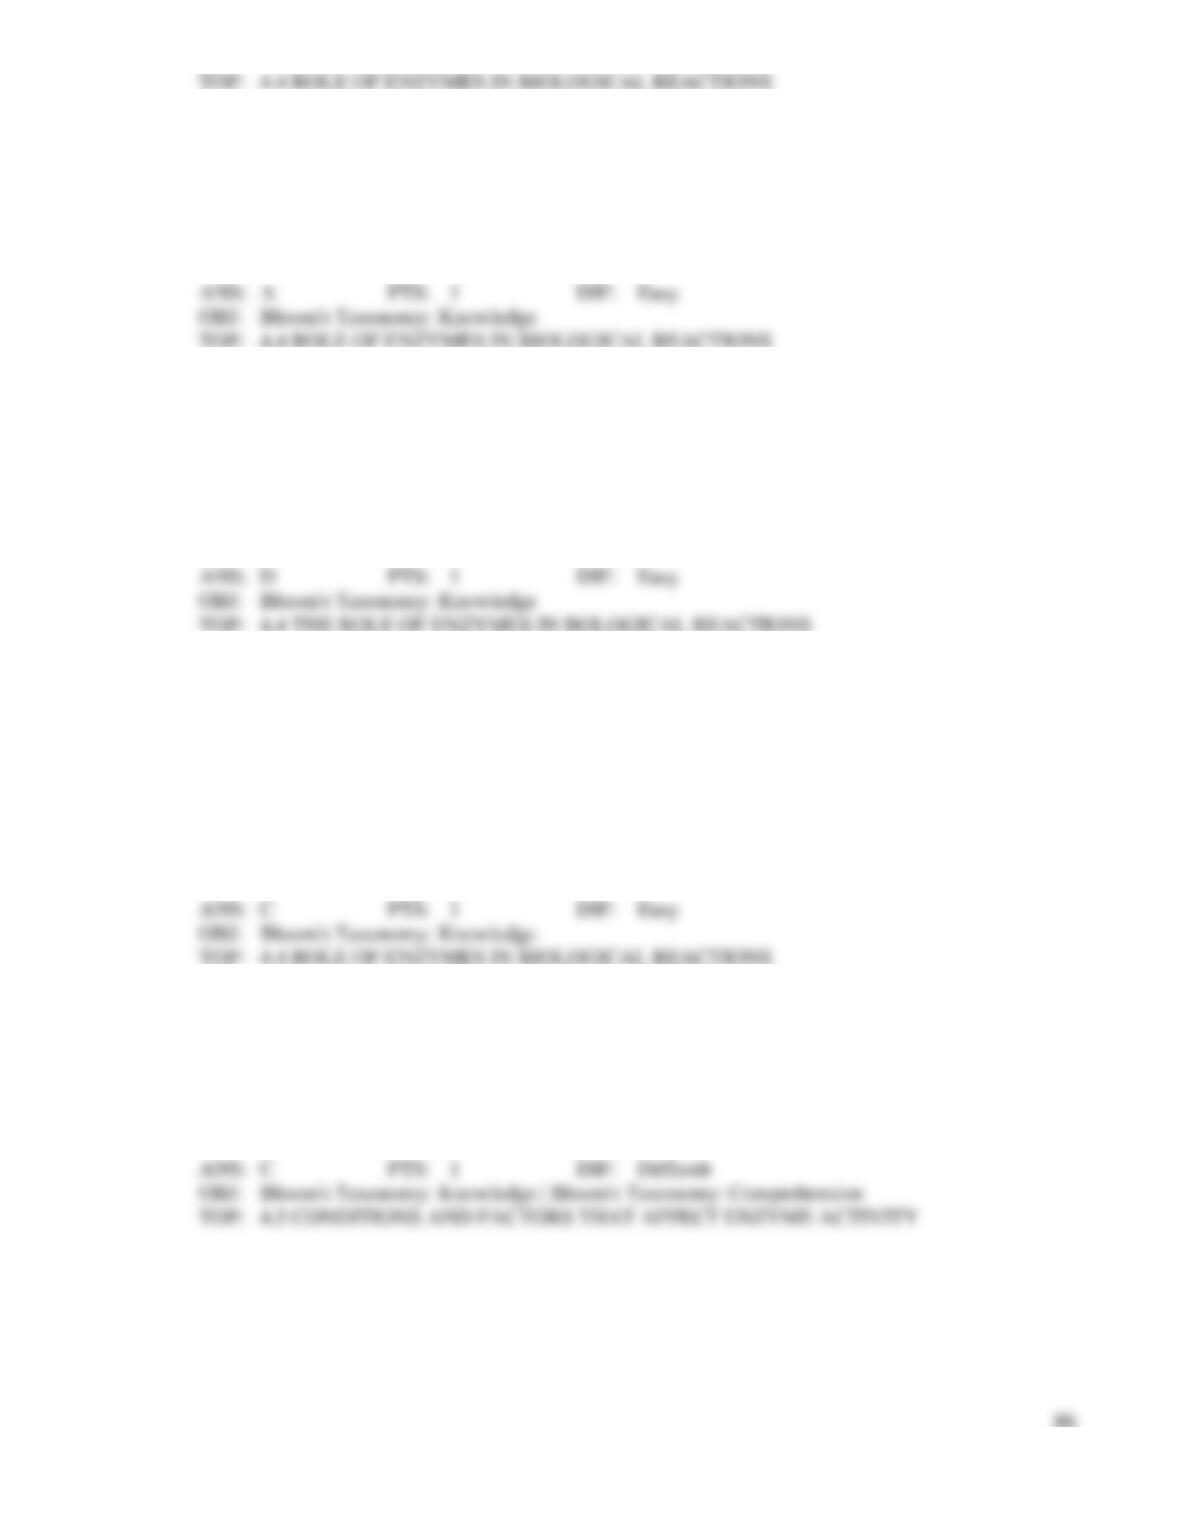
38. In the above figure, why does the curve sharply drop after approximately 45C instead of mirroring the
slope of the line going from 0−40C?
a.
At high temperatures, the reactions proceed so quickly that enzymes are no longer helpful
or required.
b.
This is true of all catalysts and is not due to any special features of enzymes.
c.
The kinetic energy of the reactants is so great that it destabilizes the enzyme and
diminishes the enzyme’s activity.
d.
The kinetic energy of the reactants is lower than that of the products, forcing a change in
enzyme activity.
e.
The enzyme begins to denature above a certain temperature, eliminating all catalytic
activity of the protein.
39. If an enzyme’s optimal temperature is 37C, you also know that
a.
the enzyme has a cofactor.
b.
the enzyme is likely to be active at 30C and at the same reaction rate.
c.
the enzyme will probably be inactive at a pH below 4.5.
d.
the enzyme will completely denature at 38C.
e.
the enzyme’s activity will drop at temperatures above 37C and likely be eliminated by
60C.
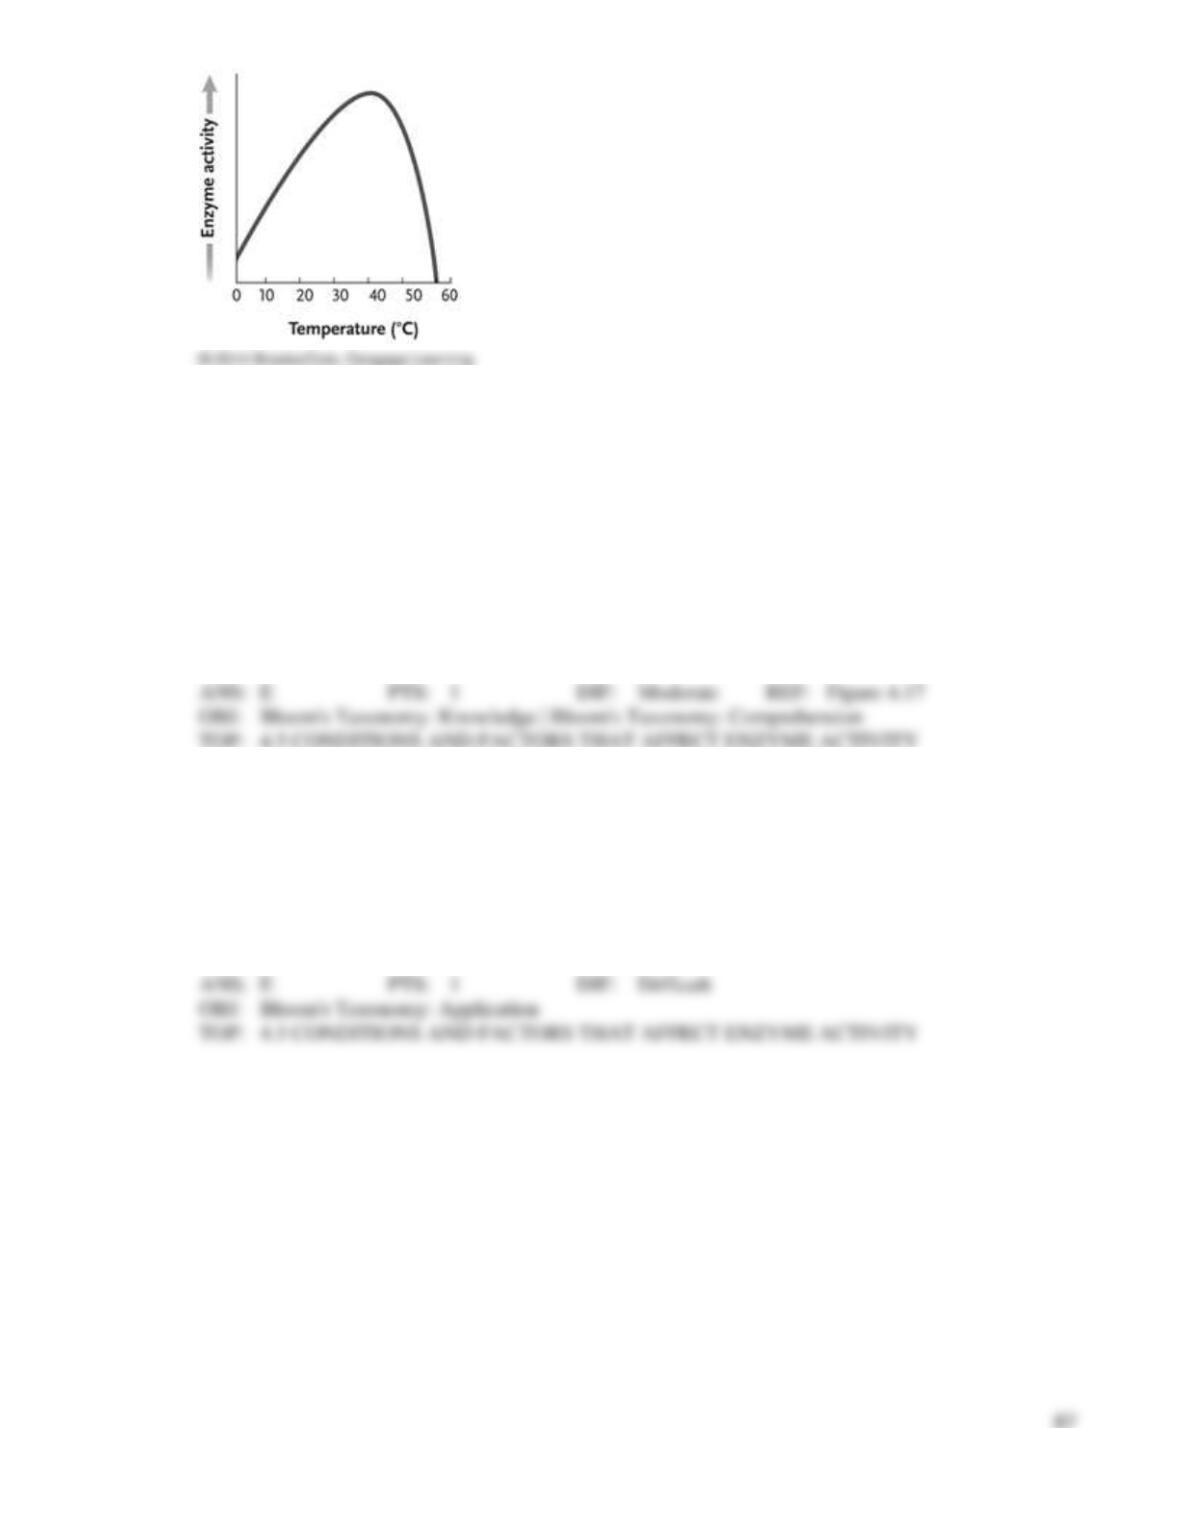
5 6 7 8 9
pH
40. This curve most likely represents a graph of enzyme activity
a.
as a function of temperature.
b.
as a function of pH in a strongly acidic environment.
c.
as a function of pH in a strongly basic environment.
d.
as a function of pH in a fairly neutral environment.
e.
as a function of temperature and pH combined.
41. You decide to alter the rate of a reaction. Which of the following is not going to help you increase the
rate of this reaction?
a.
adding more reactants
b.
adding more enzyme
c.
adding heat
d.
mechanically stirring the contents of a beaker of reactants
e.
adding more product
42. If an enzyme is saturated, this means that
a.
the enzymes cannot continue to catalyze the reaction.
b.
the reaction is at equilibrium.
c.
the rate of the reaction will slow and the reaction will stop.
d.
the enzymes need more reactants.
e.
the enzymes are catalyzing the reaction at the maximum rate.
43. You do an experiment in the laboratory and add increasing amounts of substrate to a solution
containing an enzyme and a pH buffer. You incubate the container at the optimal temperature for your
enzyme. Each time you add more substrate, you measure the rate of the reaction. If you graph the
results where the x-axis shows the substrate concentration and the y-axis shows the resulting reaction
rate, what will you find over time?
a.
The rate of the reaction will proceed with a slope of 1 and continue in a linear fashion
indefinitely or until you run out of reactants.
b.
The rate of the reaction will increase rapidly, taper off, and plateau.
c.
The rate of the reaction will increase slowly, plateau, and then drop sharply back to zero.
d.
The resulting graph will be a perfect bell curve.
e.
There is no way to predict what the graph will look like without more information.
44. In competitive inhibition
a.
the products of the reaction block the active site of the enzyme.
b.
the products of the reaction bind to a site other than the active site of the enzyme and
block enzyme activity indirectly.
c.
the substrate and cofactors compete for the active site.
d.
the inhibitor binds to and directly blocks the active site of the enzyme.
e.
the inhibitor binds to an enzyme at a site other than its active site.
45. The cofactors required for enzyme activity often are
a.
allosteric inhibitors.
b.
allosteric activators.
c.
charged amino acids.
d.
large, complex organic molecules.
e.
competitive inhibitors.
46. In noncompetitive feedback inhibition
a.
the products of the reaction block the active site of the enzyme.
b.
the products of the reaction at the end of the pathway bind to a site other than the active
site of an enzyme at or near the beginning of the pathway and block enzyme activity
indirectly.
c.
the substrate and cofactors compete for the active site.
d.
the inhibitor binds to and directly blocks the active site of the enzyme.
e.
enzyme activity is controlled by the reversible binding of a regulatory molecule.