Stewart_Calc_7ET ch04sec05
MULTIPLE CHOICE
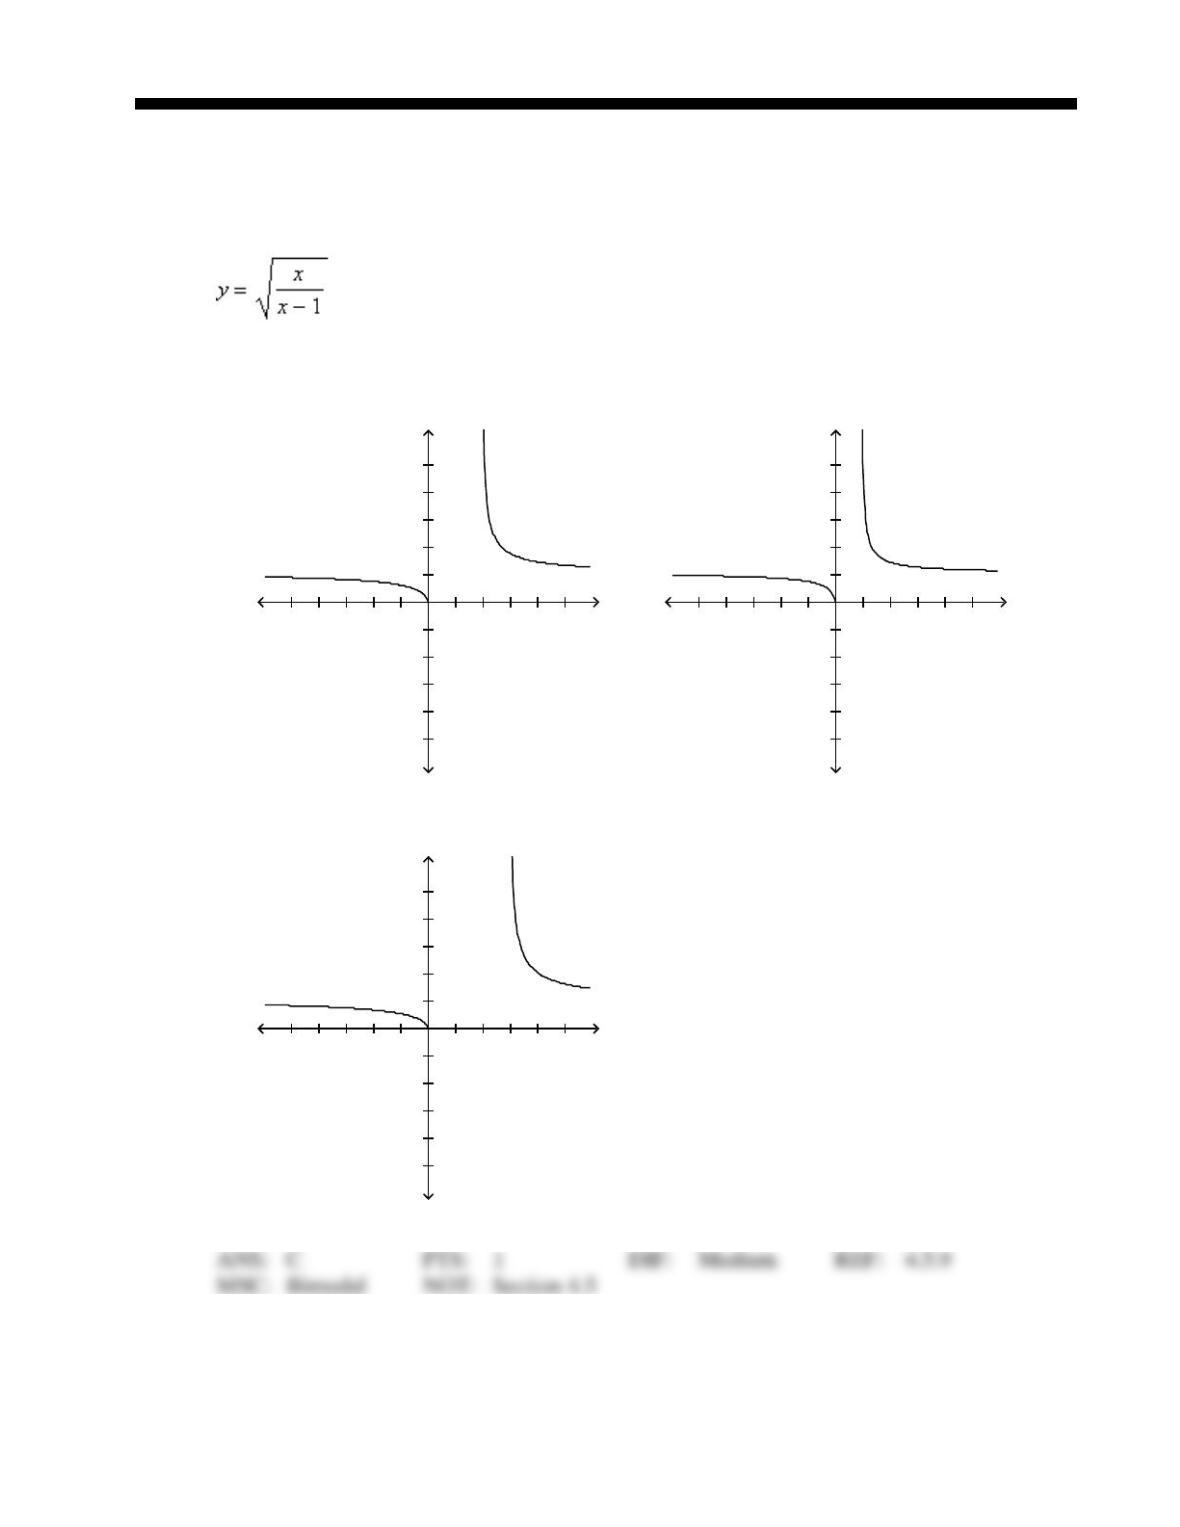
1. Sketch the curve.
a.
c.
b.
2. Sketch the curve.
1 2 3 4 5–1–2–3–4–5 x
1
2
3
4
5
–1
–2
–3
–4
–5
y
1 2 3 4 5–1–2–3–4–5 x
1
2
3
4
5
–1
–2
–3
–4
–5
y
1 2 3 4 5–1–2–3–4–5 x
1
2
3
4
5
–1
–2
–3
–4
–5
y
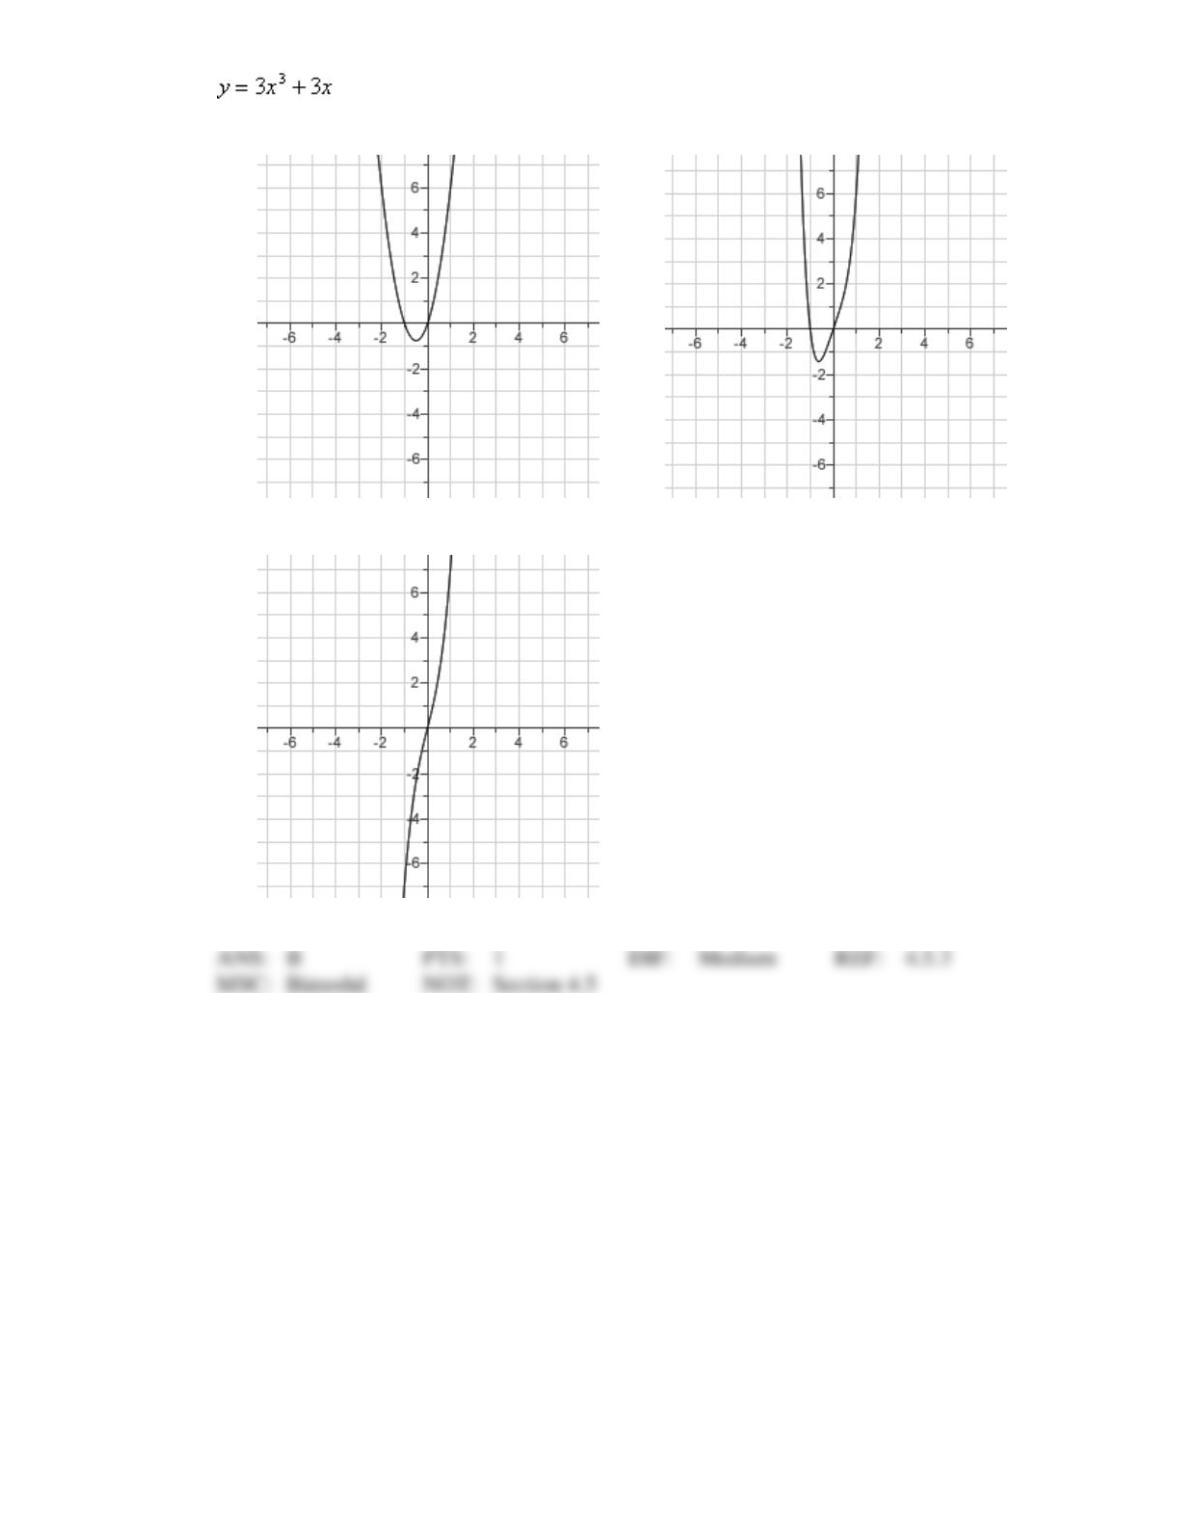
a.
c.
b.
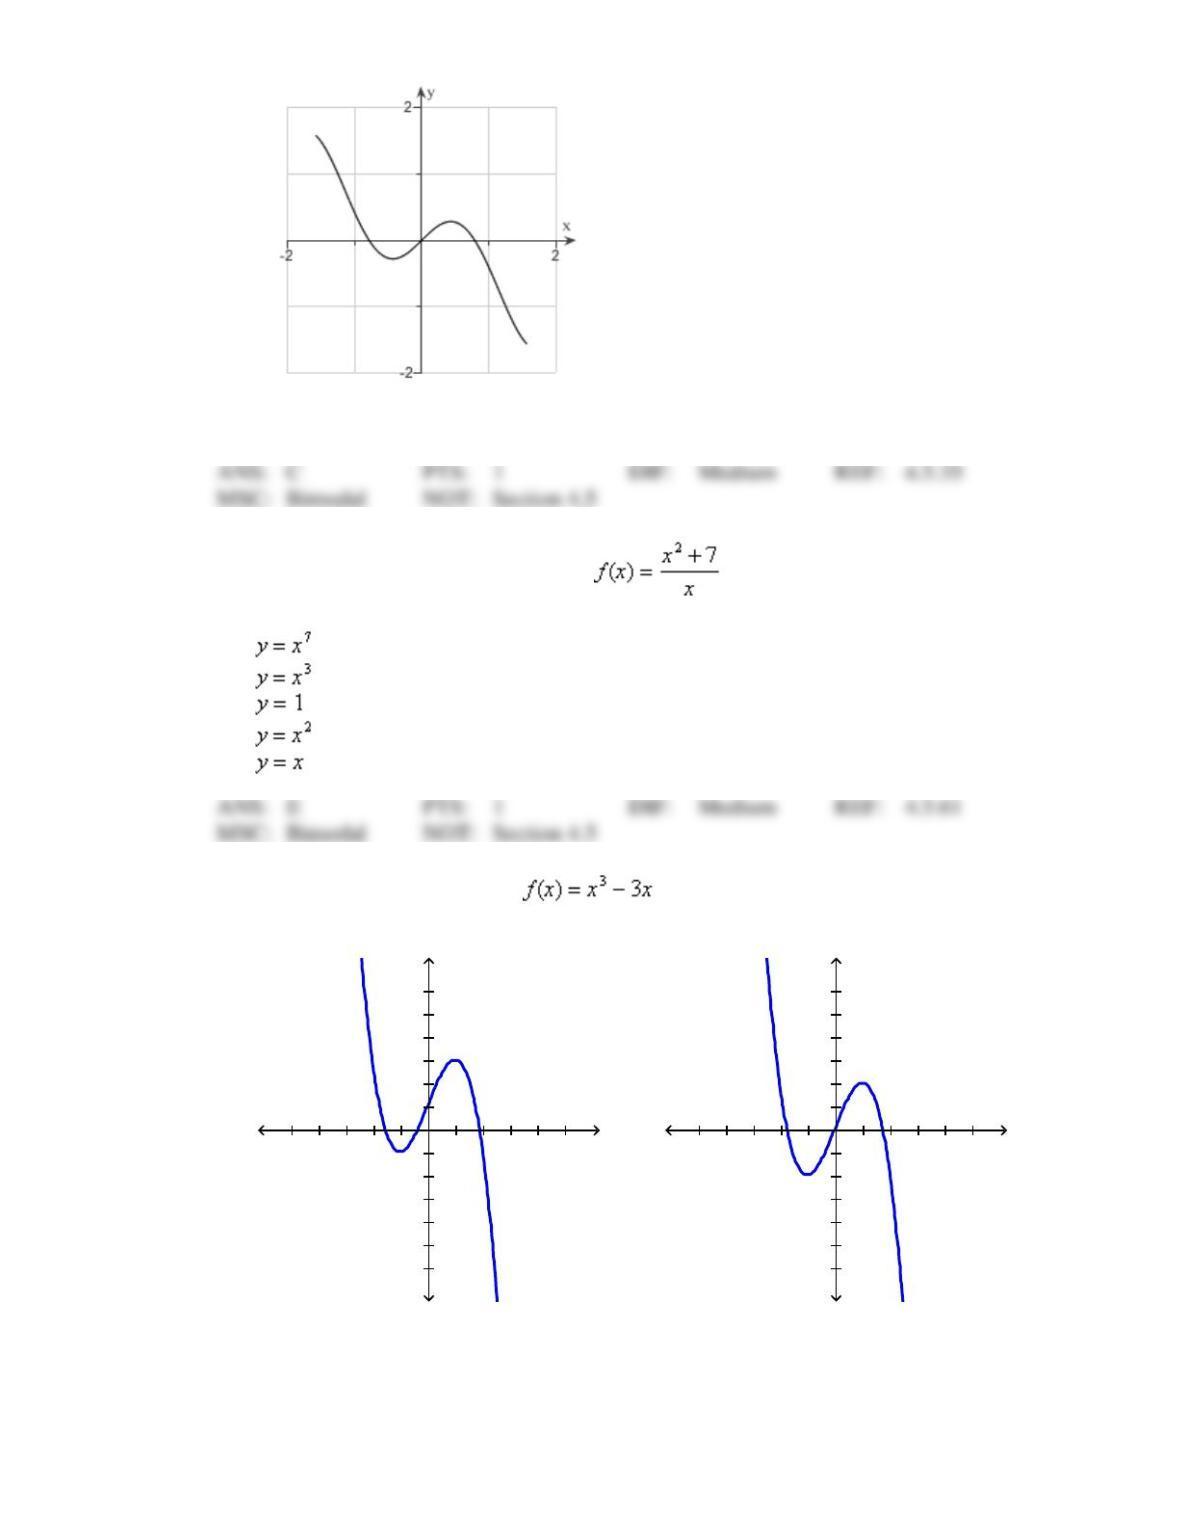
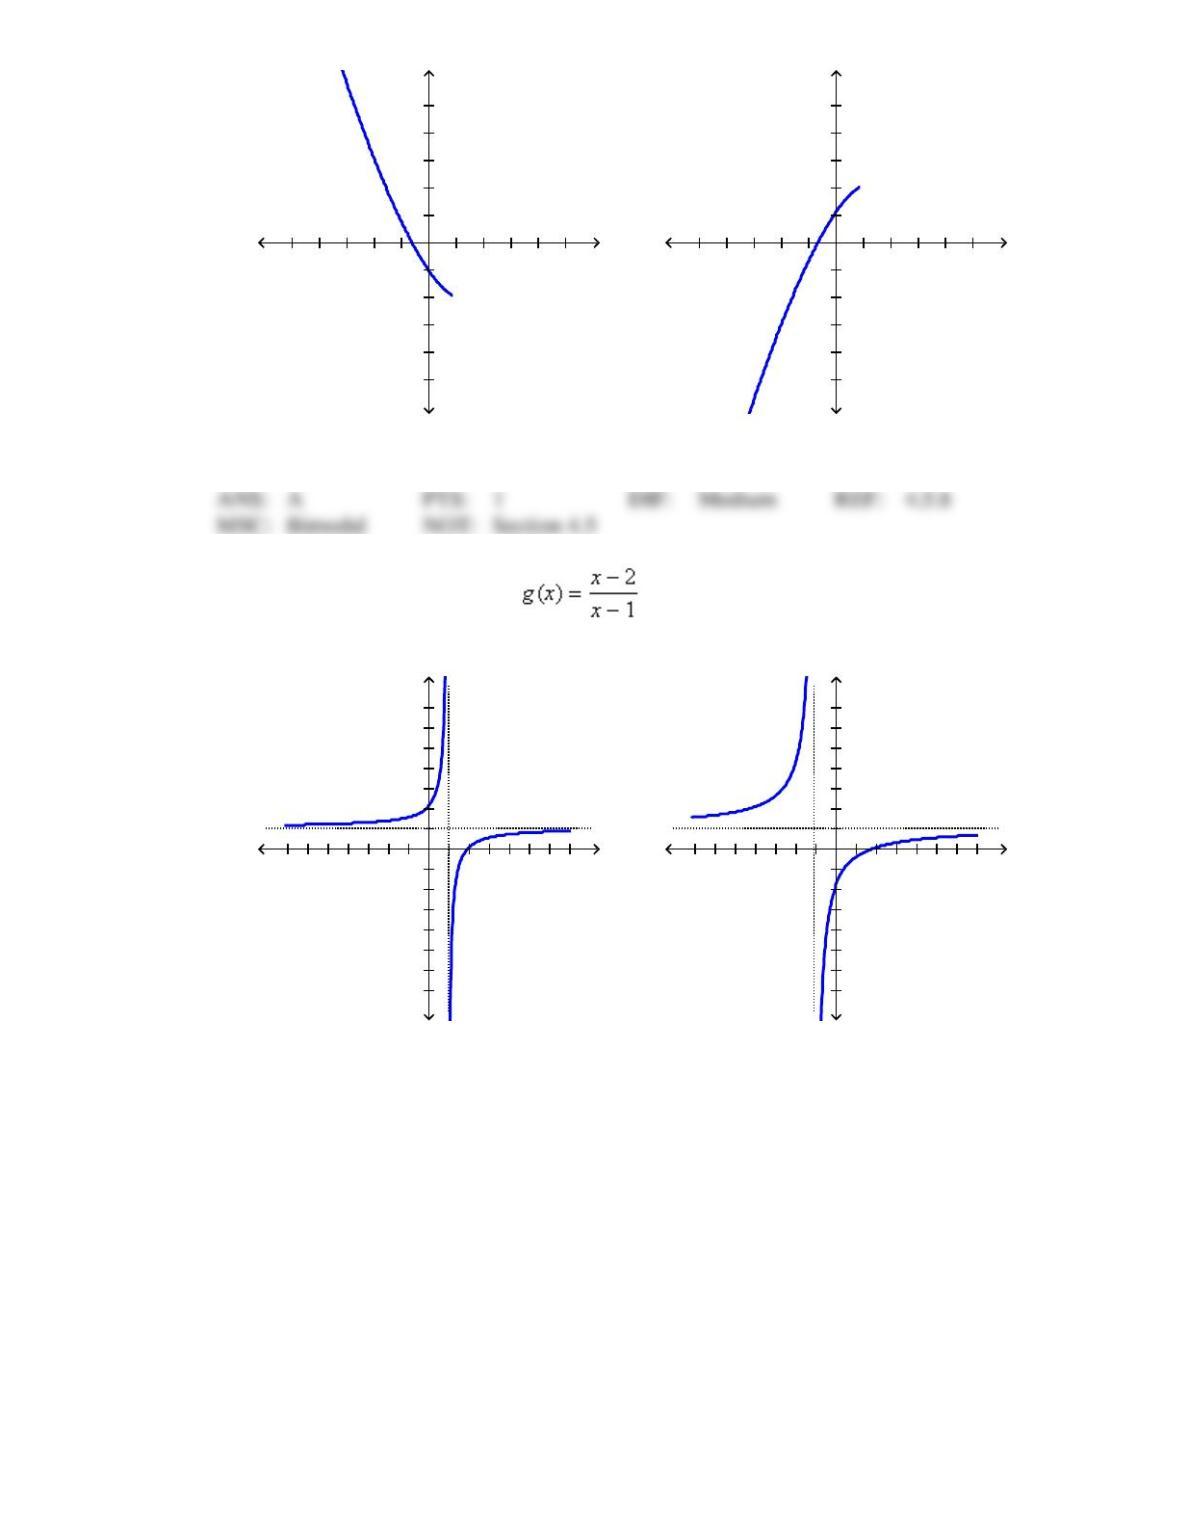
3. What is the function of the graph?
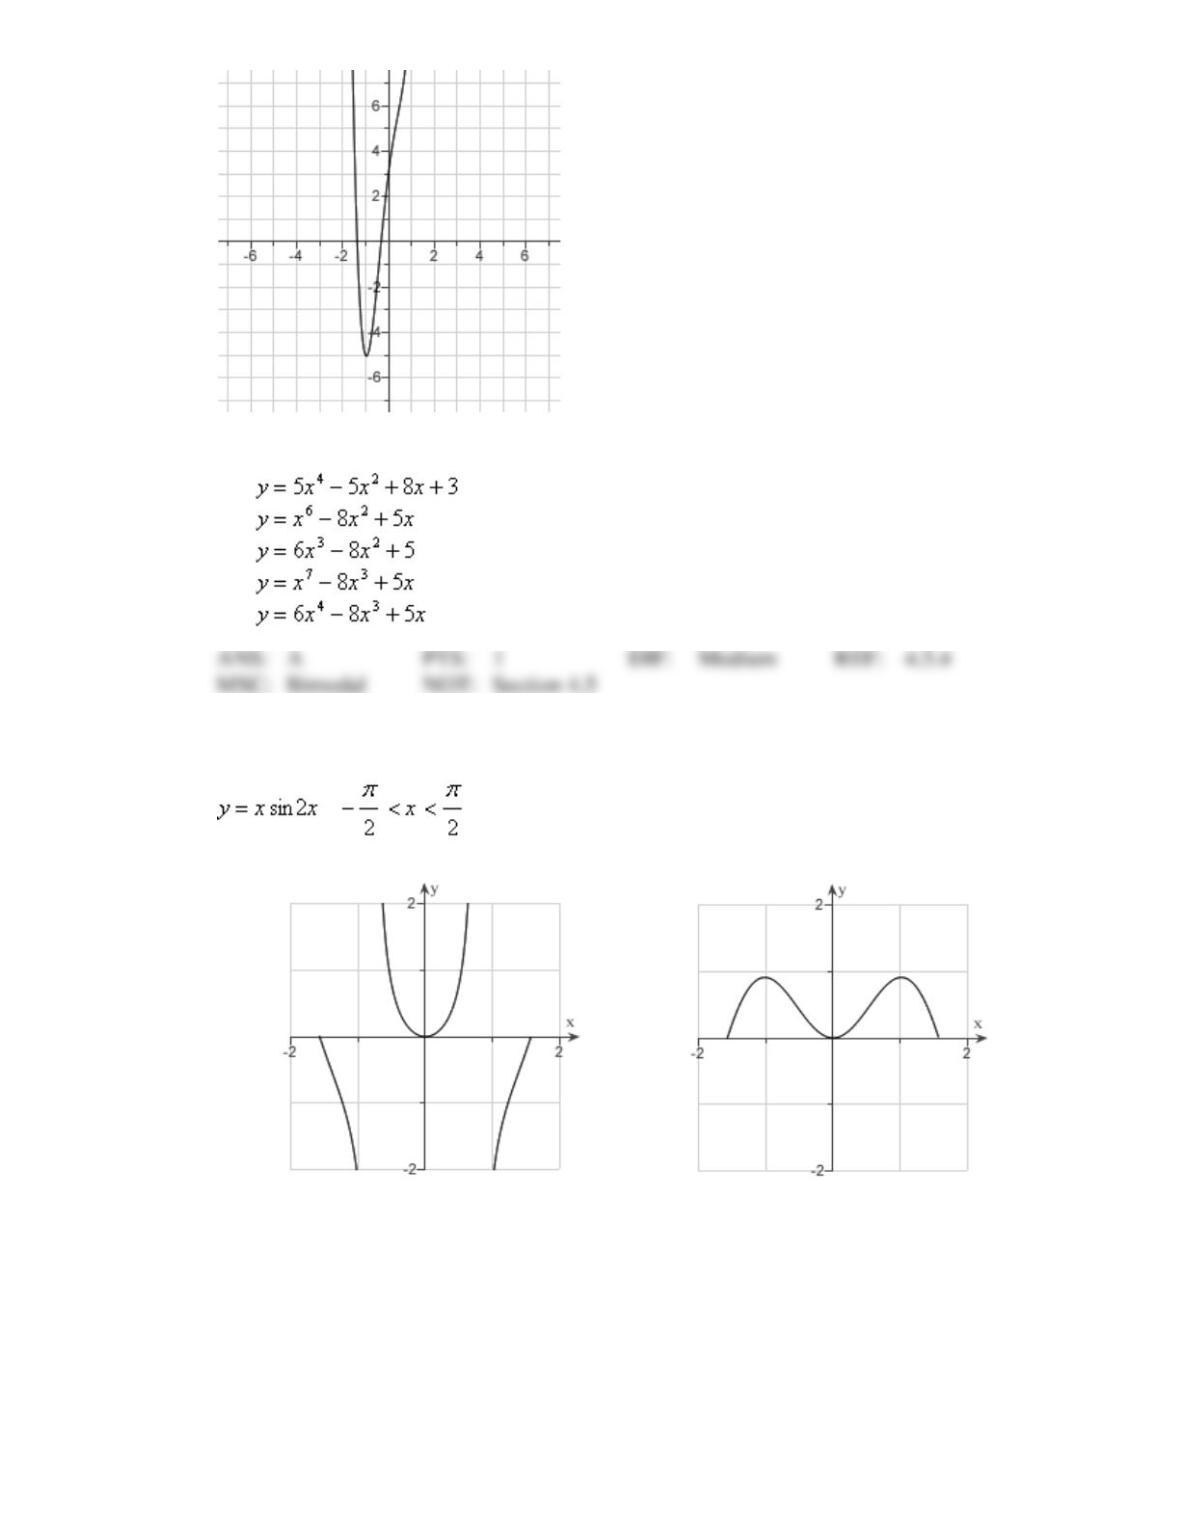
a.
b.
c.
d.
e.
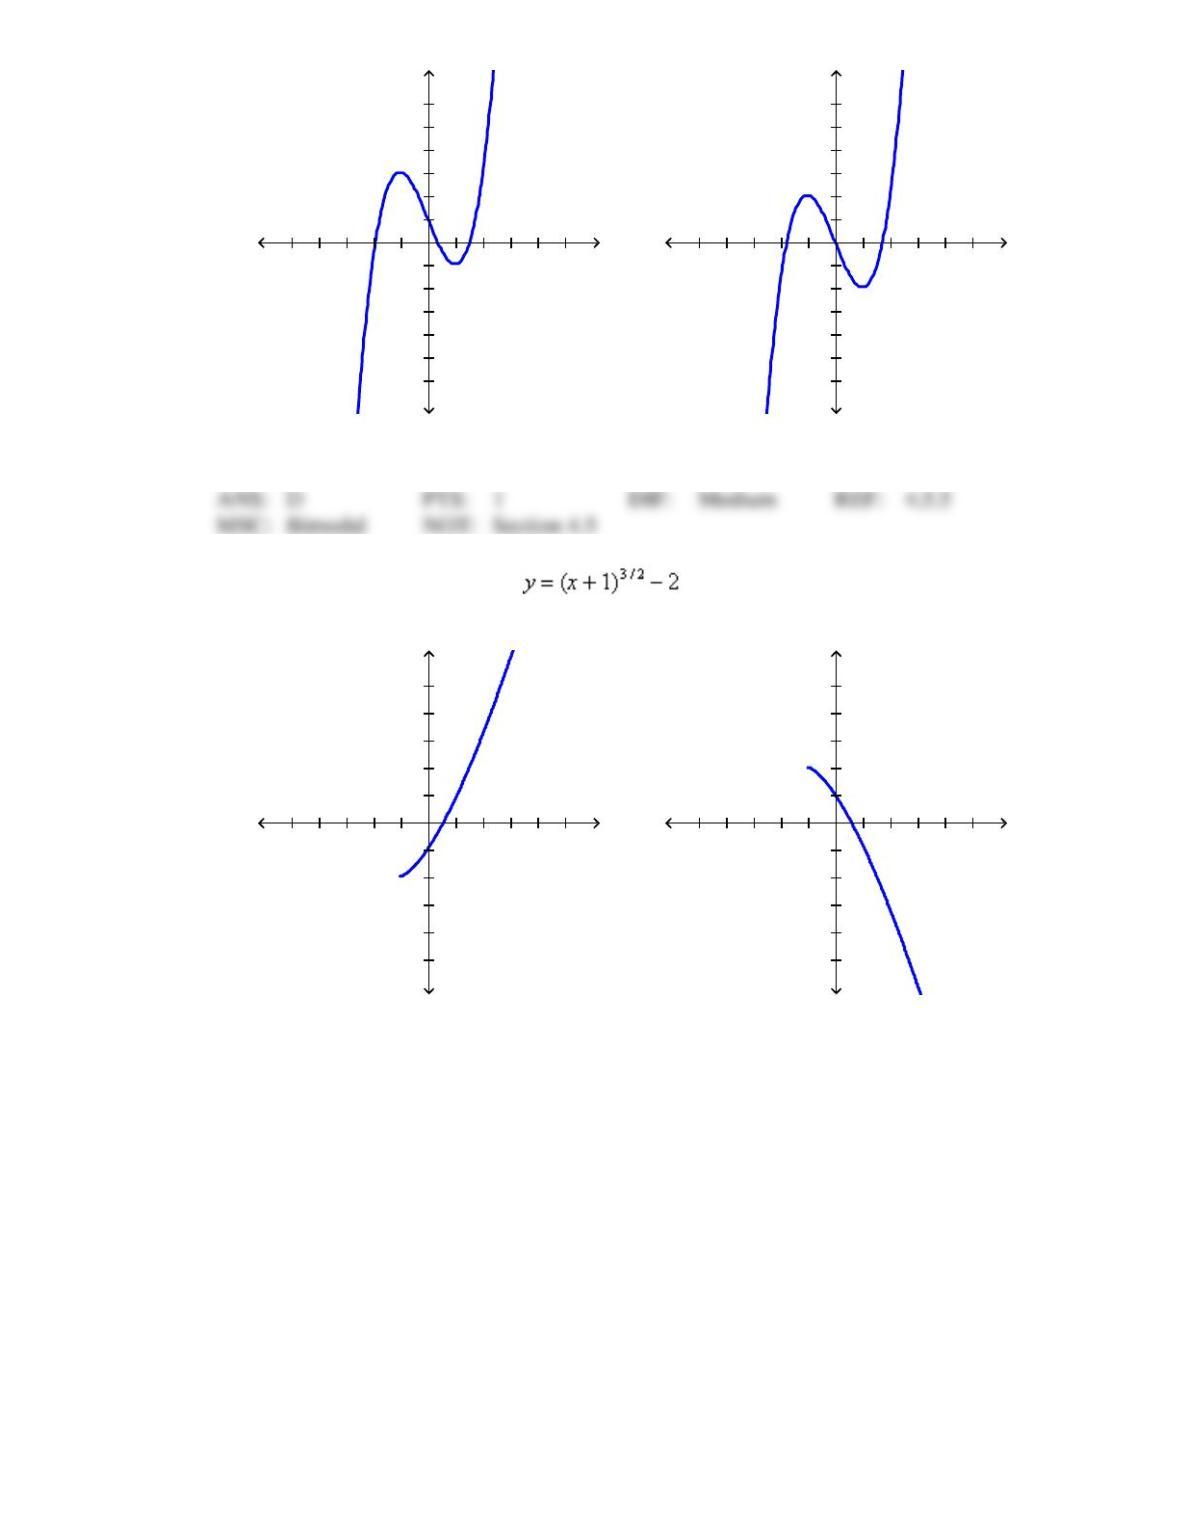
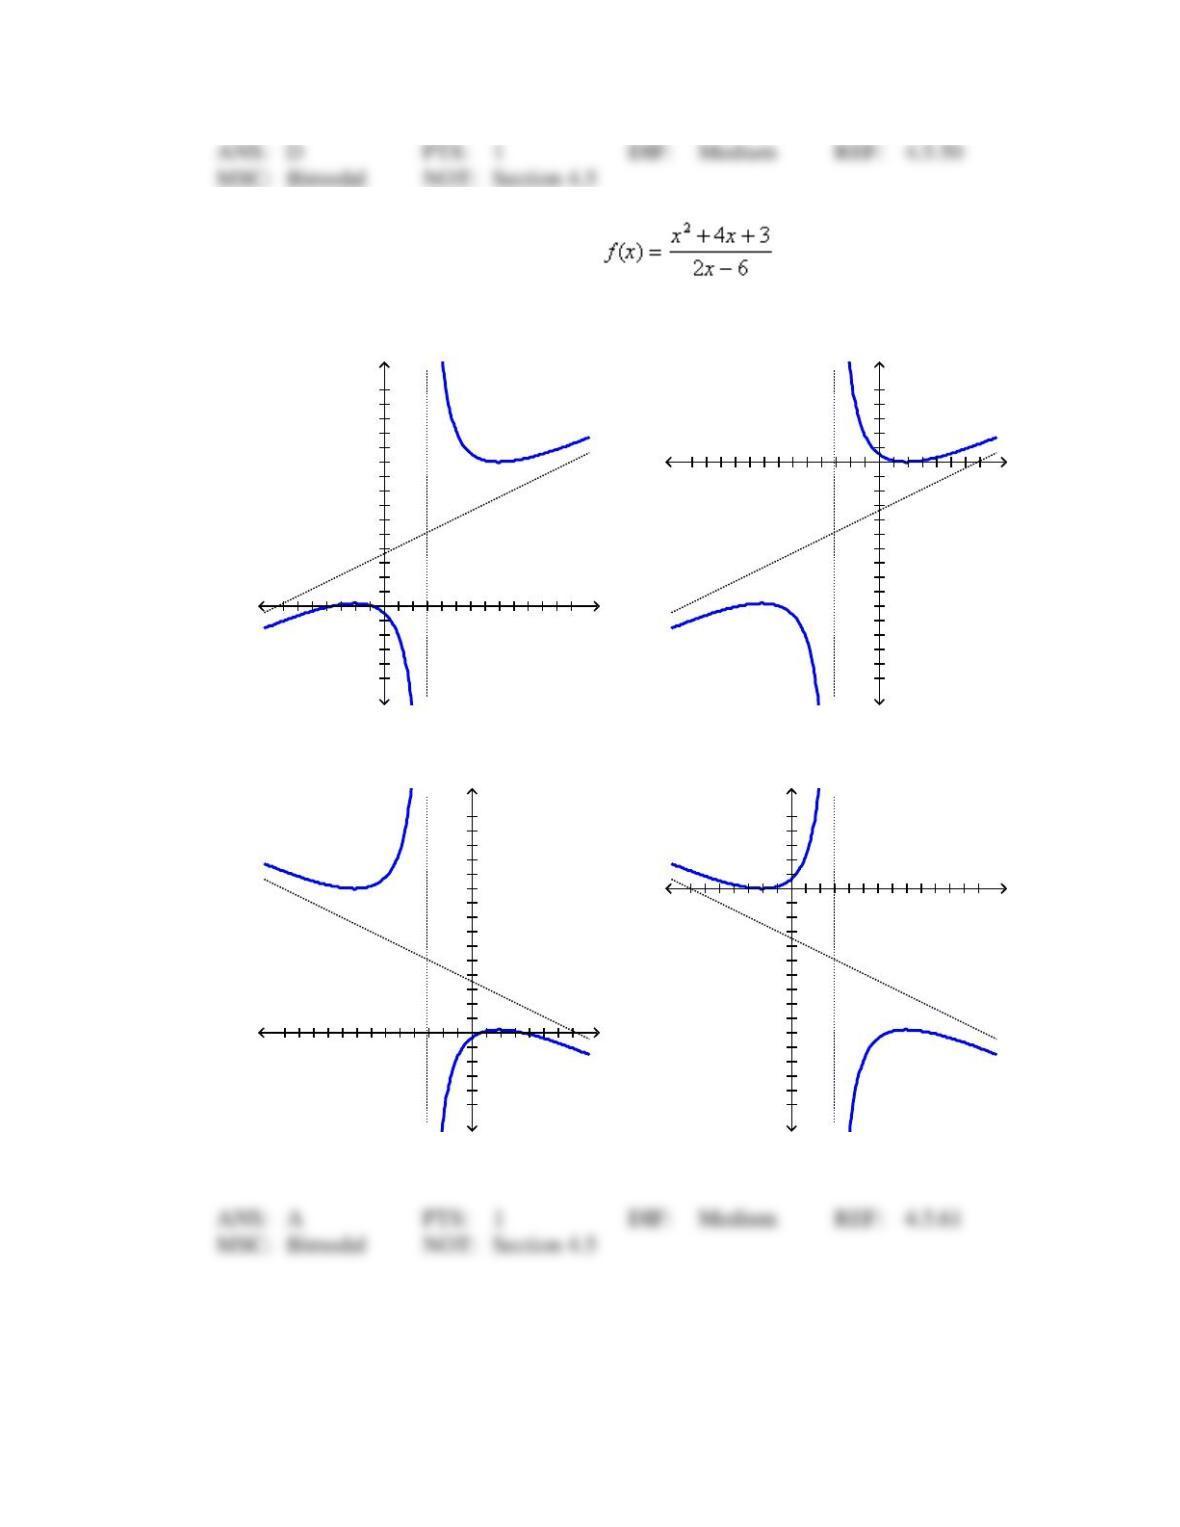
4. Sketch the curve.
,
a.
c.
b.
5. Find the slant asymptote of the function .
a.
b.
c.
d.
e.
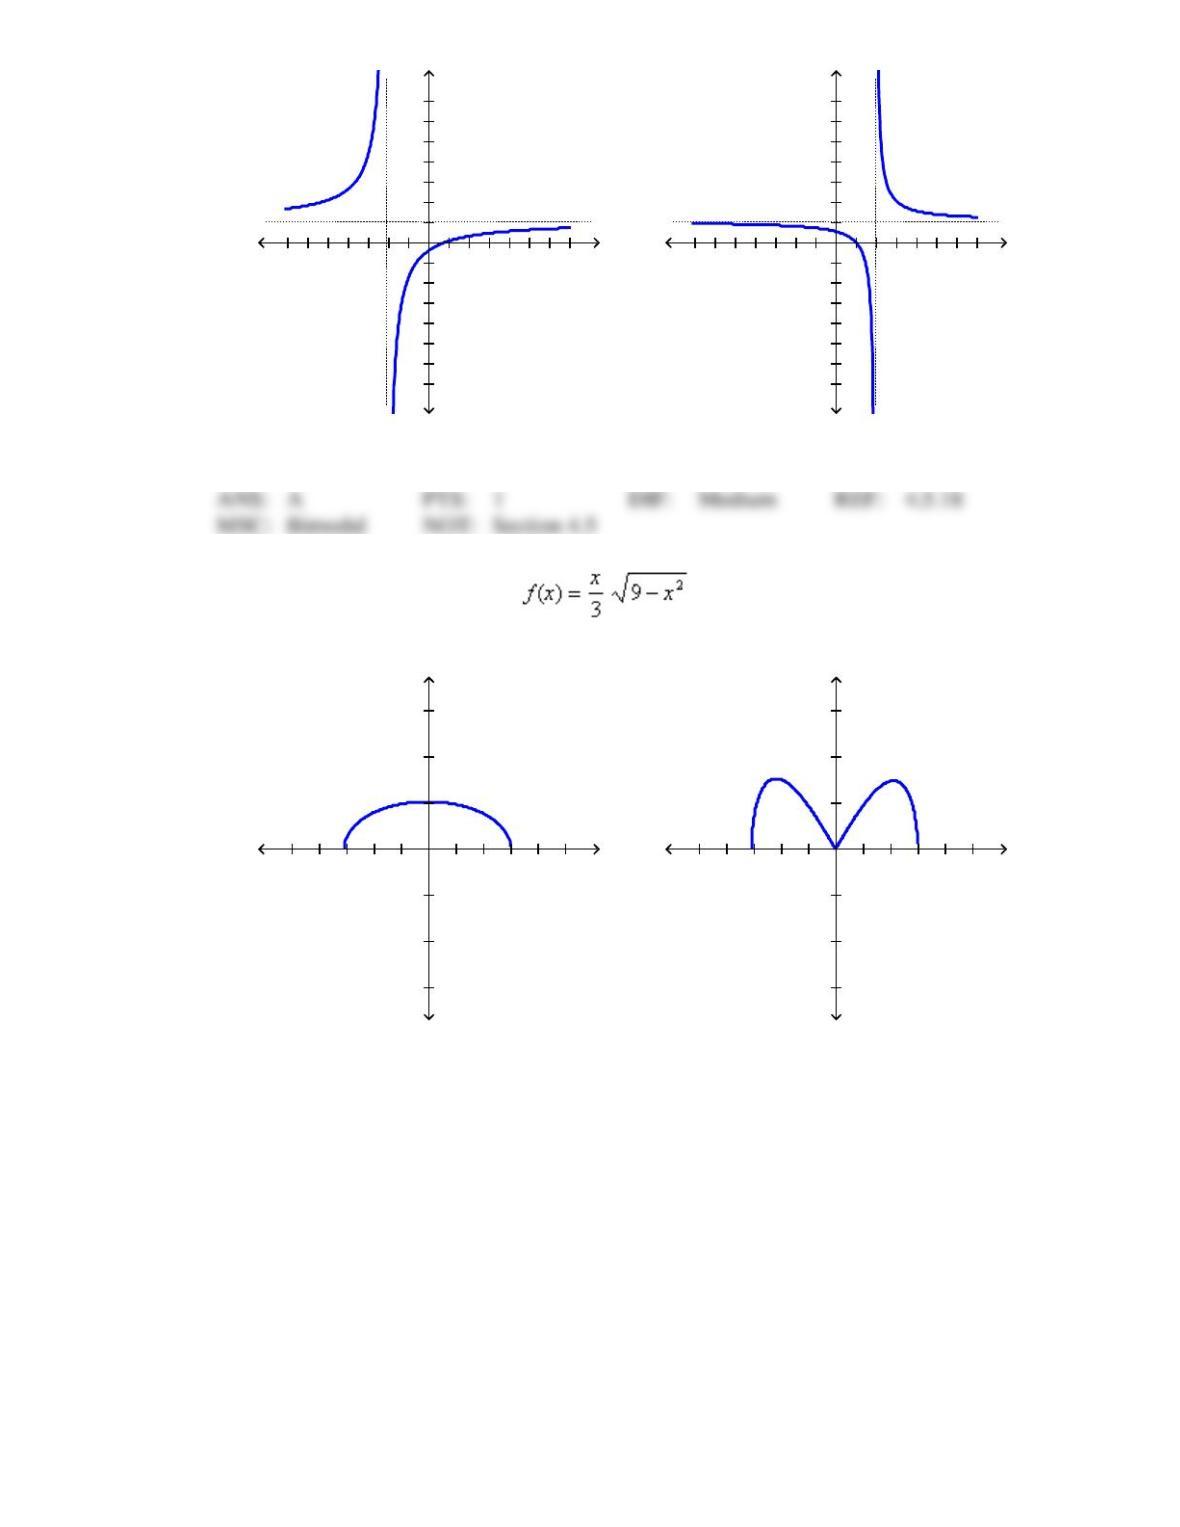
6. Sketch the graph of the function using the curve-sketching guidelines.
a.
c.
b.
d.
1 2 3 4 5–1–2–3–4–5 x
1
2
3
4
5
6
–1
–2
–3
–4
–5
–6
y
1 2 3 4 5–1–2–3–4–5 x
1
2
3
4
5
6
–1
–2
–3
–4
–5
–6
y
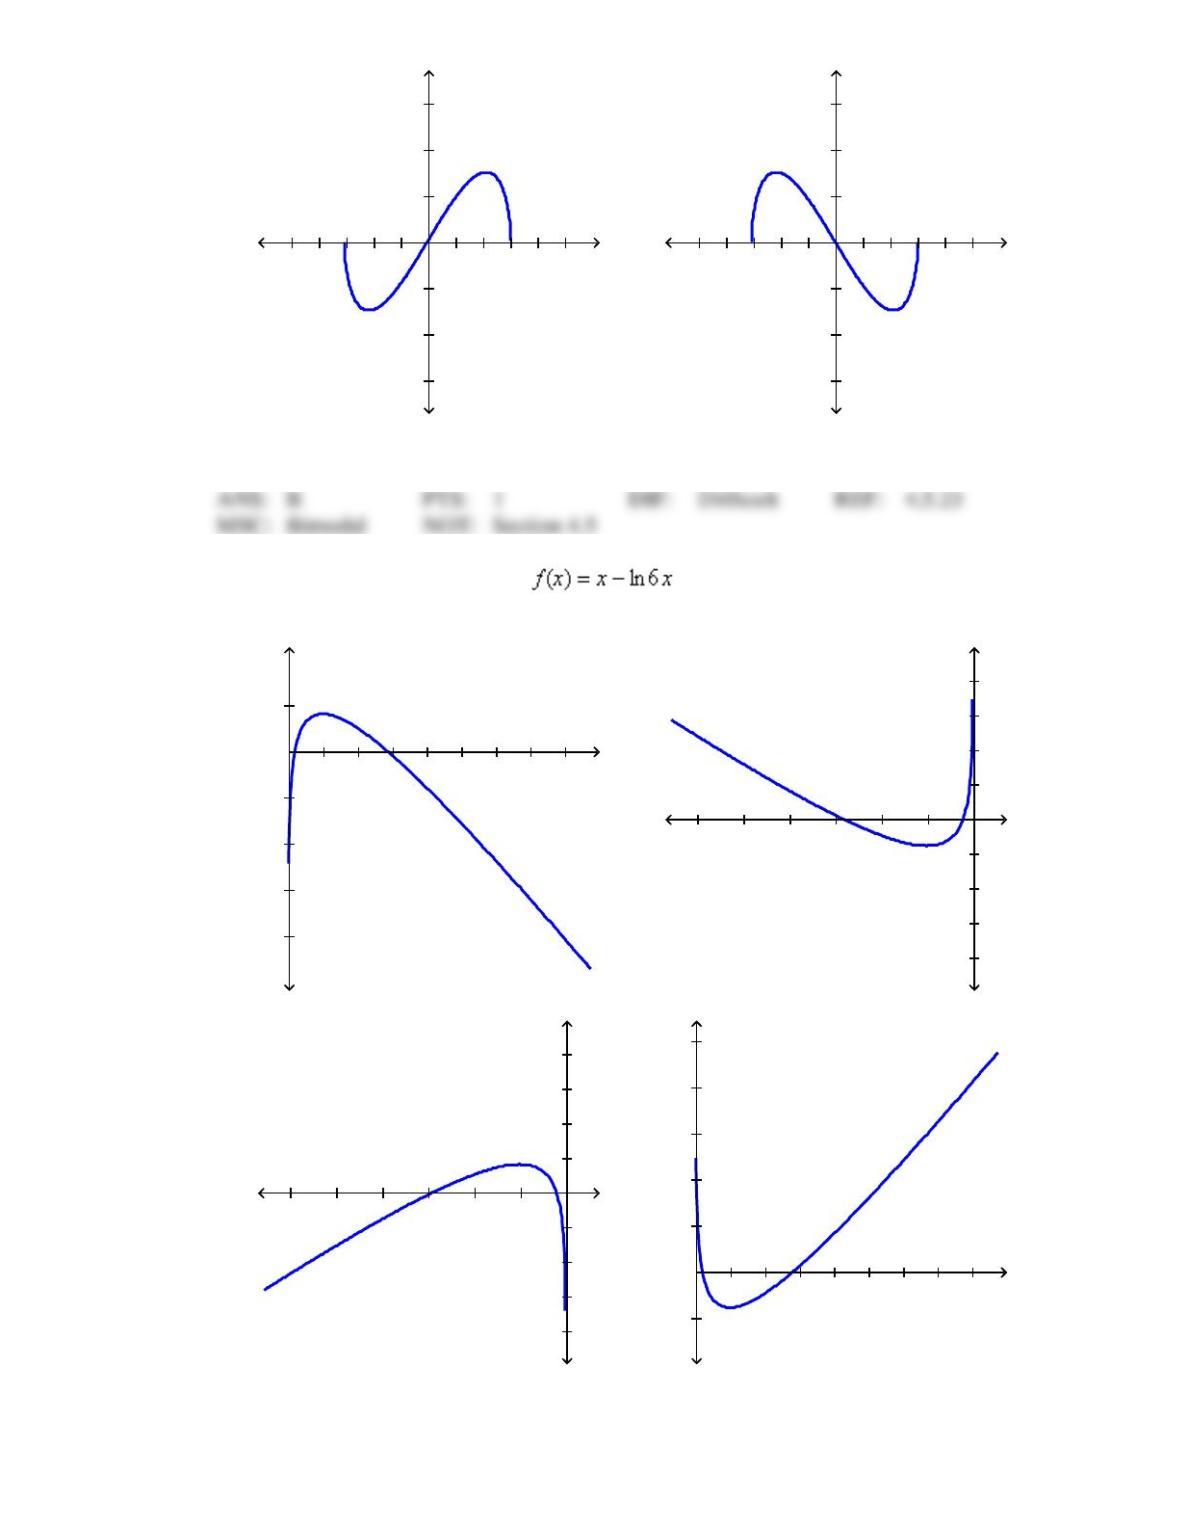
7. Sketch the graph of the function using the curve-sketching guidelines.
a.
c.
b.
d.
1 2 3 4 5–1–2–3–4–5 x
1
2
3
4
5
6
–1
–2
–3
–4
–5
–6
y
1 2 3 4 5–1–2–3–4–5 x
1
2
3
4
5
6
–1
–2
–3
–4
–5
–6
y
1 2 3 4 5–1–2–3–4–5 x
1
2
3
4
5
–1
–2
–3
–4
–5
y
1 2 3 4 5–1–2–3–4–5 x
1
2
3
4
5
–1
–2
–3
–4
–5
y
8. Sketch the graph of the function using the curve-sketching guidelines.
a.
c.
b.
d.
1 2 3 4 5–1–2–3–4–5 x
1
2
3
4
5
–1
–2
–3
–4
–5
y
1 2 3 4 5–1–2–3–4–5 x
1
2
3
4
5
–1
–2
–3
–4
–5
y
1 2 3 4 5 6 7–1–2–3–4–5–6–7 x
1
2
3
4
5
6
7
–1
–2
–3
–4
–5
–6
–7
y
1 2 3 4 5 6 7–1–2–3–4–5–6–7 x
1
2
3
4
5
6
7
–1
–2
–3
–4
–5
–6
–7
y
9. Sketch the graph of the function using the curve-sketching guidelines.
a.
c.
b.
d.
1 2 3 4 5 6 7–1–2–3–4–5–6–7 x
1
2
3
4
5
6
7
–1
–2
–3
–4
–5
–6
–7
y
1 2 3 4 5 6 7–1–2–3–4–5–6–7 x
1
2
3
4
5
6
7
–1
–2
–3
–4
–5
–6
–7
y
1 2 3 4 5–1–2–3–4–5 x
1
2
3
–1
–2
–3
y
1 2 3 4 5–1–2–3–4–5 x
1
2
3
–1
–2
–3
y
10. Sketch the graph of the function using the curve-sketching guidelines.
a.
c.
b.
d.
1 2 3 4 5–1–2–3–4–5 x
1
2
3
–1
–2
–3
y
1 2 3 4 5–1–2–3–4–5 x
1
2
3
–1
–2
–3
y
1 2 3 4 5 6 7 8 x
1
–1
–2
–3
–4
y
–1–2–3–4–5–6 x
1
2
3
4
–1
–2
–3
–4
y
–1–2–3–4–5–6 x
1
2
3
4
–1
–2
–3
–4
y
1 2 3 4 5 6 7 8 x
1
2
3
4
5
–1
y
11. Find the slant asymptote of the graph of using the curve-sketching
guidelines.
a.
c.
b.
d.
NUMERIC RESPONSE
1. Sketch the curve. Find the equation of the slant asymptote.
2 4 6 8 10 12–2–4–6 x
2
4
6
8
10
12
14
–2
–4
y
2 4 6–2–4–6–8–10–12 x
2
4
–2
–4
–6
–8
–10
–12
–14
y
2 4 6–2–4–6–8–10–12 x
2
4
6
8
10
12
14
–2
–4
y
2 4 6 8 10 12–2–4–6 x
2
4
–2
–4
–6
–8
–10
–12
–14
y
SHORT ANSWER
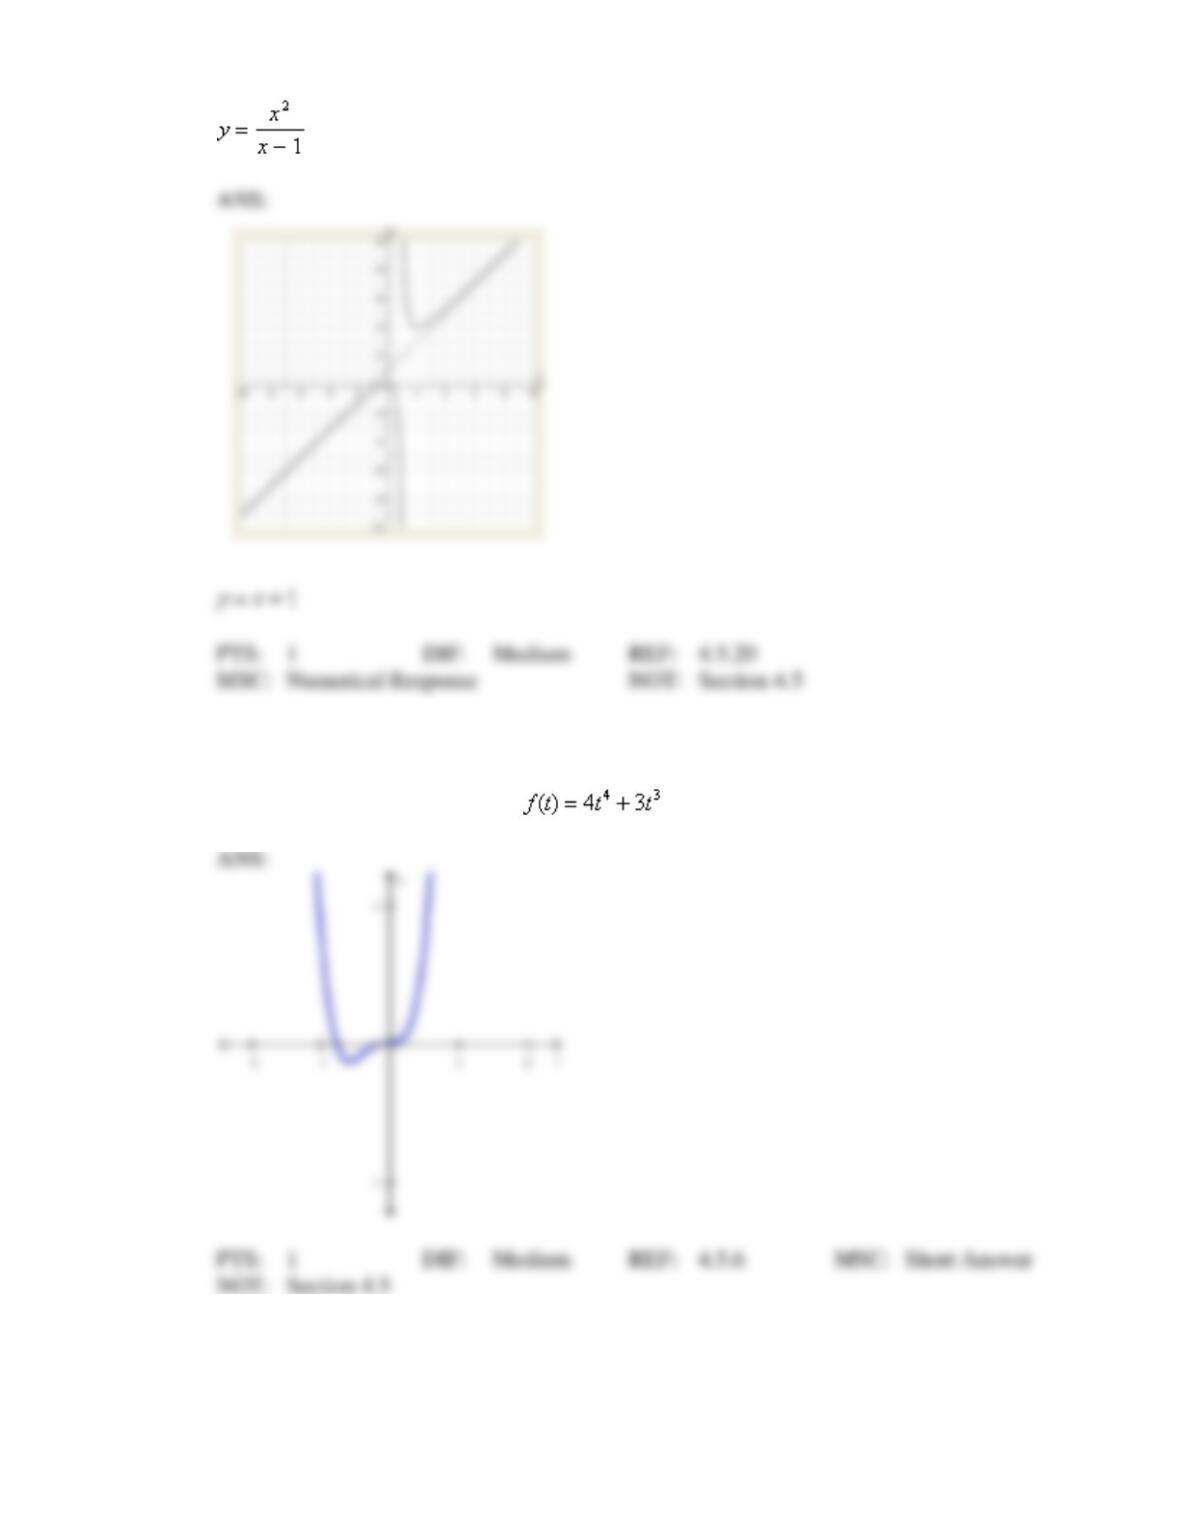
1. Sketch the graph of the function using the curve-sketching guidelines.
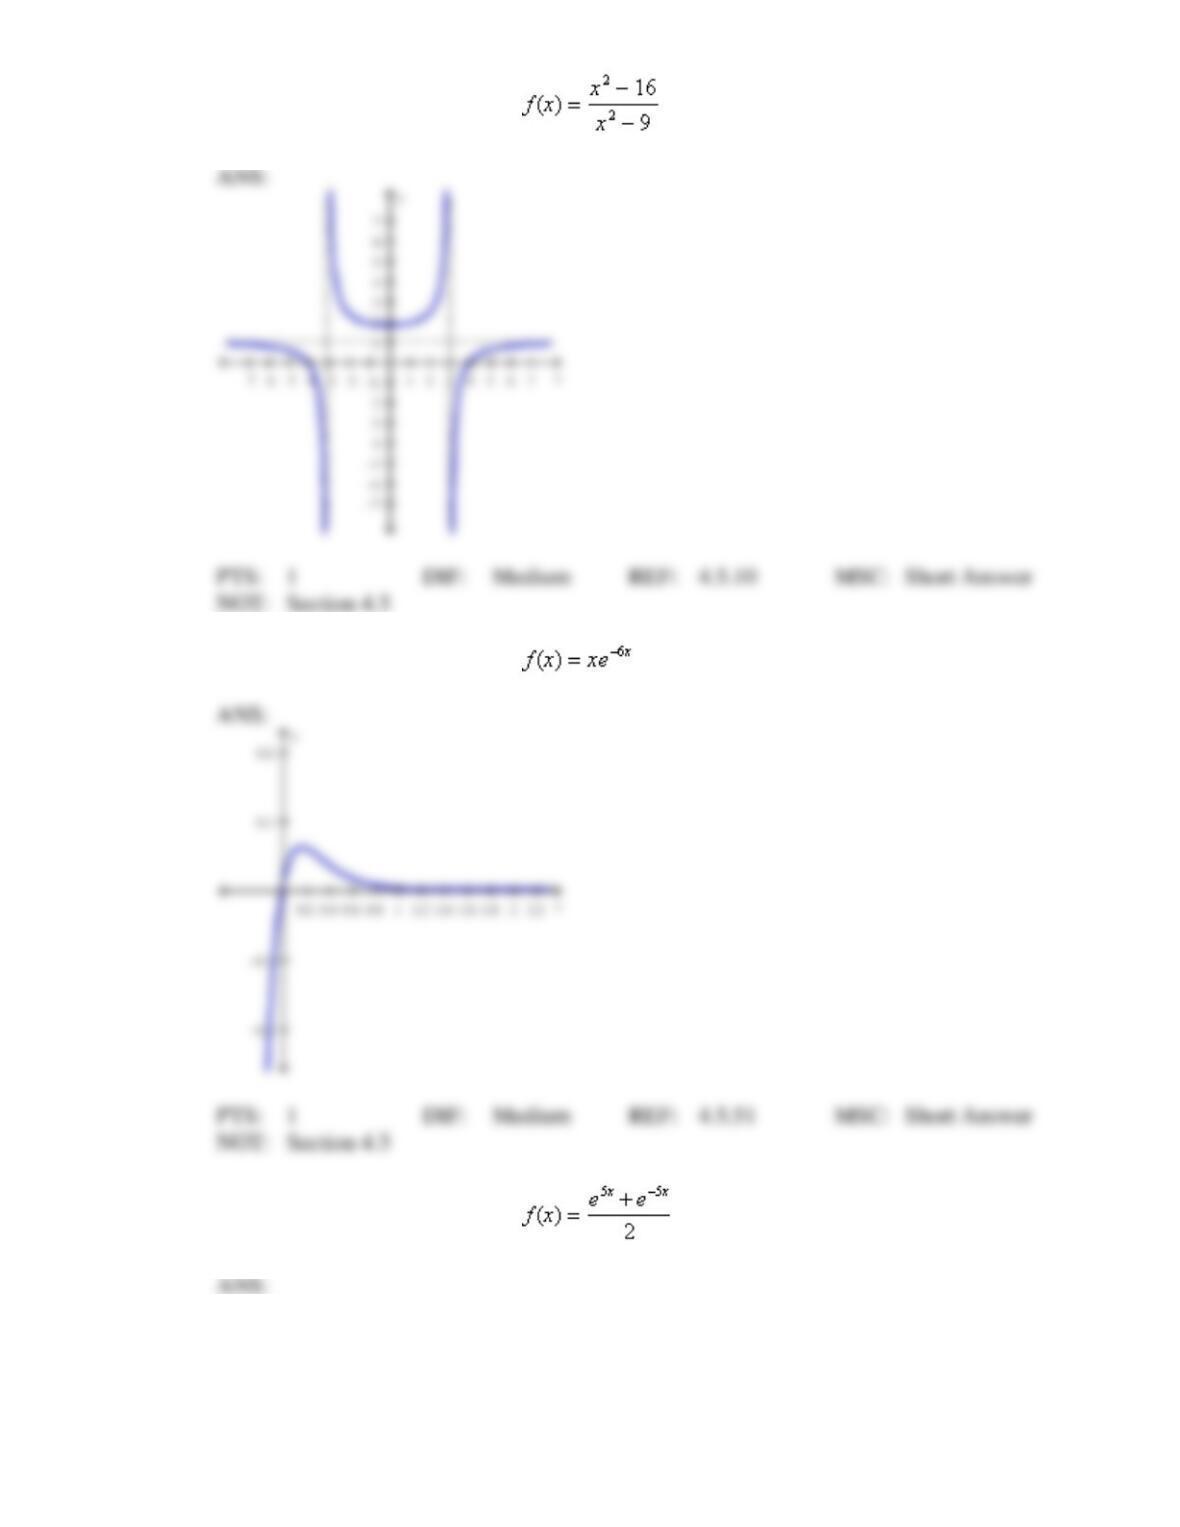
2. Sketch the graph of the function using the curve-sketching guidelines.
3. Sketch the graph of the function using the curve-sketching guidelines.
4. Sketch the graph of the function using the curve-sketching guidelines.
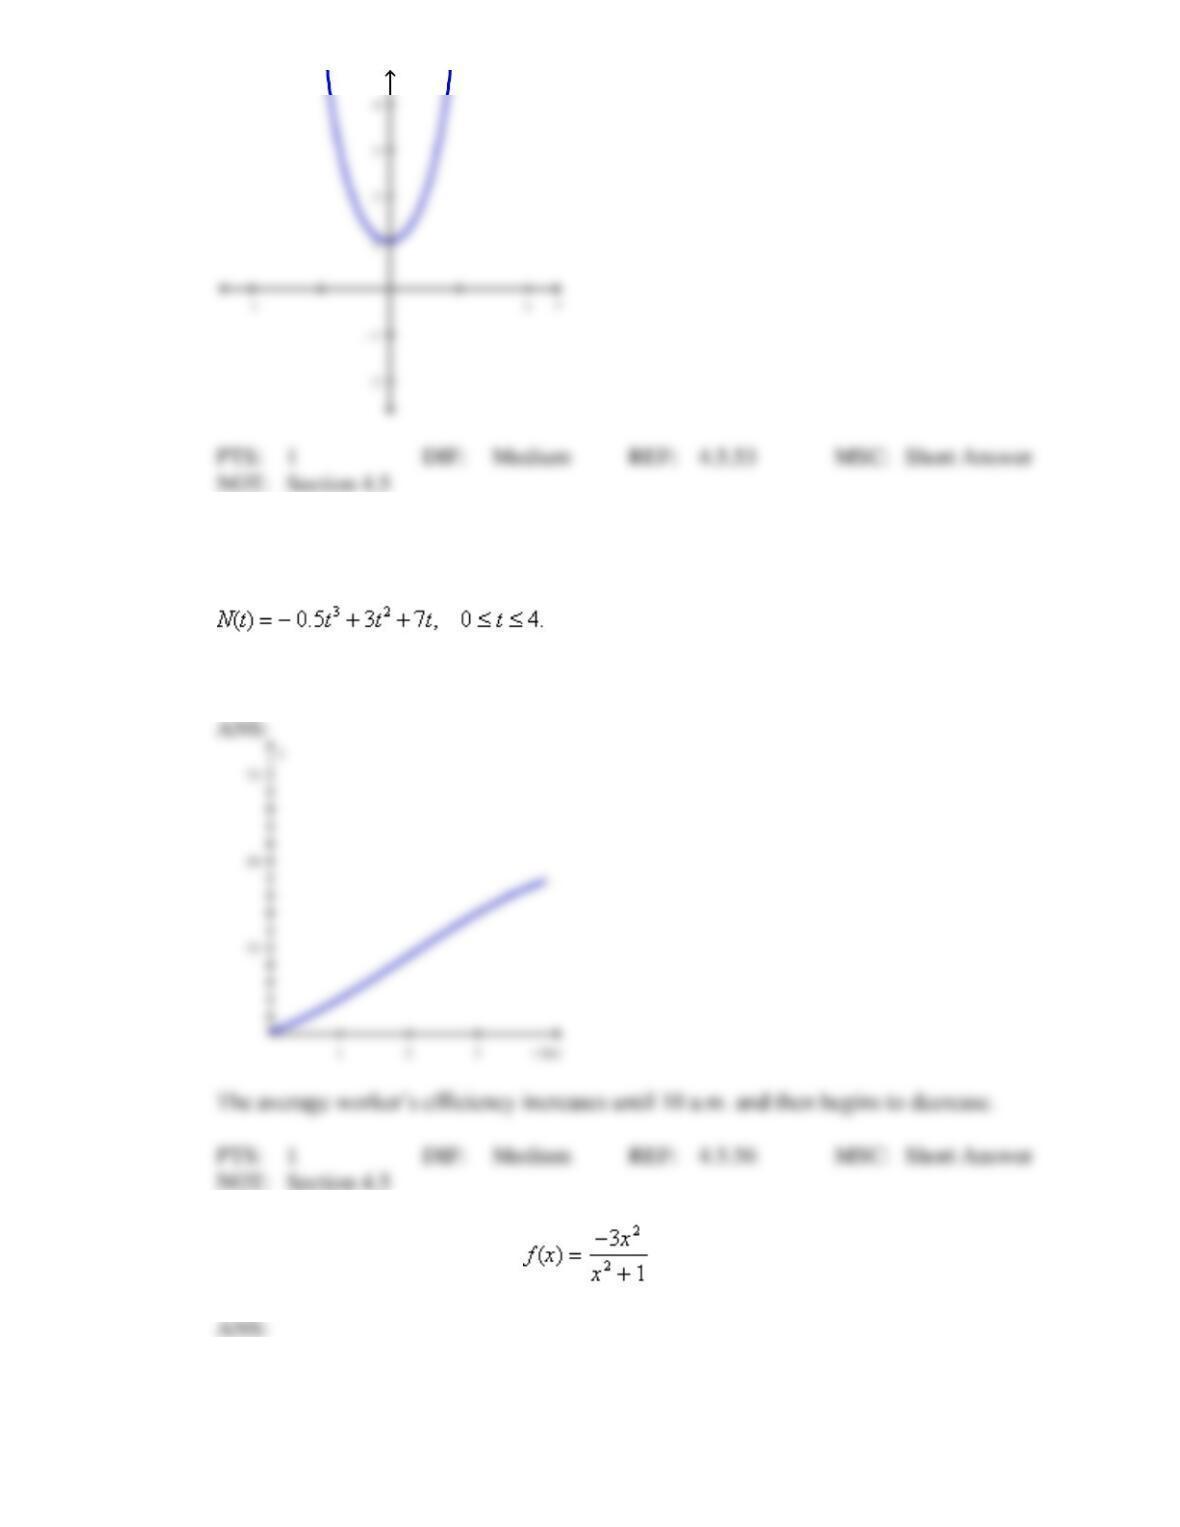
5. An efficiency study showed that the total number of cell phones assembled by the average
worker at a manufacturing company t hours after starting work at 8 a.m. is given by
Sketch the graph of the function N, and interpret your result.
6. Sketch the graph of the function using the curve-sketching guidelines.
y
y