Chapter 4
Chapter Focus
This chapter deals with reliability and validity of test instruments. It explains various methods of
researching reliability and validity and recommends methods appropriate to specific types of
tests.
Check Your Understanding
Activity 4.1
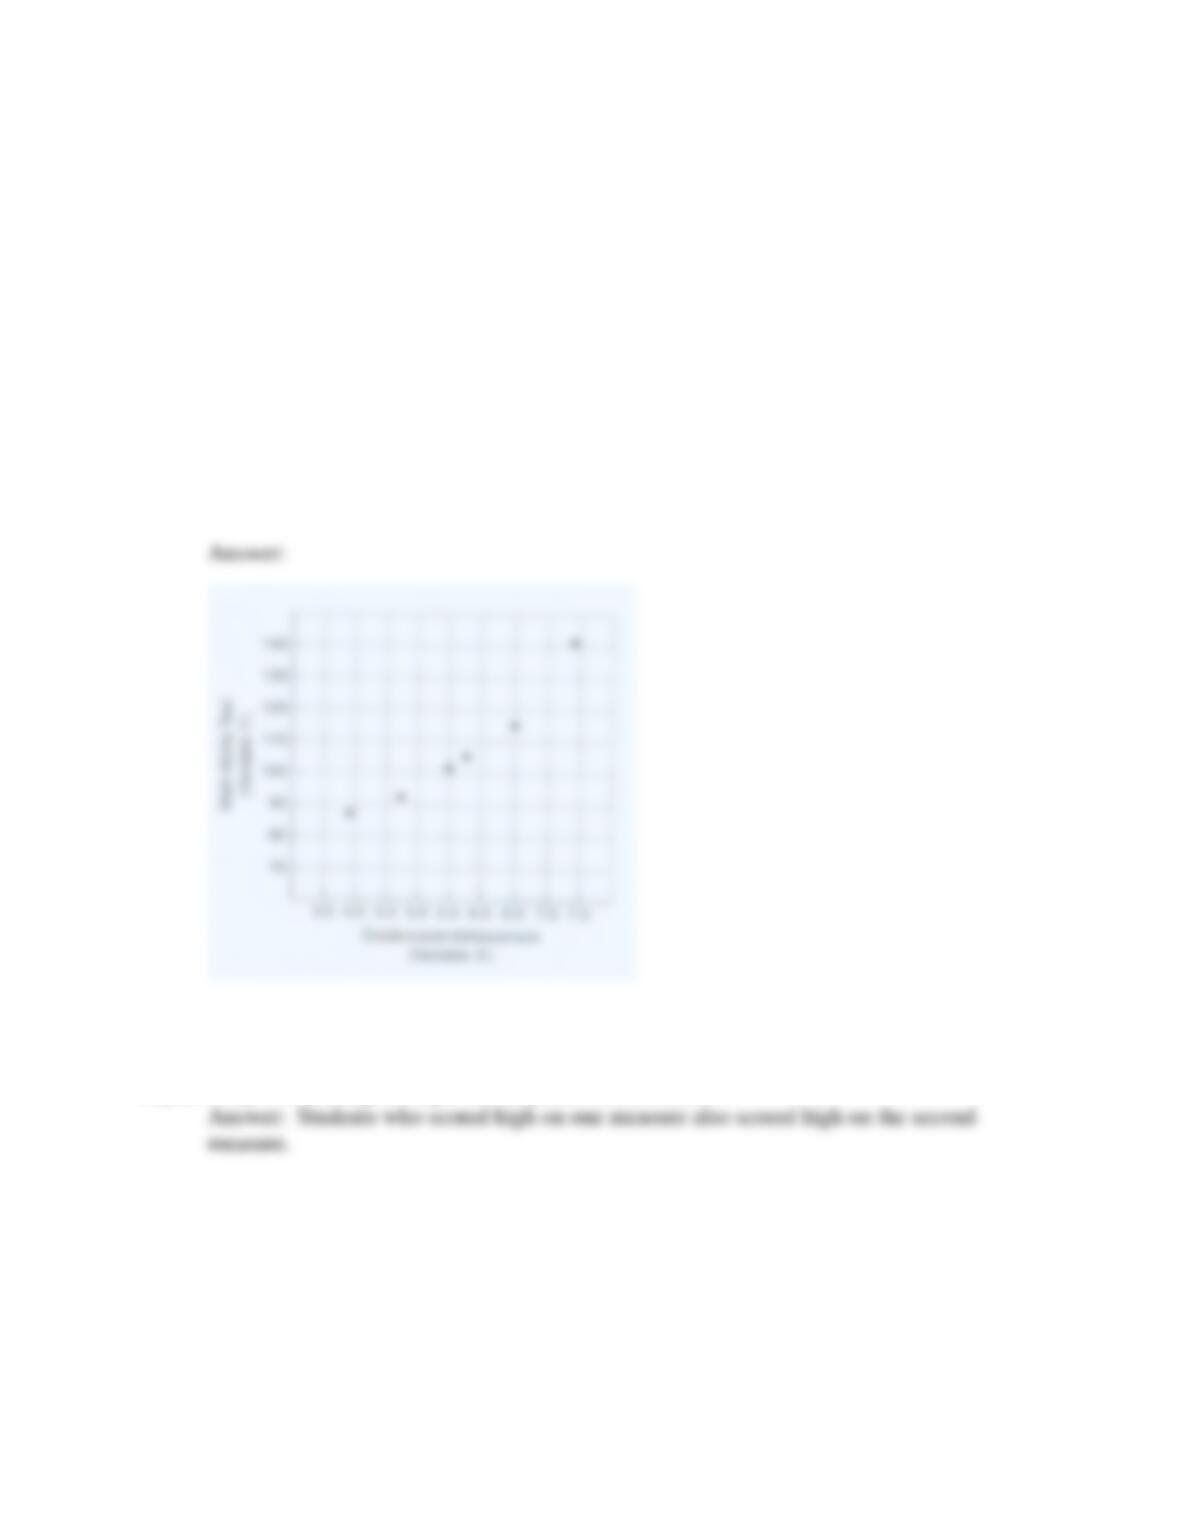
1. The following sets of data are scores on a mathematics ability test and grade level
achievement in math for fifth graders. Plot the scores on the scattergram.
Apply Your Knowledge
Explain why this scattergram represents a positive correlation.
Activity 4.2
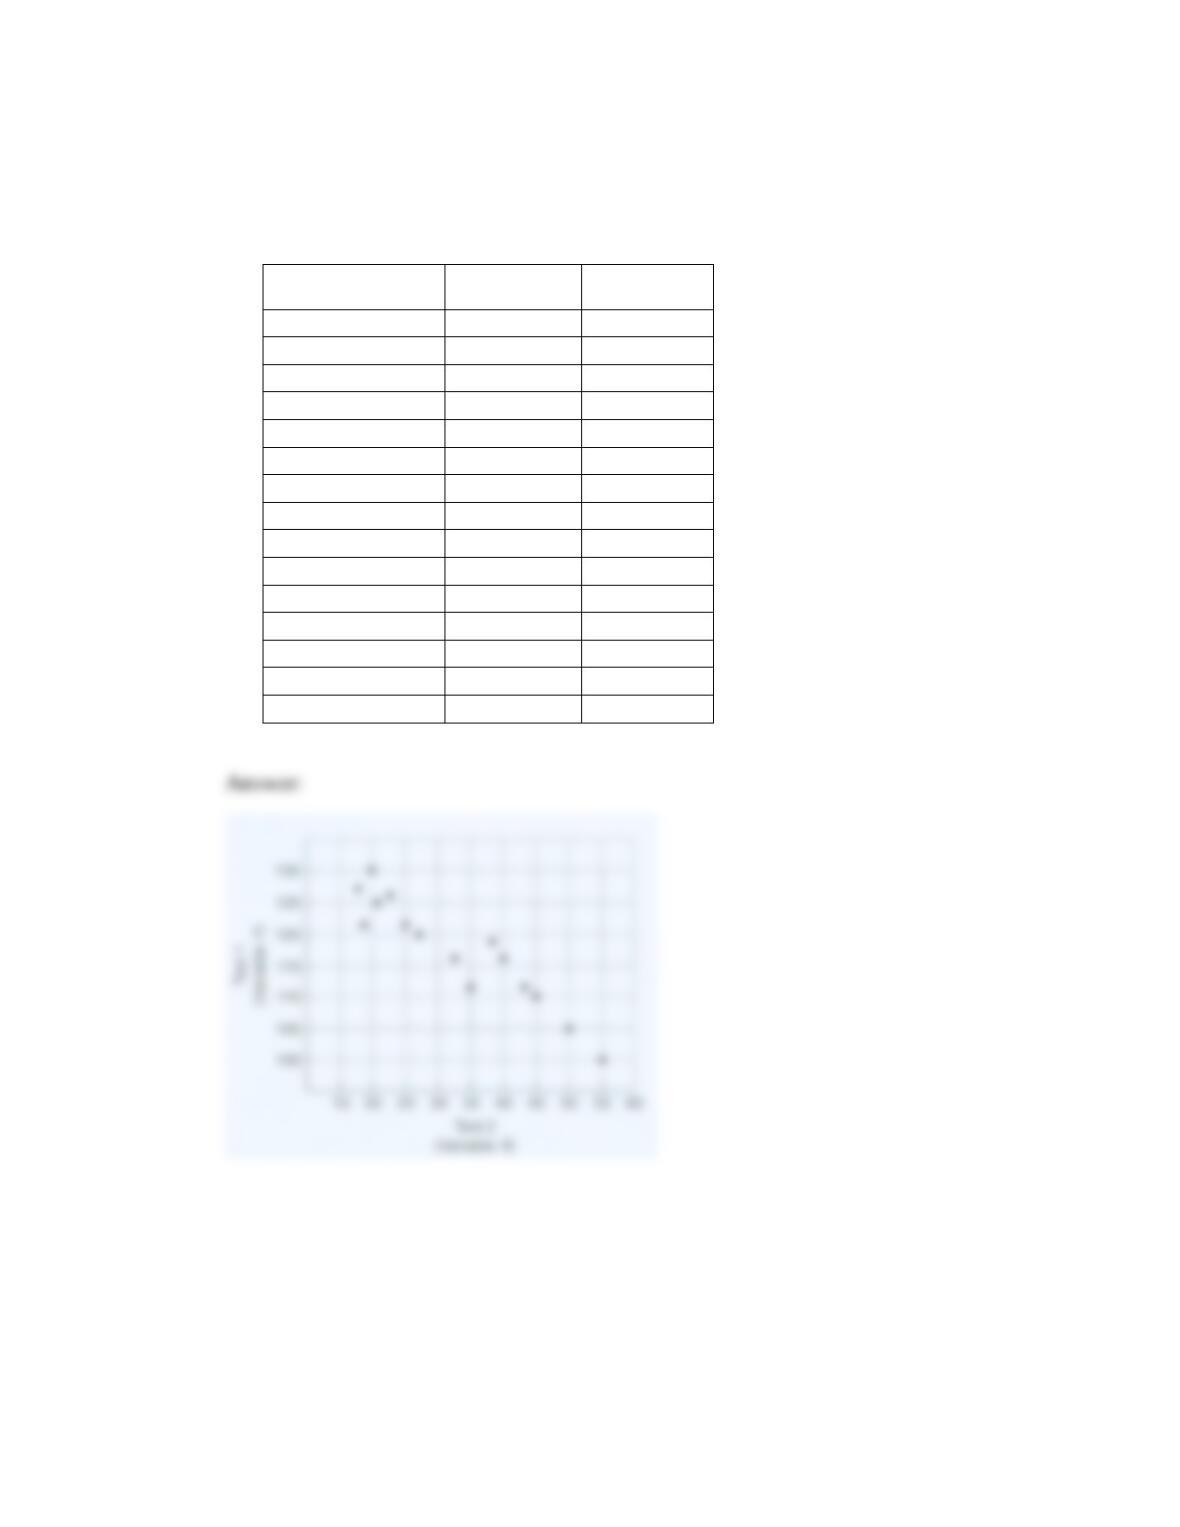
1. Here is an example of a negative correlation between two variables. Plot the scores on
the scattergram.
Test 1
(Variable Y)
Test 2
(Variable X)
Heather
116
40
Ryan
118
38
Brent
130
20
William
125
21
Kellie
112
35
Stacy
122
19
Myoshi
126
23
Lawrence
110
45
Allen
127
18
Alejandro
100
55
Jeff
120
27
Jawan
122
25
Michael
112
43
James
105
50
Thomas
117
33
Activity 4.3
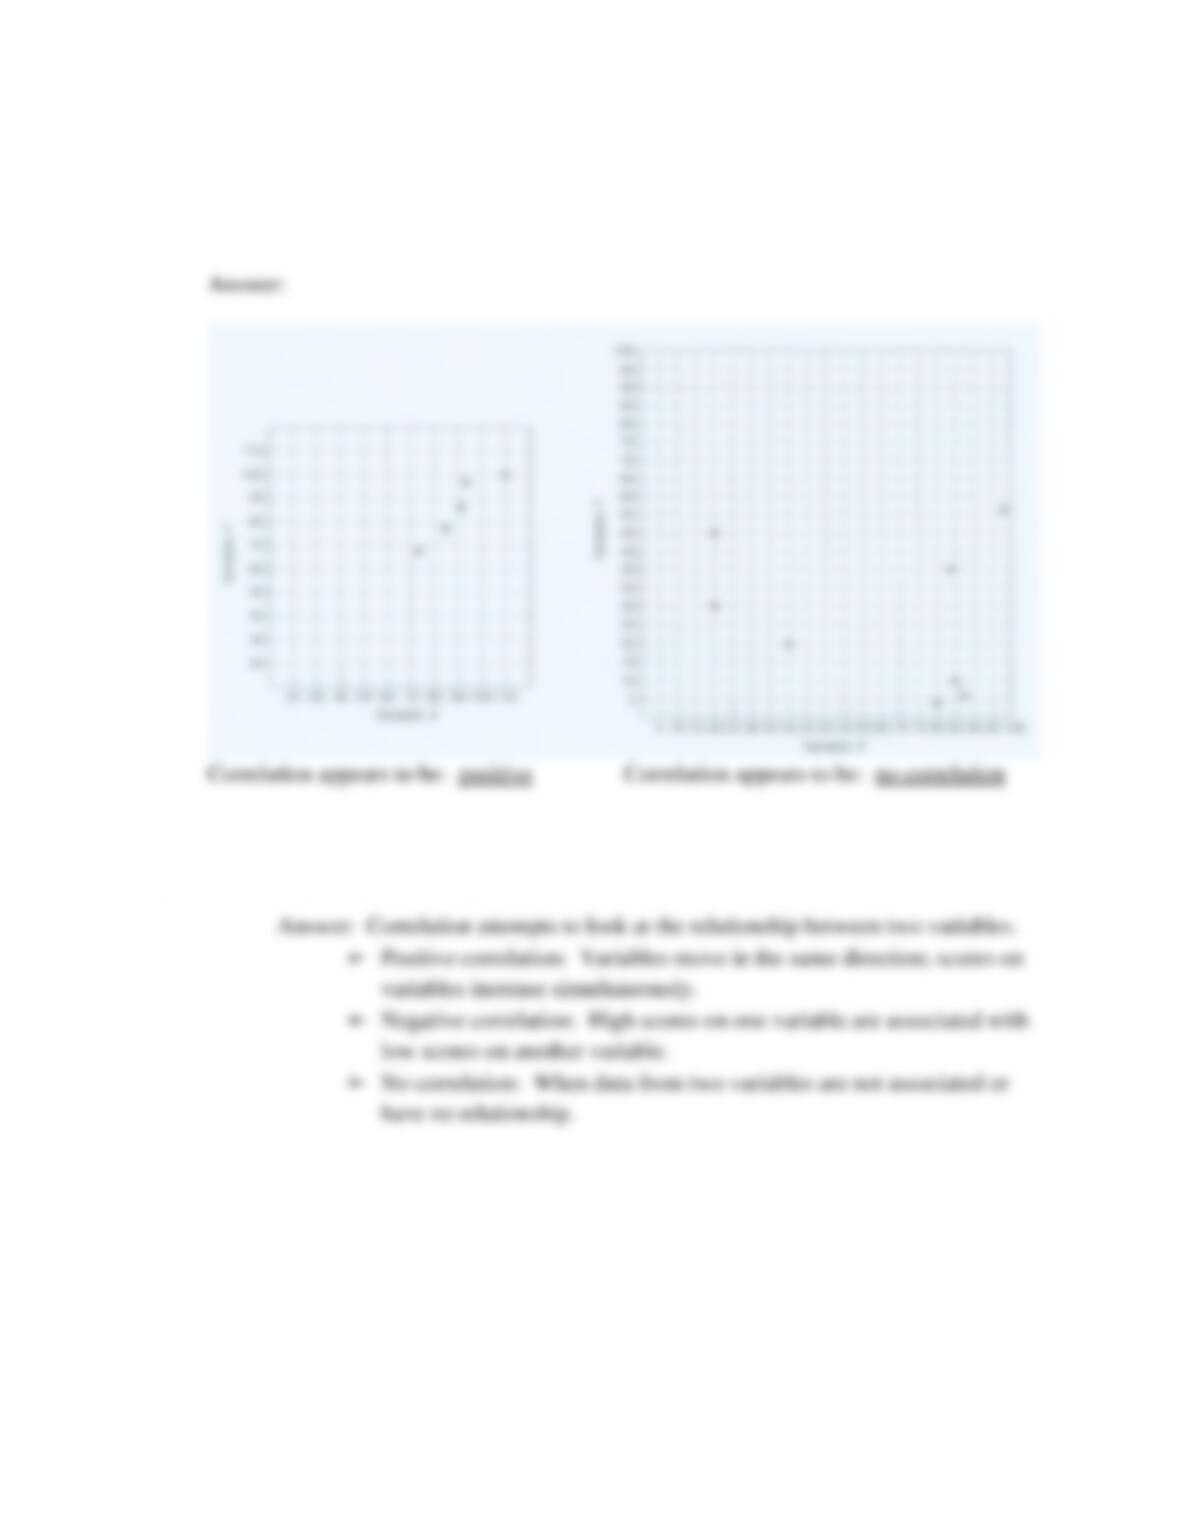
1. Complete the scattergrams using the following sets of data. Determine whether the
scattergrams illustrate positive, negative, or no correlation.
Apply Your Knowledge
Explain the concepts of positive, negative, and no correlation.
Activity 4.4
1. Educator is concerned with item reliability; items are scored as right and wrong.
2. Educator wants to administer the same test twice to measure achievement of objectives.
3. Examiner is concerned with consistency of trait over time.
4. Educator is concerned with item consistency; items scored with different point values for
correct responses.
5. Examiner wants to administer a test that allows for examiner judgment.
Apply Your Knowledge
Explain the difference between internal reliability and other types of reliability.
Activity 4.5
1. What type of reliability is reported in Table 4.1?
2. Look at the reliability reported for age 7. Using fall statistics, compare the reliability
coefficient obtained on the Numeration subtest with the reliability coefficient obtained on
the Estimation subtest. On which subtest did seven-year-olds perform with more
consistency?
3. Compare the reliability coefficient obtained by nine-year-olds on the Estimation subtests
with the reliability coefficient obtained by seven-year-olds on the same subtest. Which
age group performed with more consistency or reliability?
Apply Your Knowledge
Explain why the reliability of an instrument may vary across age groups.
Activity 4.6
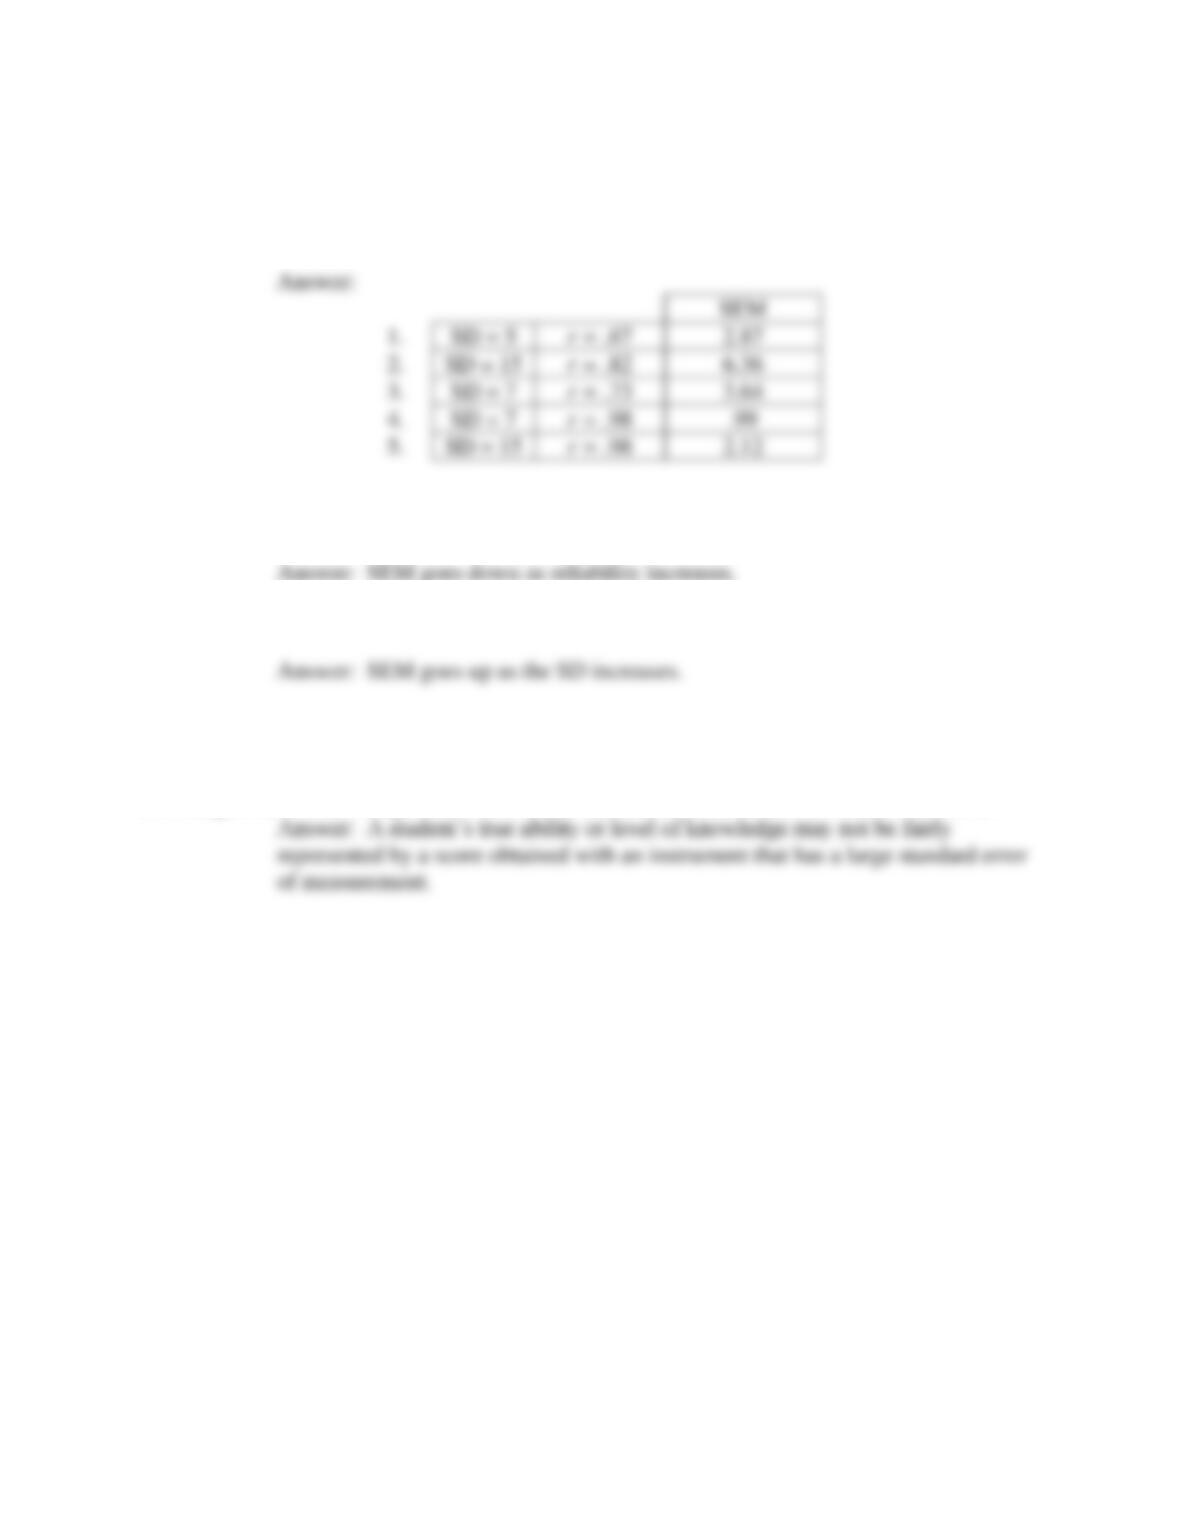
Use the formula to determine the standard error of measurement with the given
standard deviations and reliability coefficients.
6. What happens to the standard error of measurement as the reliability increases?
7. What happens to the standard error of measurement as the standard deviation increases?
Apply Your Knowledge
How might a test with a large SEM result in an inaccurate evaluation of a student’s abilities?
Activity 4.7
1. The standard error of measurement for a seven-year-old who was administered the
Problem Solving subtest in the fall
2. A twelve-year-old’s standard error of measurement for Problem-Solving if the test was
administered in the fall
3. Using the standard error of measurement found in problems 1 and 2, calculate the ranges
for each age level if the obtained scores were both 7. Calculate the ranges for both 68%
and 95% confidence intervals.
Apply Your Knowledge
When comparing the concepts of a normal distribution and the SEM, the SEM units are
distributed around the ___ and the standard deviation units are evenly distributed around the
____.
Activity 4.8
1. Based on this information, in which grades would you feel that the test would yield more
reliable results? Why?
2. Would you consider purchasing this instrument?
3. Explain how the concurrent criterion-related validity would have been determined
Think Ahead Exercises
Part I
1. A new academic achievement test assesses elementary-age students’ math ability. The
test developers found, however, that students in the research group who took the test two
times had scores that were quite different upon the second test administration, which was
conducted two weeks after the initial administration. It was determined that the test did
not have acceptable ___.
2. A new test was designed to measure the self-concept of students of middle school age.
The test required students to use essay-type responses to answer three questions regarding
their feelings about their own self-concept. Two assessment professionals were
comparing the students’ responses and how these responses were scored by the
professionals. On this type of instrument, it is important that the ___ is acceptable.
3. In studying the relationship between the scores of the administration of one test
administration with the second administration of the test, the number .89 represents the
___.
4. One would expect that the number of classes a college student attends in a specific course
and the final exam grade in that course would have a ___.
5. In order to have a better understanding of a student’s true abilities, the concept of ___
must be understood and applied to obtained scores.
6. The number of times a student moves during elementary school may likely have a ___ to
the student’s achievement scores in elementary school.
7. A test instrument may have good reliability; however, that does not guarantee that the test
has ___.
8. On a teacher-made test of math, the following items were included: two single-digit
addition problems, one single-digit subtraction problem, four problems of multiplication
of fractions, and one problem of converting decimals to fractions. This test does not
appear to have good ___.
9. A college student failed the first test of the new semester. The student hoped that the first
test did not have strong ___ about performance on the final exam.
10. No matter how many times a student may be tested, the student’s ___ may never be
determined.
Part II
1. The score obtained during the assessment of a student may not be the true score, because
all testing situations are subject to chance ___.
2. A closer estimation of the student’s best performance can be calculated by using the ___
score.
3. A range of possible scores can then be determined by using the ___ for the specific test.
4. The smaller the standard error of measurement, the more ___ the test.
5. When calculating the range of possible scores, it is best to use the appropriate standard
error of measurement for the student’s ___ provided in the test manual.
6. The larger the standard error of measurement, the less ___ the test.
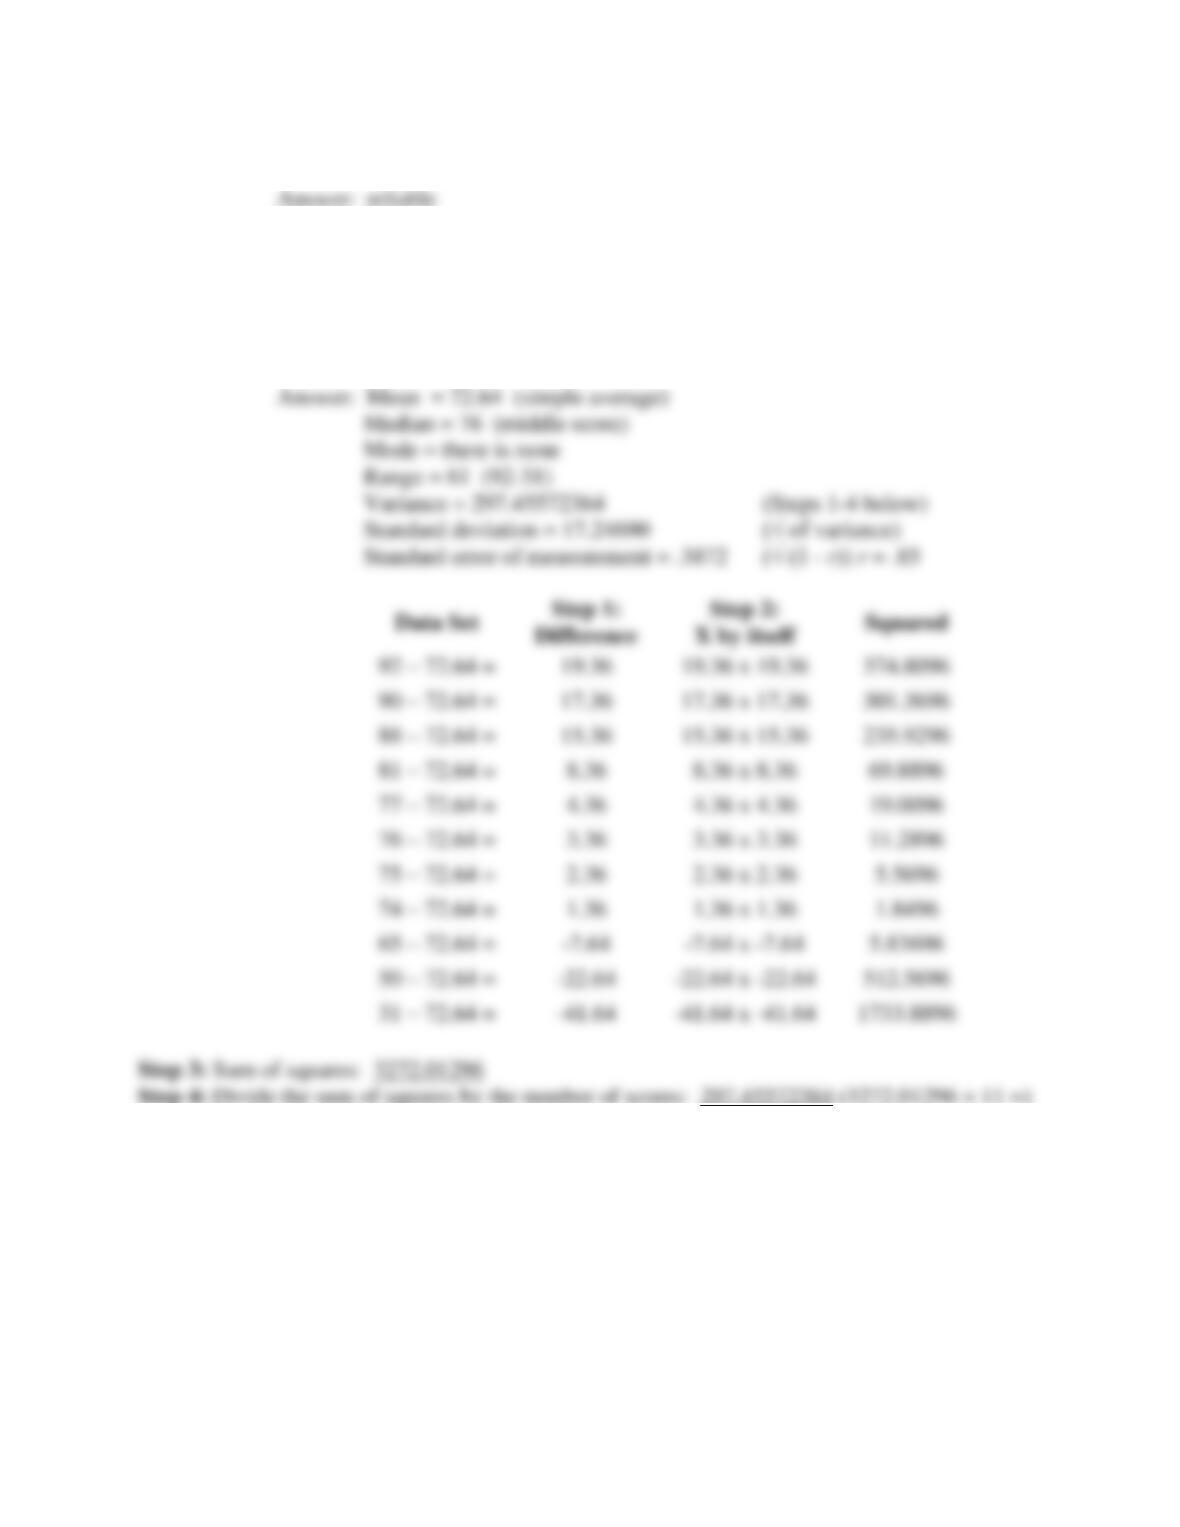
7. Use the following set of data to determine the mean, median, mode, range, variance,
standard deviation, standard error of measurement, and possible range for each score
assuming 68% confidence. The reliability coefficient is .85.
Data: 50, 75, 31, 77, 65, 81, 90, 92, 76, 74, 88
Chapter 4 Test Bank
True and False
1. When a test measures what it was designed to measure and what it purports to measure,
this test is said to be reliable.
2. Estimated true score allows you to calculate the amount of error with reference to the
distance of the score from the mean of the group.
3. A perfect positive correlation would be indicated by a straight line between scores on a
scattergram.
4. Standard error of measurement is used to determine confidence intervals.
5. The validity of a test should be determined by how consistent the results are over time.
6. As long as a test has good validity, the reliability is not important.
7. A teacher who administers a wide range achievement test in reading (i.e., WRAT) is able
to take the score obtained and generalize it across all of the individual domains and skills
associated with reading.
8. Some of the variables of content validity that may influence the manner in which results
are obtained and which can contribute to bias in testing include presentation format and
response mode.
9. When a preschool test is needed to determine how students will perform in reading, it is
important that the test have good predictive validity.
10. Generally, when tests measure constructs that are affected by developmental changes, the
reliability may not be as good for very young ages.
Multiple Choice
1. When analyzing the correlation illustrated on a scattergram, the closer the approximation
of a straight line (indicating a perfect degree of correlation), the nearer the correlation is
to which of the following?
A. +1.00
B. 0
C. +.50
D. .50
2. Which of the following refers to the consistency of scores on a specific instrument across
time or across items?
A. Test variability
B. Test validity
C. Test error
D. Test reliability
3. The scores obtained by Dr. Smith on a psychology test were compared and it was
determined that students who scored high on the first exam tended to score high on the
second exam. Which of the following represents the probable correlation between the two
sets of scores?
A. No correlation
B. Positive correlation
C. Negative correlation
D. Valid correlation
4. Which of the following may be determined by analyzing the relationship between two
sets of scores?
A. Standard error
B. Reliability
C. Deviation
D. Percentiles
5. When a teacher gives a test to students on one occasion, repeats the exam on the same
students at a later date, and then correlates the scores, the teacher is demonstrating
interest in determining which of the following?
A. Split-half reliability
B. Face validity
C. Construct validity
D. Test-retest reliability