Interdependence and the Gains from Trade
Multiple Choice – Section 00: Introduction
1.
People who provide you with goods and services
a.
are acting out of generosity.
b.
do so because they get something in return.
c.
have chosen not to become interdependent.
d.
are required to do so by the government.
2.
When an economist points out that you and millions of other people are interdependent, he or she is
referring to the
fact that we all
a.
rely upon the government to provide us with the basic necessities of life.
b.
rely upon one another for the goods and services we consume.
c.
have similar tastes and abilities.
d.
are concerned about one another’s well-being.
488 Interdependence and the Gains from Trade
Multiple Choice – Section 01: A Parable for the Modern Economy
1.
Which of the following is not a reason people choose to depend on others for goods and services?
a.
to improve their lives
b.
to allow them to enjoy a greater variety of goods and services
c.
to consume more of each good without working any more hours
d.
to allow people to produce outside their production possibilities frontiers
2.
When can two countries gain from trading two goods?
a.
when the first country can only produce the first good and the second country can only produce
the second
good
b.
when the first country can produce both goods, but can only produce the second good at great
cost, and the
second country can produce both goods, but can only produce the first good at
great cost
c.
when the first country is better at producing both goods and the second country is worse at
producing both
goods
d.
Two countries could gain from trading two goods under all of the above conditions.
3.
Tom produces baseball gloves and baseball bats. Steve also produces baseball gloves and baseball
bats, but Tom is
better at producing both goods. In this case, trade could
a.
benefit both Steve and Tom.
b.
benefit Steve, but not Tom.
c.
benefit Tom, but not Steve.
d.
benefit neither Steve nor Tom.
4.
Olivia bakes cakes and Andrew grows corn. Olivia and Andrew both like to eat cake and eat corn.
In which of the
following cases is it impossible for both Olivia and Andrew to benefit from trade?
a.
Olivia cannot grow corn and Andrew cannot bake cakes.
b.
Olivia is better than Andrew at baking cakes and Andrew is better than Olivia at growing corn.
c.
Olivia is better than Andrew at baking cakes and at growing corn.
d.
Both Olivia and Andrew can benefit from trade in all of the above cases.
5.
Abby bakes brownies and Liam grows flowers. In which of the following cases is it impossible for
both Abby and
Liam to benefit from trade?
a.
Abby does not like flowers and Liam does not like brownies.
b.
Abby is better than Liam at baking brownies and Liam is better than Abby at growing flowers.
c.
Liam is better than Abby at baking brownies and at growing flowers.
d.
Both Abby and Liam can benefit from trade in all of the above cases.
6.
The production possibilities frontier illustrates
a.
the combinations of output that an economy should produce.
b.
the combinations of output that an economy should consume.
c.
the combinations of output that an economy can produce.
d.
All of the above are correct.
7.
An economy’s production possibilities frontier is also its consumption possibilities frontier
a.
under all circumstances.
b.
under no circumstances.
c.
when the economy is self-sufficient.
d.
when the rate of tradeoff between the two goods being produced is constant.
8.
A production possibilities frontier is bowed outward when
a.
the more resources the economy uses to produce one good, the fewer resources it has available
to produce
the other good.
b.
an economy is self-sufficient instead of interdependent and engaged in trade.
c.
the rate of tradeoff between the two goods being produced is constant.
d.
the rate of tradeoff between the two goods being produced depends on how much of each good
is being
produced.
9.
A production possibilities frontier is a straight line when
a.
the more resources the economy uses to produce one good, the fewer resources it has
available to produce
the other good.
b.
an economy is interdependent and engaged in trade instead of self-sufficient.
c.
the rate of tradeoff between the two goods being produced is constant.
d.
the rate of tradeoff between the two goods being produced depends on how much of each
good is being
produced.
10.
Consider two individuals — Marquis and Serena — each of whom would like to wear sweaters
and eat tasty food. The gains from trade between Marquis and Serena are most obvious in which
of the following cases?
a.
Marquis is very good at knitting sweaters and at cooking tasty food, but Serena’s skills in both
of these
activities are very poor.
b.
Marquis and Serena both are very good at cooking tasty food, but neither has the necessary
skills to knit a
sweater.
c.
Marquis’s cooking and knitting skills are very poor, and Serena’s cooking and knitting skills are
also very poor.
d.
Marquis’s skills are such that he can produce only sweaters, and Serena’s skills are such that
she can produce only tasty food.
11.
Consider two individuals — Howard and Mai — each of whom would like to wear sweaters and
eat tasty food. The gains from trade between Howard and Mai are least obvious in which of the
following cases?
a.
Howard is very good at knitting sweaters and at cooking tasty food, but Mai’s skills in both of
these activities
are very poor.
b.
Howard is very good at knitting sweaters and at cooking tasty food; Mai is very good at
knitting sweaters,
but she knows nothing about cooking tasty food.
c.
Howard’s skills in knitting sweaters are fairly good, but his skills in cooking tasty food are fairly
bad; Mai’s skills in knitting sweaters are fairly bad, but her skills in cooking tasty food are fairly
good.
d.
Howard’s skills are such that he can produce only sweaters, and Mai’s skills are such that she
can produce only tasty food.
12.
A professor spends 10 hours per day giving lectures and writing papers. For the professor, a
graph that shows his
various possible mixes of output (lectures given per day and papers written
per day) is called his
a.
line of tastes.
b.
trade–off curve.
c.
production possibilities frontier.
d.
consumption possibilities frontier.
13.
Suppose there are only two people in the world. Each person’s production possibilities frontier
also represents his or her consumption possibilities when
a.
neither person faces trade-offs.
b.
the frontiers are straight lines.
c.
the frontiers are bowed out.
d.
they choose not to trade with one another.
14.
The most obvious benefit of specialization and trade is that they allow us to
a.
work more hours per week than we otherwise would be able to work.
b.
consume more goods than we otherwise would be able to consume.
c.
spend more money on goods that are beneficial to society, and less money on goods that are
harmful to
society.
d.
consume more goods by forcing people in other countries to consume fewer goods.
15.
As a student, Anne spends 40 hours per week writing term papers and completing homework
assignments. On one
axis of her production possibilities frontier is measured the number of term
papers written per week. On the other
axis is measured the number of homework assignments
completed per week. Anne’s production possibilities
frontier is a straight line if
a.
she faces no trade-off between writing term papers and completing homework assignments.
b.
she can switch between writing term papers and completing homework assignments at a
constant rate.
c.
the rate at which she can switch between homework assignments and term papers depends on
the number
of homework assignments she is completing and on the number of term papers she
is writing.
d.
she is required by her professors to spend half of her time on term papers and the other half of
her time on
homework assignments.
16.
For a self-sufficient producer, the production possibilities frontier
a.
is the same as the consumption possibilities frontier.
b.
is greater than the consumption possibilities frontier.
c.
is less than the consumption possibilities frontier.
d.
is always a straight line.
496 Interdependence and the Gains from Trade
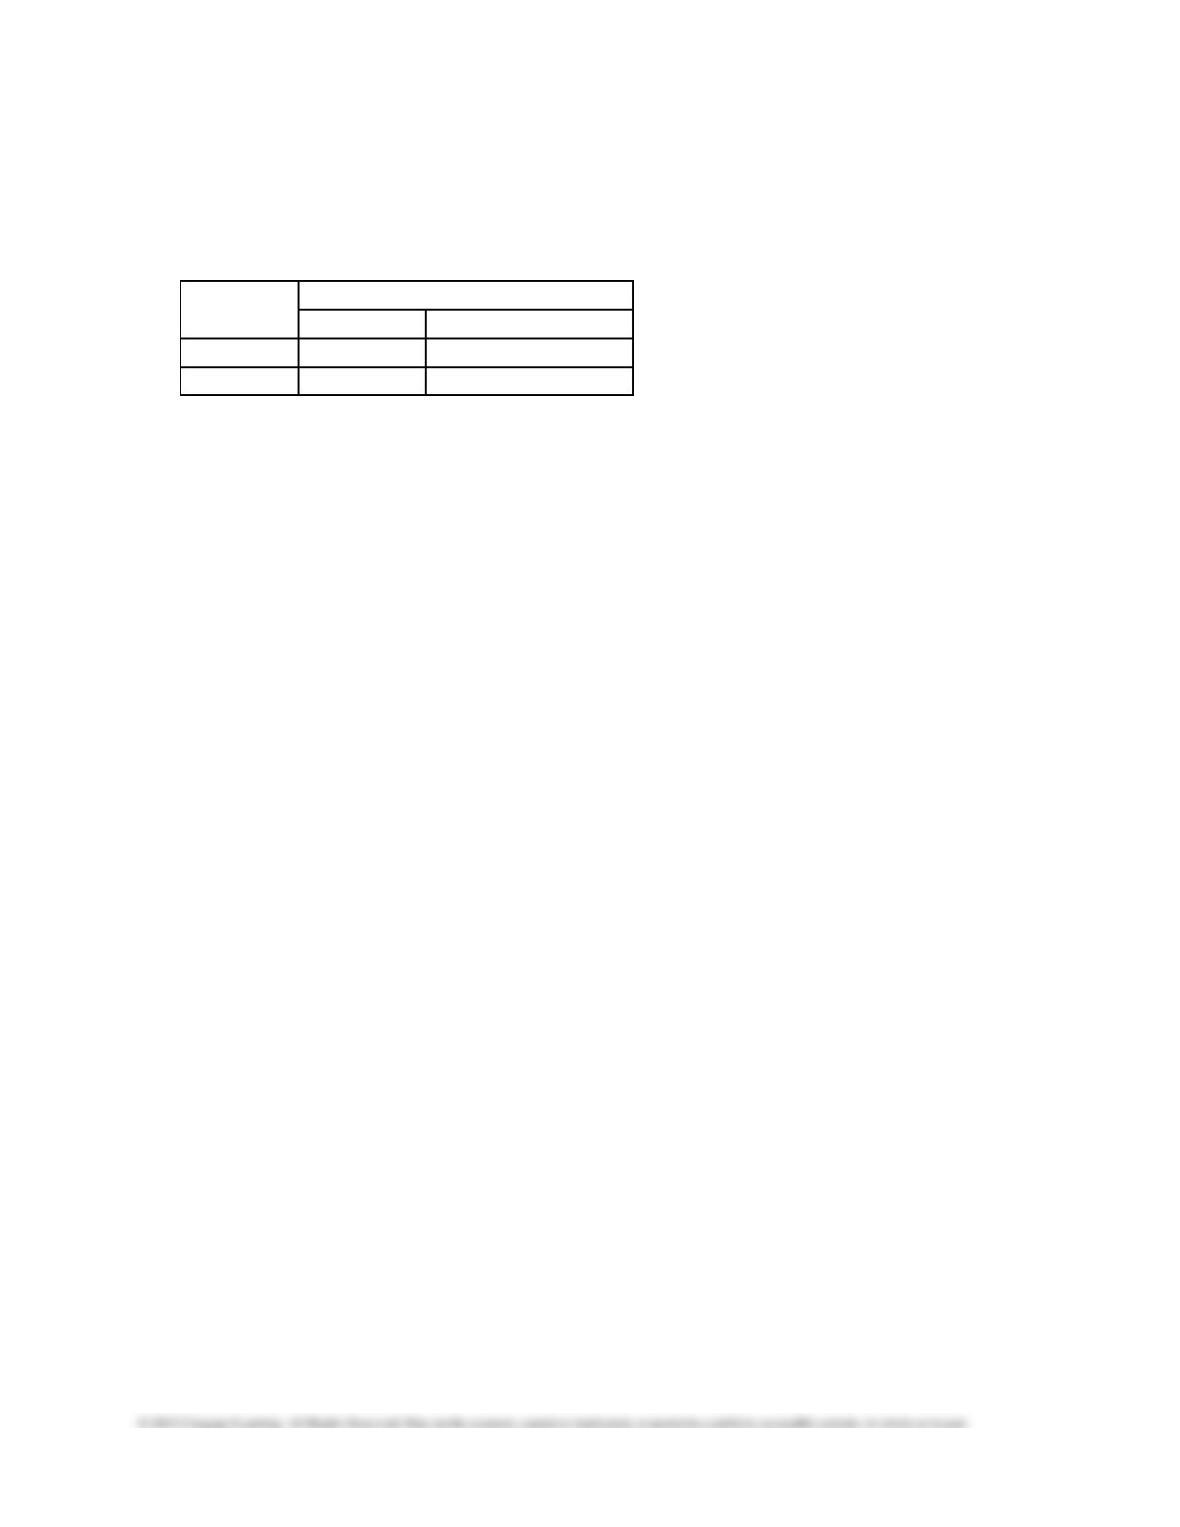
Table 3-1
Assume that John and Jane can switch between producing bread and wine at a constant rate.
Labor Hours Needed
to Make
Bottle of Wine
Loaf of Bread
Jane
2
1.5
John
3
1
17.
Refer to Table 3-1. Assume that John and Jane each work 24 hours. What happens to total
production if instead
of each person spending 12 hours producing each good, Jane spends 21 hours
producing wine and 3 hours
producing bread and John spends 3 hours producing wine and 21
hours producing bread?
a.
The total production of bread and wine each rise.
b.
The total production of bread rises and the total production of wine falls.
c.
The total production of bread falls and the total production of wine rises.
d.
The total production of bread and wine each fall.
Table 3-2
Assume that England and Holland can switch between producing milk and oats at a constant rate.
Number of Units
Produced in an Hour
Milk
Oats
England
10
4
Holland
8
6
18.
Refer to Table 3-2. We could use the information in the table to draw a production possibilities
frontier for
England and a second production possibilities frontier for Holland. If we were to do
this, measuring milk along the
horizontal axis, then
a.
the slope of England’s production possibilities frontier would be –10/4 and the slope of
Holland’s production possibilities frontier would be -4/3.
b.
the slope of England’s production possibilities frontier would be –4/10 and the slope of
Holland’s production possibilities frontier would be -3/4.
c.
the slope of England’s production possibilities frontier would be 10/4 and the slope of Holland’s
production possibilities frontier would be 4/3.
d.
the slope of England’s production possibilities frontier would be 4/10 and the slope of Holland’s
production possibilities frontier would be 3/4.
Table 3-3
Production Opportunities
Hours Needed to
Make 1 Unit of
Number of Units
Produced in 40 Hours
Cheese
Wine
Cheese
Wine
England
1
4
40
10
France
5
2
8
20
19.
Refer to Table 3-3. Assume that England and France each has 40 labor hours available. If each
country divides
its time equally between the production of cheese and wine, then total production is
a.
8 units of cheese and 10 units of wine
b.
24 units of cheese and 15 units of wine
c.
40 units of cheese and 20 units of wine
d.
48 units of cheese and 30 units of wine
20.
Refer to Table 3-3. Which of the following combinations of cheese and wine could France
produce in 40 hours?
a.
2 units of cheese and 20 units of wine
b.
4 units of cheese and 15 units of wine
c.
6 units of cheese and 5 units of wine
d.
8 units of cheese and 20 units of wine
21.
Refer to Table 3-3. Which of the following combinations of cheese and wine could England not
produce in 40
hours?
a.
12 units of cheese and 7 units of wine
b.
16 units of cheese and 6 units of wine
c.
20 units of cheese and 5 units of wine
d.
26 units of cheese and 4 units of wine
22.
Refer to Table 3-3. We could use the information in the table to draw a production possibilities
frontier for
England and a second production possibilities frontier for France. If we were to do
this, measuring cheese along the
horizontal axis, then
a.
the slope of England’s production possibilities frontier would be -4 and the slope of France’s
production possibilities frontier would be –0.4.
b.
the slope of England’s production possibilities frontier would be -0.25 and the slope of France’s
production possibilities frontier would be –2.5.
c.
the slope of England’s production possibilities frontier would be 0.25 and the slope of France’s
production possibilities frontier would be 2.5.
d.
the slope of England’s production possibilities frontier would be 4 and the slope of France’s
production possibilities frontier would be 0.4.
23.
Refer to Table 3-3. We could use the information in the table to draw a production possibilities
frontier for
England and a second production possibilities frontier for France. If we were to do this,
measuring wine along the
horizontal axis, then
a.
the slope of England’s production possibilities frontier would be -4 and the slope of France’s
production possibilities frontier would be –0.4.
b.
the slope of England’s production possibilities frontier would be -0.25 and the slope of France’s
production possibilities frontier would be –2.5.
c.
the slope of England’s production possibilities frontier would be 0.25 and the slope of France’s
production possibilities frontier would be 2.5.
d.
the slope of England’s production possibilities frontier would be 4 and the slope of France’s
production possibilities frontier would be 0.4.
500 Interdependence and the Gains from Trade
Table 3-4
Assume that Andrea and Paul can switch between producing wheat and producing beef at a
constant rate.
Minutes Needed to Make 1
Bushel of Wheat
Pound of Beef
Andrea
30
15
Paul
15
5
24.
Refer to Table 3-4. Assume that Andrea and Paul each has 480 minutes available. If each
person divides his time
equally between the production of wheat and beef, then total production is
a.
24 bushels of wheat and 64 pounds of beef.
b.
21 bushels of wheat and 33 pounds of beef.
c.
16 bushels of wheat and 48 pounds of beef.
d.
5 bushels of wheat and 24 pounds of beef.
25.
Refer to Table 3-4. Which of the following combinations of wheat and beef could Andrea
produce in one 8-hour
day?
a.
16 bushels of wheat and 32 pounds of beef
b.
9 bushels of wheat and 25 pounds of beef
c.
7 bushels of wheat and 15 pounds of beef
d.
10 bushels of wheat and 13 pounds of beef
26.
Refer to Table 3-4. Which of the following combinations of wheat and beef could Paul not
produce in one 8-hour
day?
a.
13 bushels of wheat and 60 pounds of beef
b.
20 bushels of wheat and 30 pounds of beef
c.
20 bushels of wheat and 20 pounds of beef
d.
25 bushels of wheat and 15 pounds of beef
Table 3-5
Assume that Aruba and Iceland can switch between producing coolers and producing radios at a
constant rate.
Labor Hours
Needed to Make 1
Cooler
Radio
Aruba
2
5
Iceland
1
4
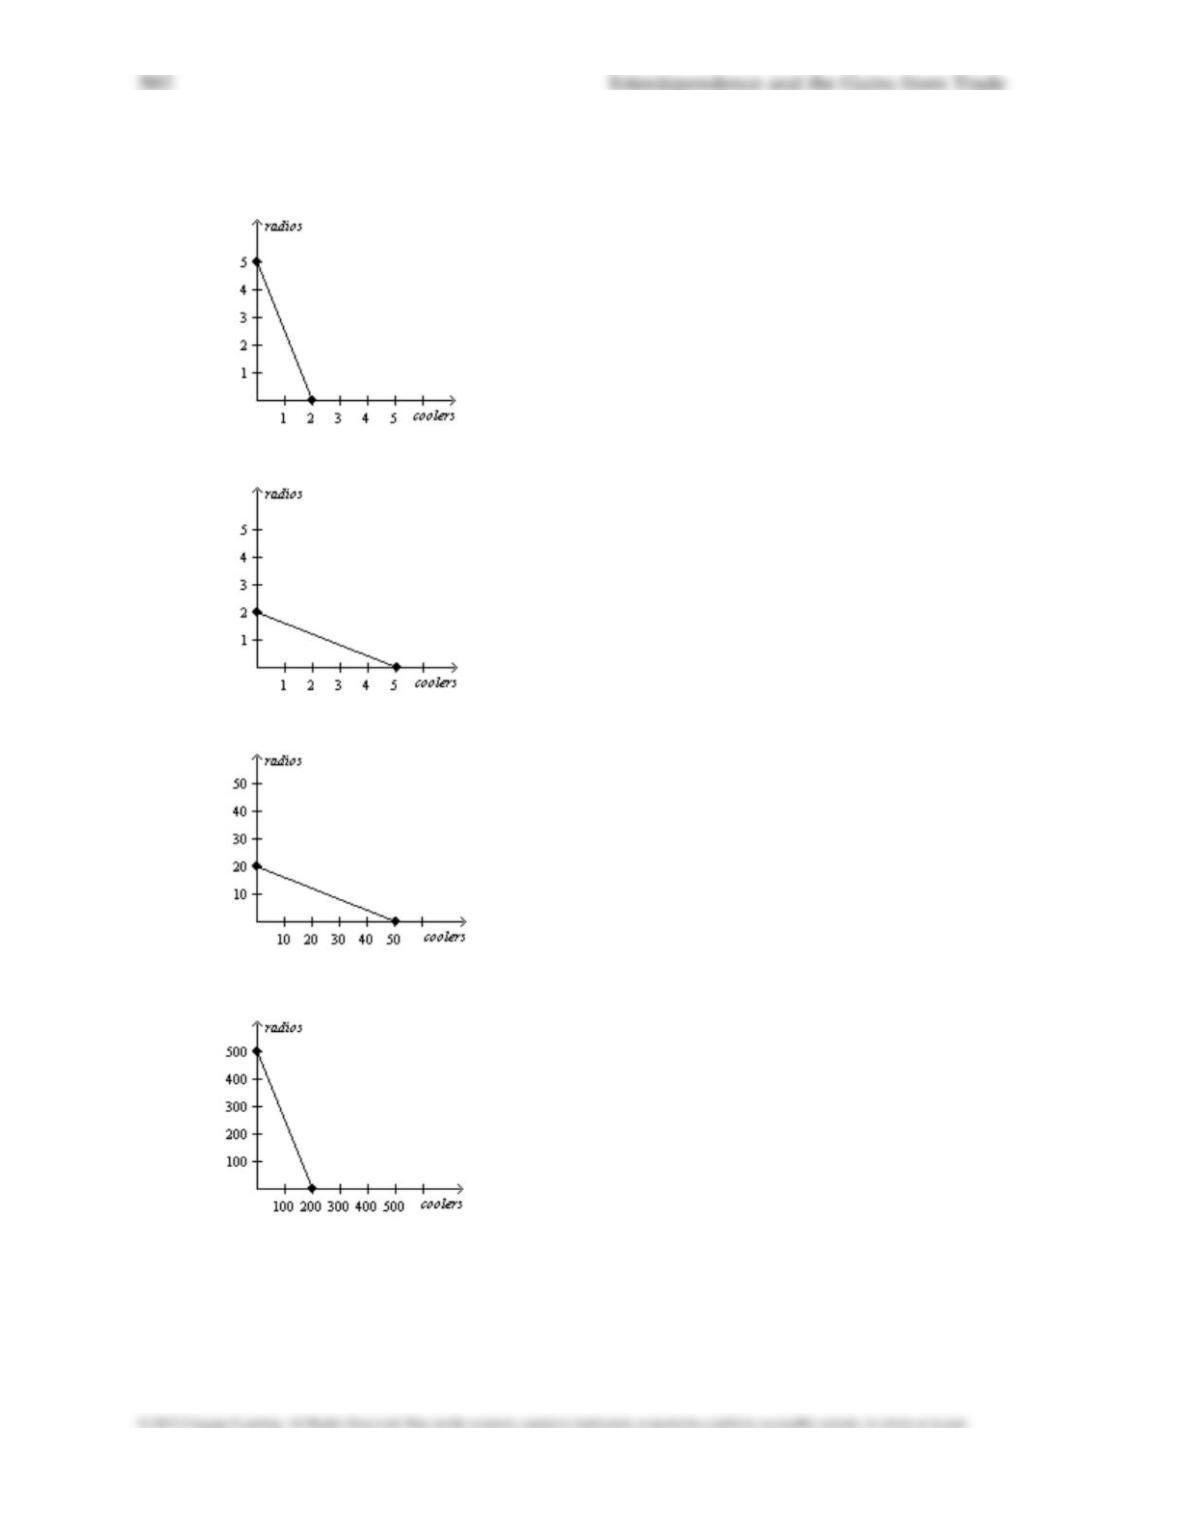
27.
Refer to Table 3-5. Which of the following represents Aruba‘s production possibilities frontier
when 100 labor
hours are available?
a.
b.
c.
d.
Interdependence and the Gains from Trade 503
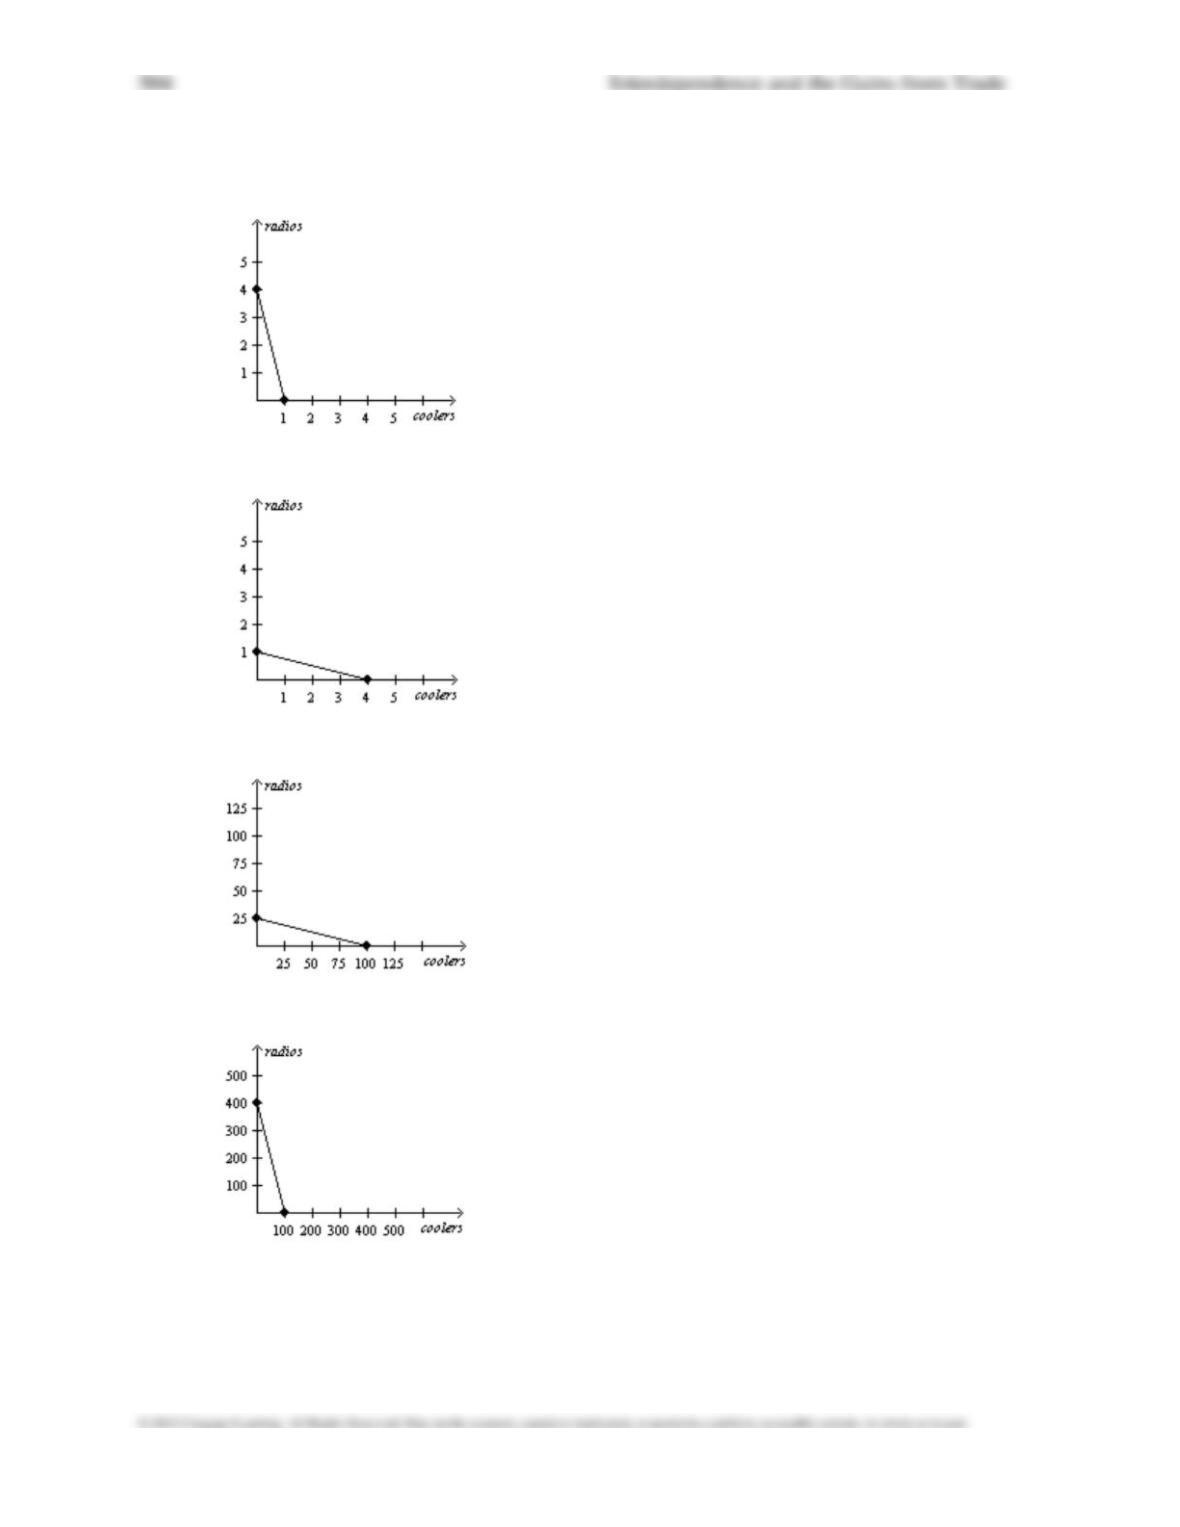
28.
Refer to Table 3-5. Which of the following represents Iceland’s production possibilities frontier
when 100 labor
hours are available?
a.
b.
c.
d.
Interdependence and the Gains from Trade 505
29.
Refer to Table 3-5. Assume that Aruba and Iceland each has 80 labor hours available. If each
country divides its
time equally between the production of coolers and radios, then total production is
a.
28 coolers and 50 radios.
b.
30 coolers and 9 radios.
c.
60 coolers and 18 radios.
d.
120 coolers and 36 radios.
30.
Refer to Table 3-5. Which of the following combinations of coolers and radios could Aruba
produce in one 40–
hour week?
a.
3 coolers and 7 radios
b.
5 coolers and 6 radios
c.
11 coolers and 4 radios
d.
13 coolers and 3 radios
506 Interdependence and the Gains from Trade
Table 3-6
Assume that Zimbabwe and Portugal can switch between producing toothbrushes and producing
hairbrushes at a
constant rate.
Machine Minutes
Needed to Make 1
Toothbrush
Hairbrush
Zimbabwe
3
10
Portugal
5
6