
22) The population of Egypt is distributed relatively uniformly throughout the country.
23) As a comparison of Canada and Namibia shows, periphery countries have lower population
densities than core countries.
24) The majority of the world’s population lives south of the equator.
25) An area with a high nutritional density almost always has a low agricultural density.
26) On average, periphery states have a lower ratio of doctors to inhabitants than do core states.

27) In the U.S. Census, whites are more likely to be overcounted than blacks.
28) A country’s infant mortality rate is a good indicator of the state of its health care system.
29) All peripheral countries continue to suffer from high infant mortality rates of over 100.
30) Demographic transition theory better explains changes in non-core countries than changes in
core countries.
31) In Arizona, people who are not citizens of the U.S.A must carry documents at all times
showing that they have entered the U.S.A. legally.

32) As females in a society receive more education, rates of natural increase drop.
33) Karl Marx provided the theoretical basis for Malthus’ conclusions about population.
34) Most international conferences on population have sought to decrease birth rates.
35) World population growth is projected to be slowest in core countries.
36) Most policymakers and demographers believe that the more education a woman has, the
greater the number of children she will have.

37) Agricultural density is the ratio of farmers to the total population.
38) For an entire country, the nutritional density can never be lower than the crude density.
39) The double burden of malnutrition is a periphery world problem.
40) The doubling time of a population is inversely proportional to its total fertility rate.
41) Obesity and malnutrition can exist in the same population.

42) Throughout much of the second half of the twentieth century, African-Americans
immigrated in large numbers into the South.
43) Thomas Malthus’ policies were based on the theory that people would eventually have less
sex as the world became more civilized.
44) Most governments of the world support family planning and the use of contraceptives.
45) The more similar the sizes of each cohort on a population’s age-sex pyramid, the closer that
population’s rate of natural increase is to zero.
46) The Arab Spring resulted in a massive drop in the number of forced migrants and refugees
around the world since 2011.

47) According to Dissimilarity-Index scores, disparities in health care density are no longer
evidence of core-periphery inequality.
48) In the United States, the percentage of the population living in urban areas peaked around
1920.
49) In 2000, 32 countries in the core had rates of natural increase of 0.0 or less. That means that
at this rate their populations will never double.
50) It is impossible for a country to have a negative rate of natural increase.
51) In 2014, Indonesia (pop. 251 million), Mexico (pop. 120 million) and El Salvador (pop. 6.4
million) all had rates of natural increases of 1.4. This means their populations are projected to
double at the same time.
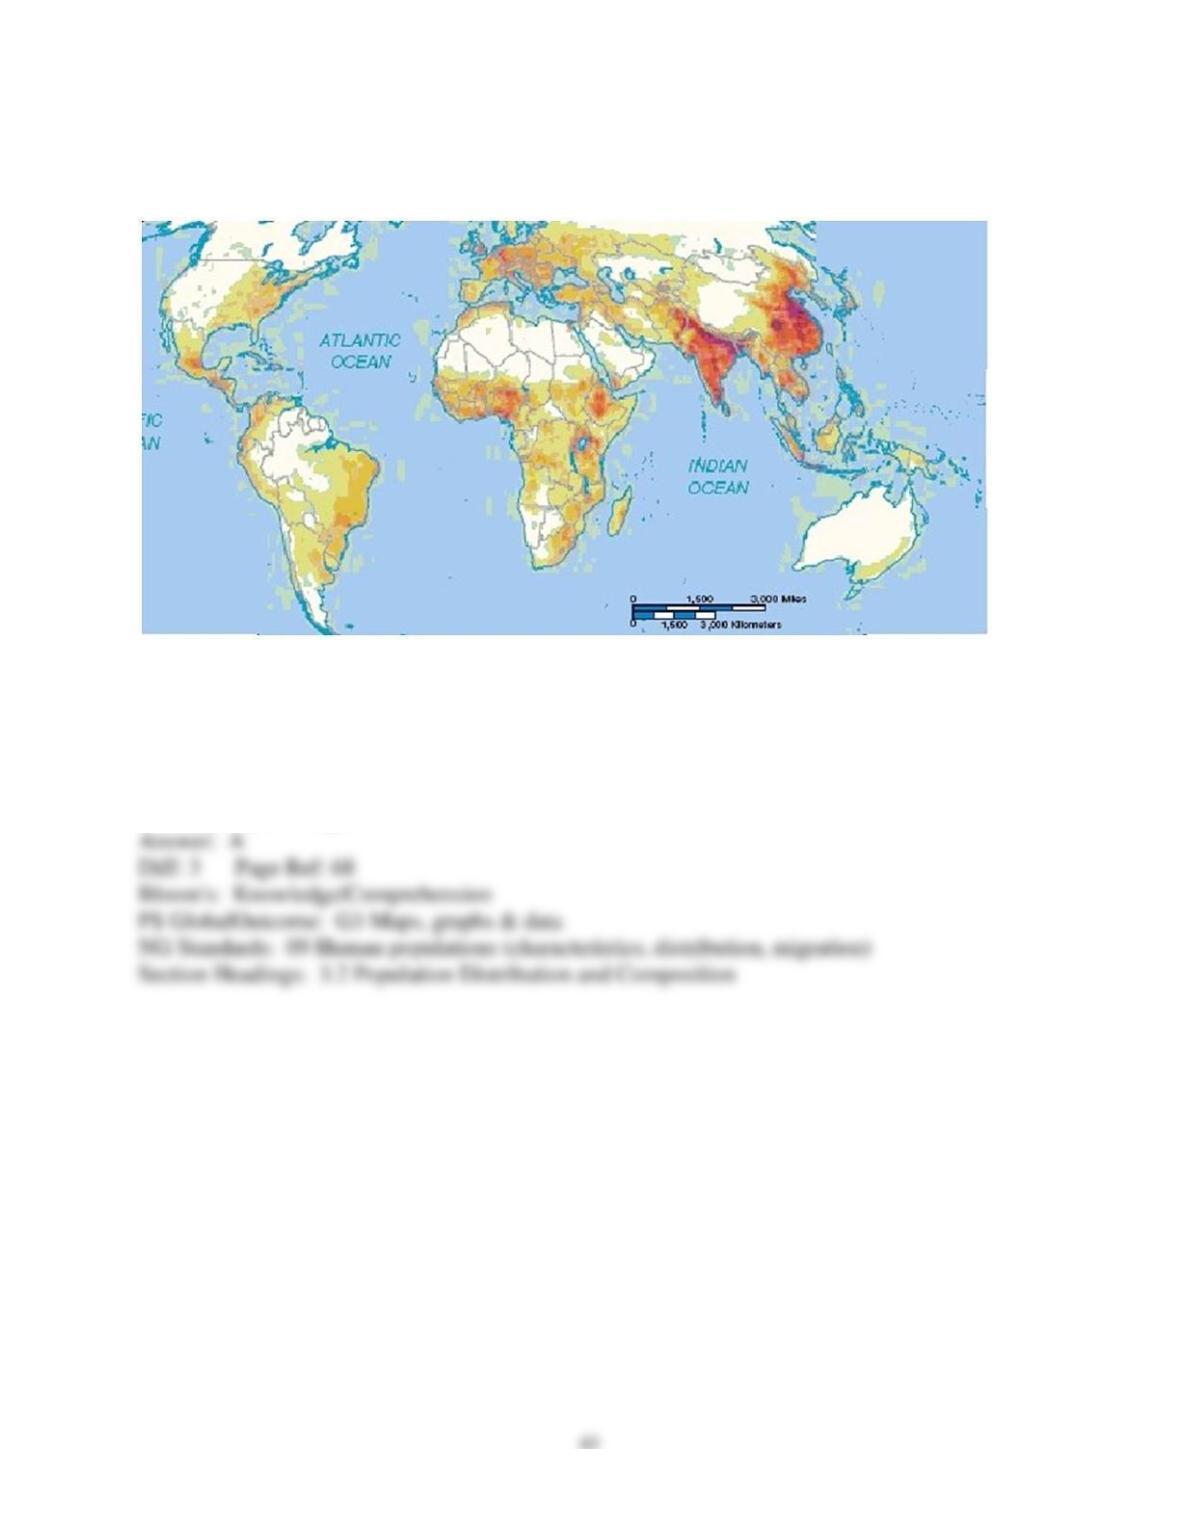
3.3 Questions with Images
1) If the darker shadings represent greater density, the above map best represents
A) population.
B) GDP per capita.
C) total GDP.
D) life expectancy.
E) semiperipheral regions.
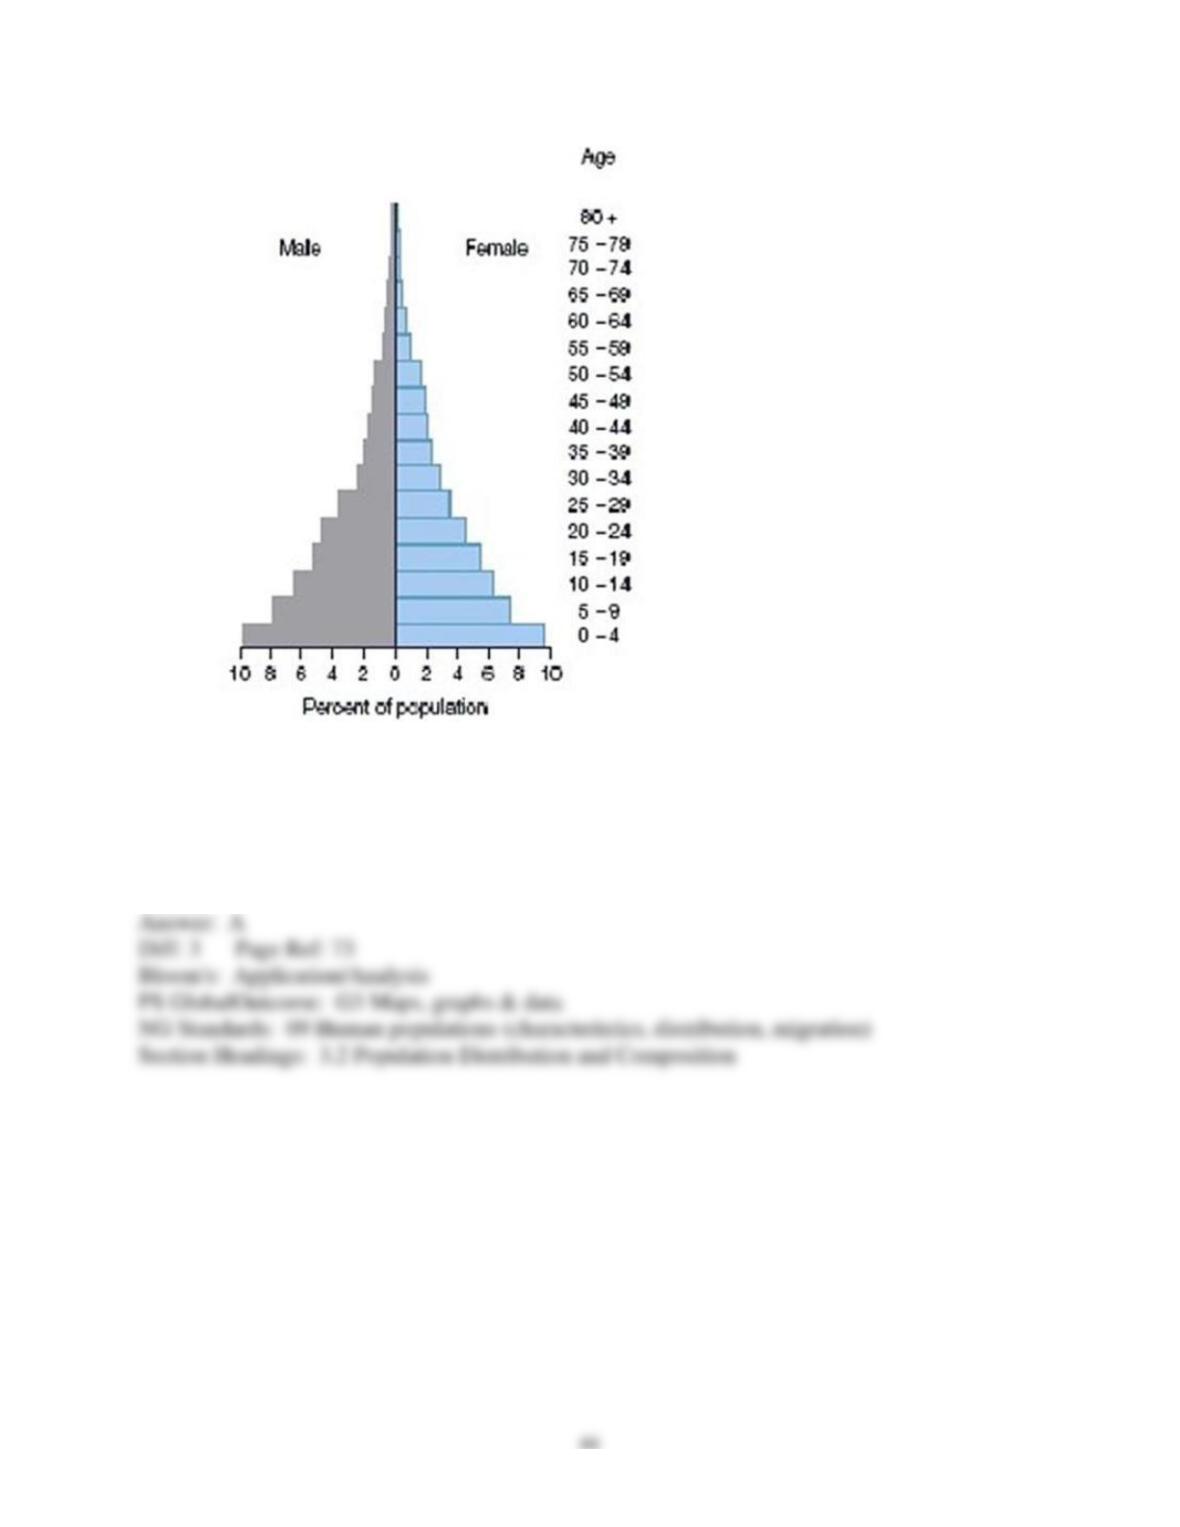
2) The above population pyramid would most likely represent a(n) ________ country.
A) Sub-Saharan
B) West European
C) East European
D) North American
E) Island
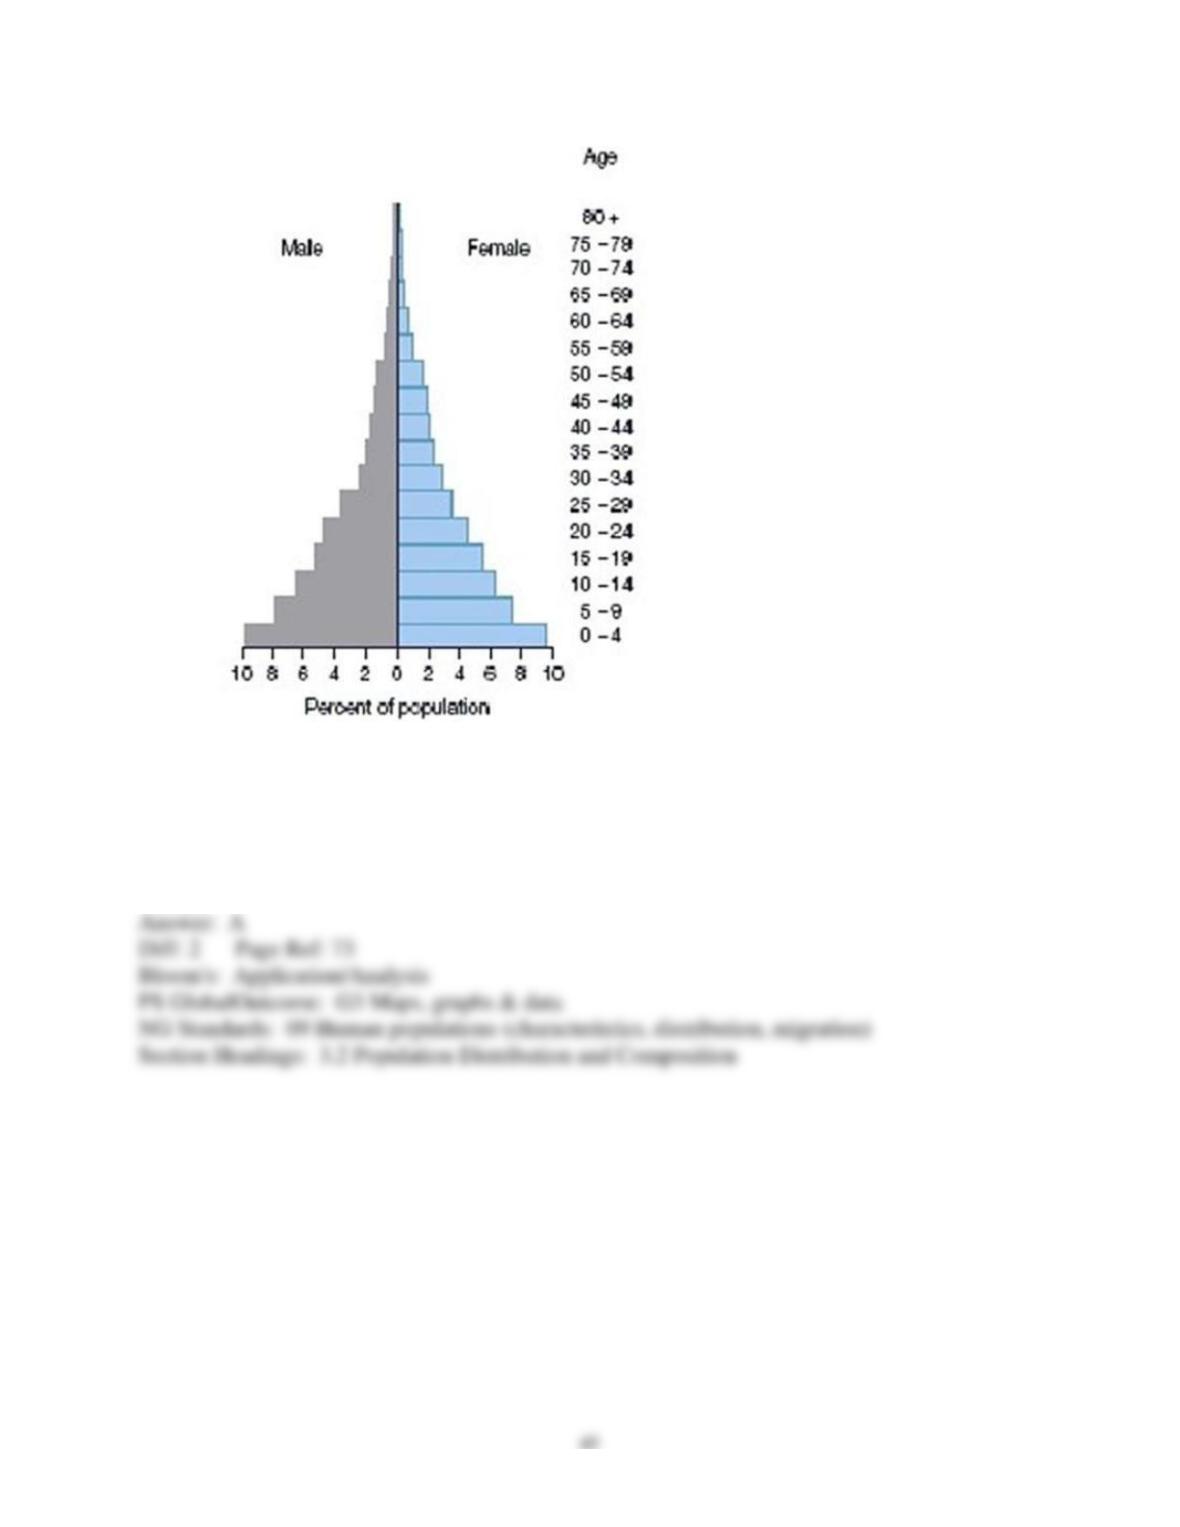
3) The above population pyramid represents the population of
A) Mali.
B) Finland.
C) Poland.
D) Canada.
E) Japan.
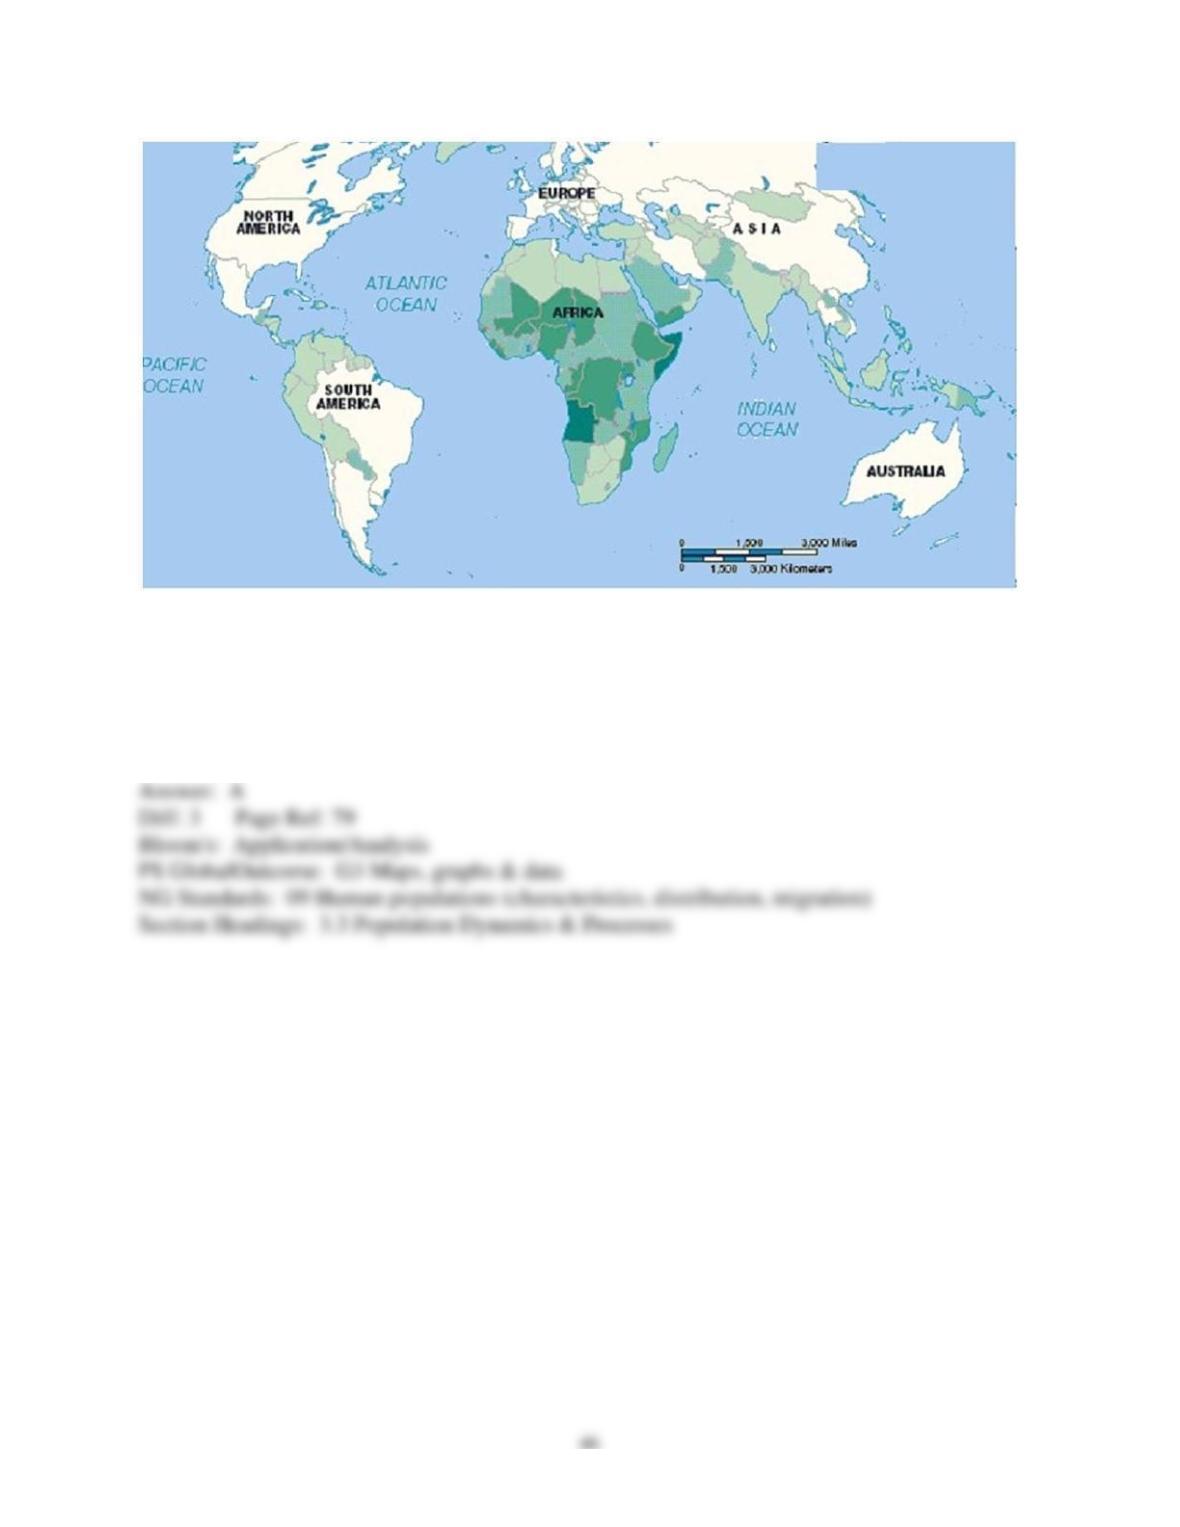
4) In the above map, the darker areas most likely represent areas of higher
A) birth rates.
B) death rates.
C) refugee populations.
D) education levels.
E) nutritional densities.
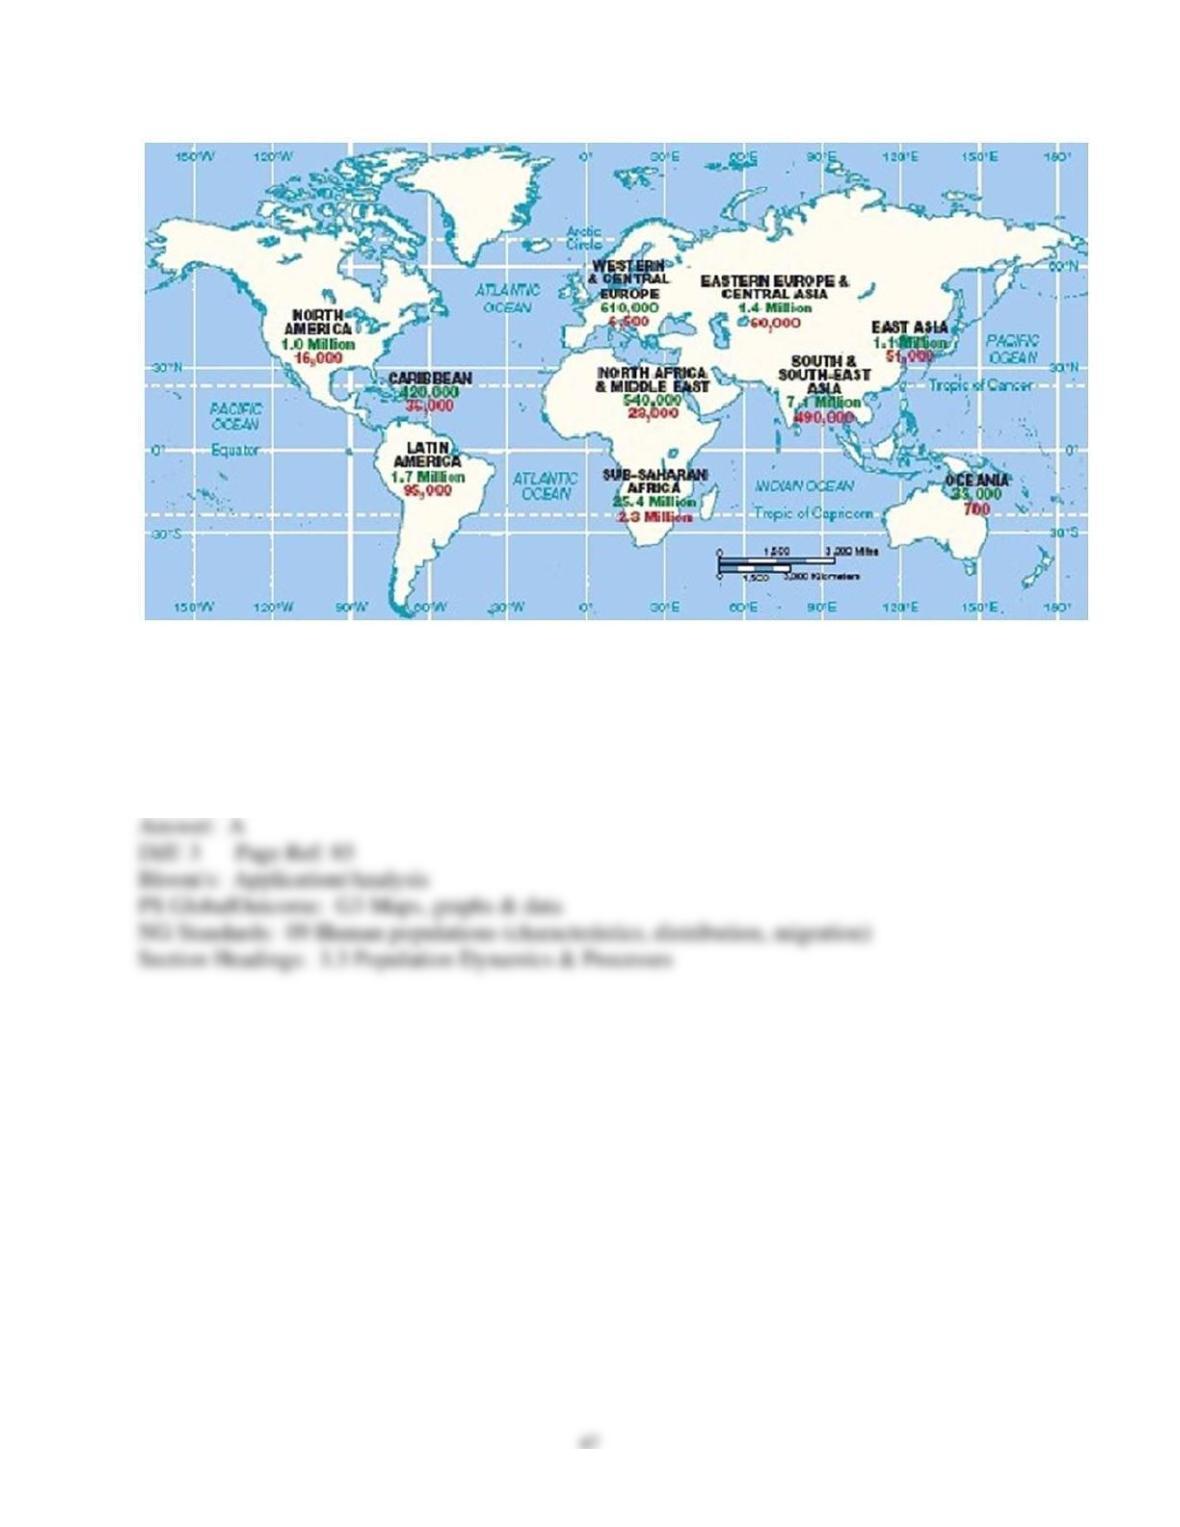
5) The statistics on the above map represent people living with and dying from
A) HIV/AIDS.
B) famine.
C) war.
D) internal displacement.
E) diasporas.
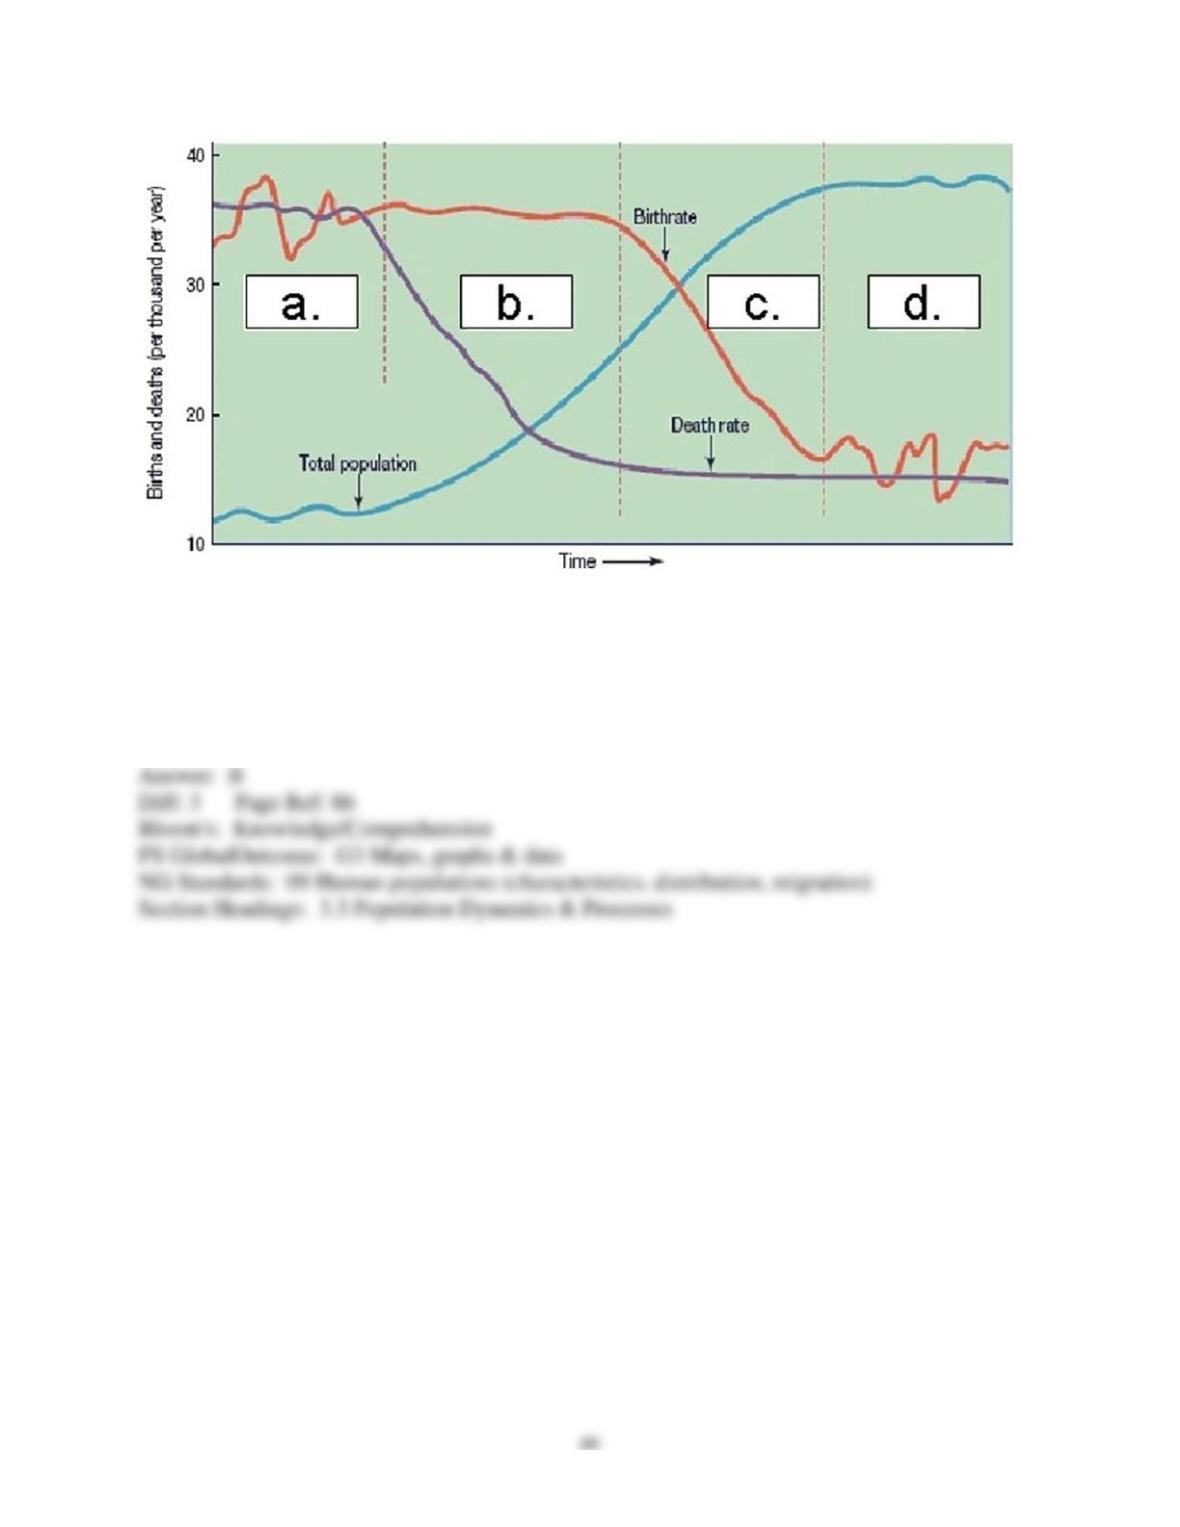
6) According to some demographers, the high rates of natural increase in the world’s periphery
are because the countries that are stalled in which phase?
A) a.
B) b.
C) c.
D) d.
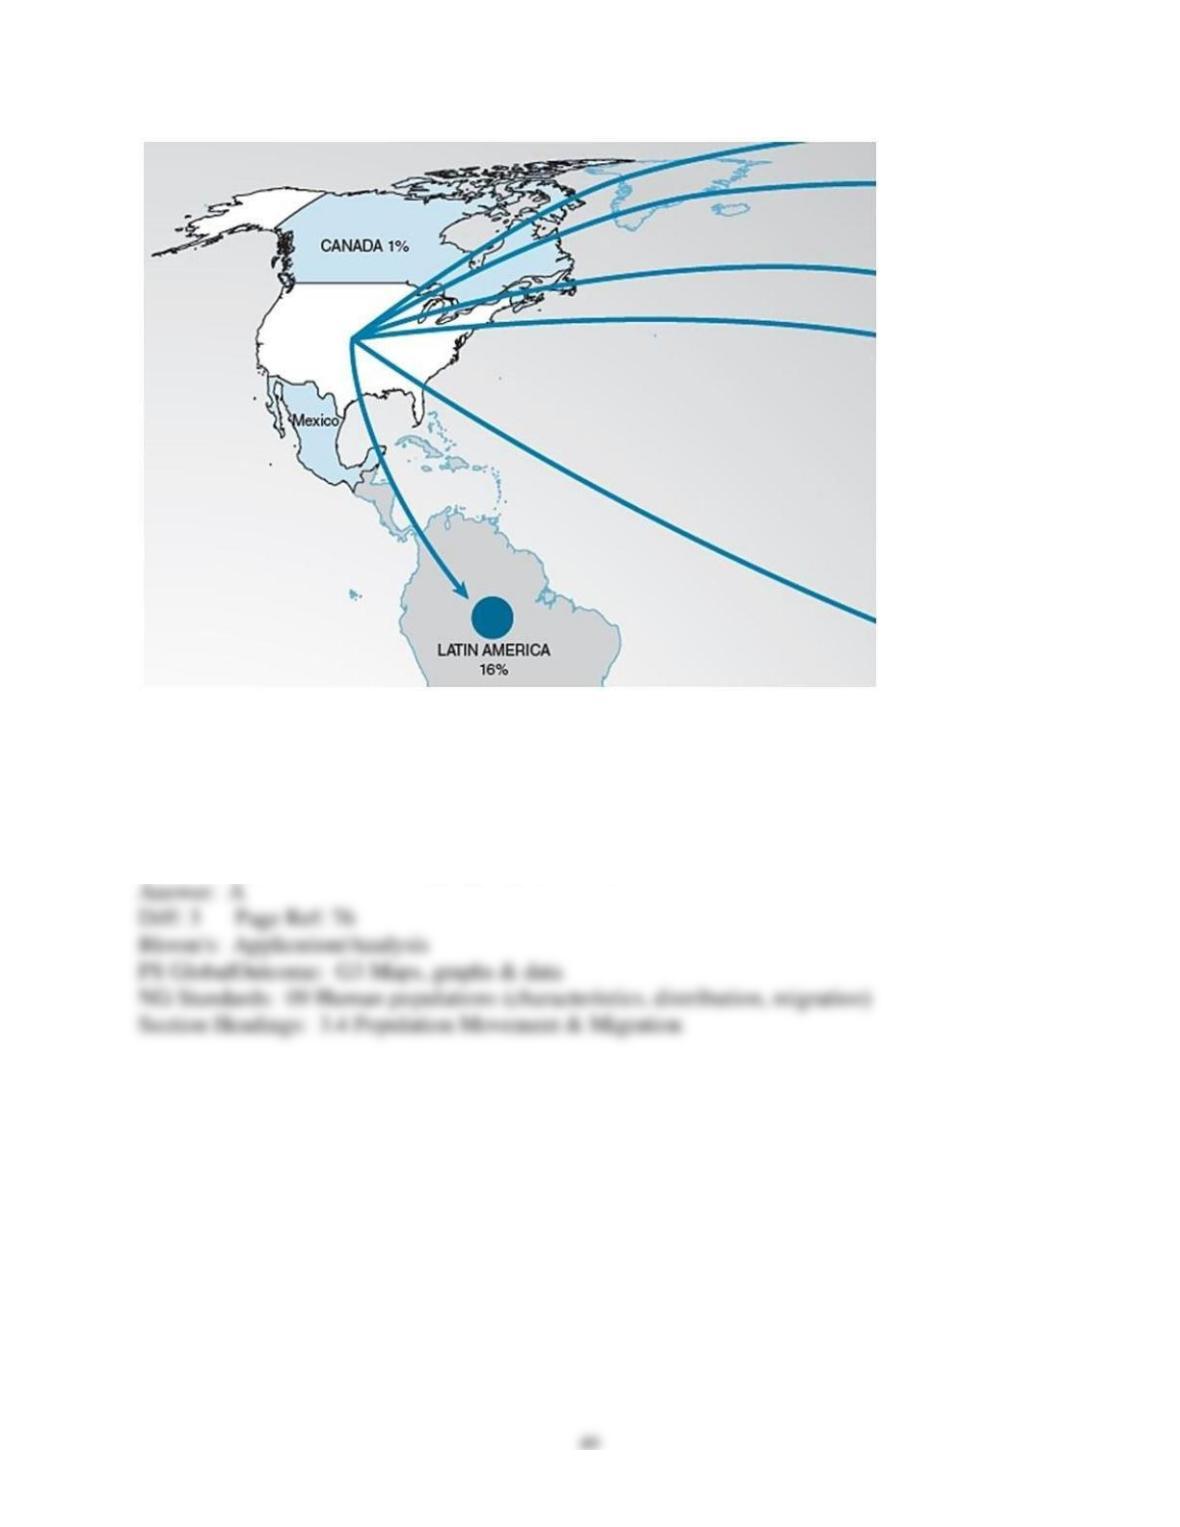
7) The above map graphically represents
A) U.S. students studying abroad.
B) U.S. expatriate destinations.
C) refugees from the U.S.
D) contraceptives provided by the U.S. Agency for International Development.
E) medical personnel sent to help fight epidemics and zoonoses.
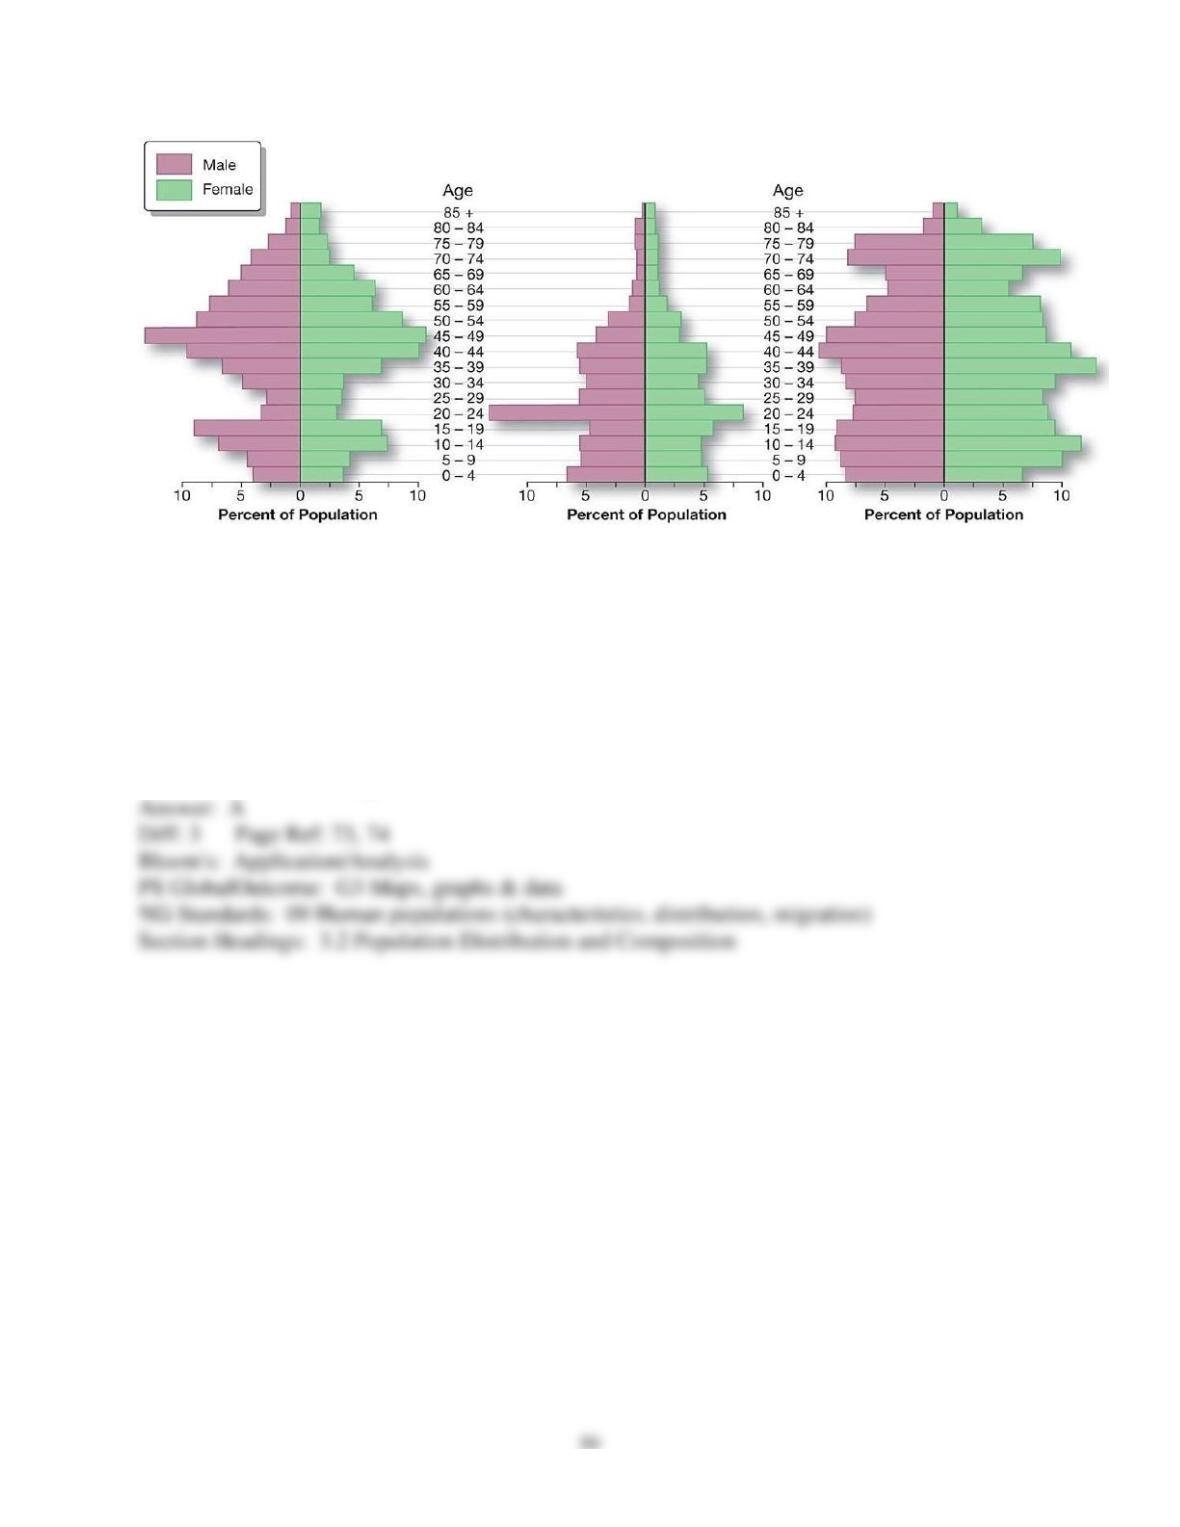
8) Each of the three population pyramids (above) are census tracts from St. Louis County in
northern Minnesota, that stretches from Duluth to Canada. The population pyramid on the left
most likely represents
A) a rural population with high out-migration after high school.
B) an urban population with a high number of immigrant workers.
C) the part of the county with the University of Minnesota-Duluth in it.
D) a retirement community on the border with Canada.
E) The median census tract, where all the women are strong, the men are good-looking, and the
children are above average.
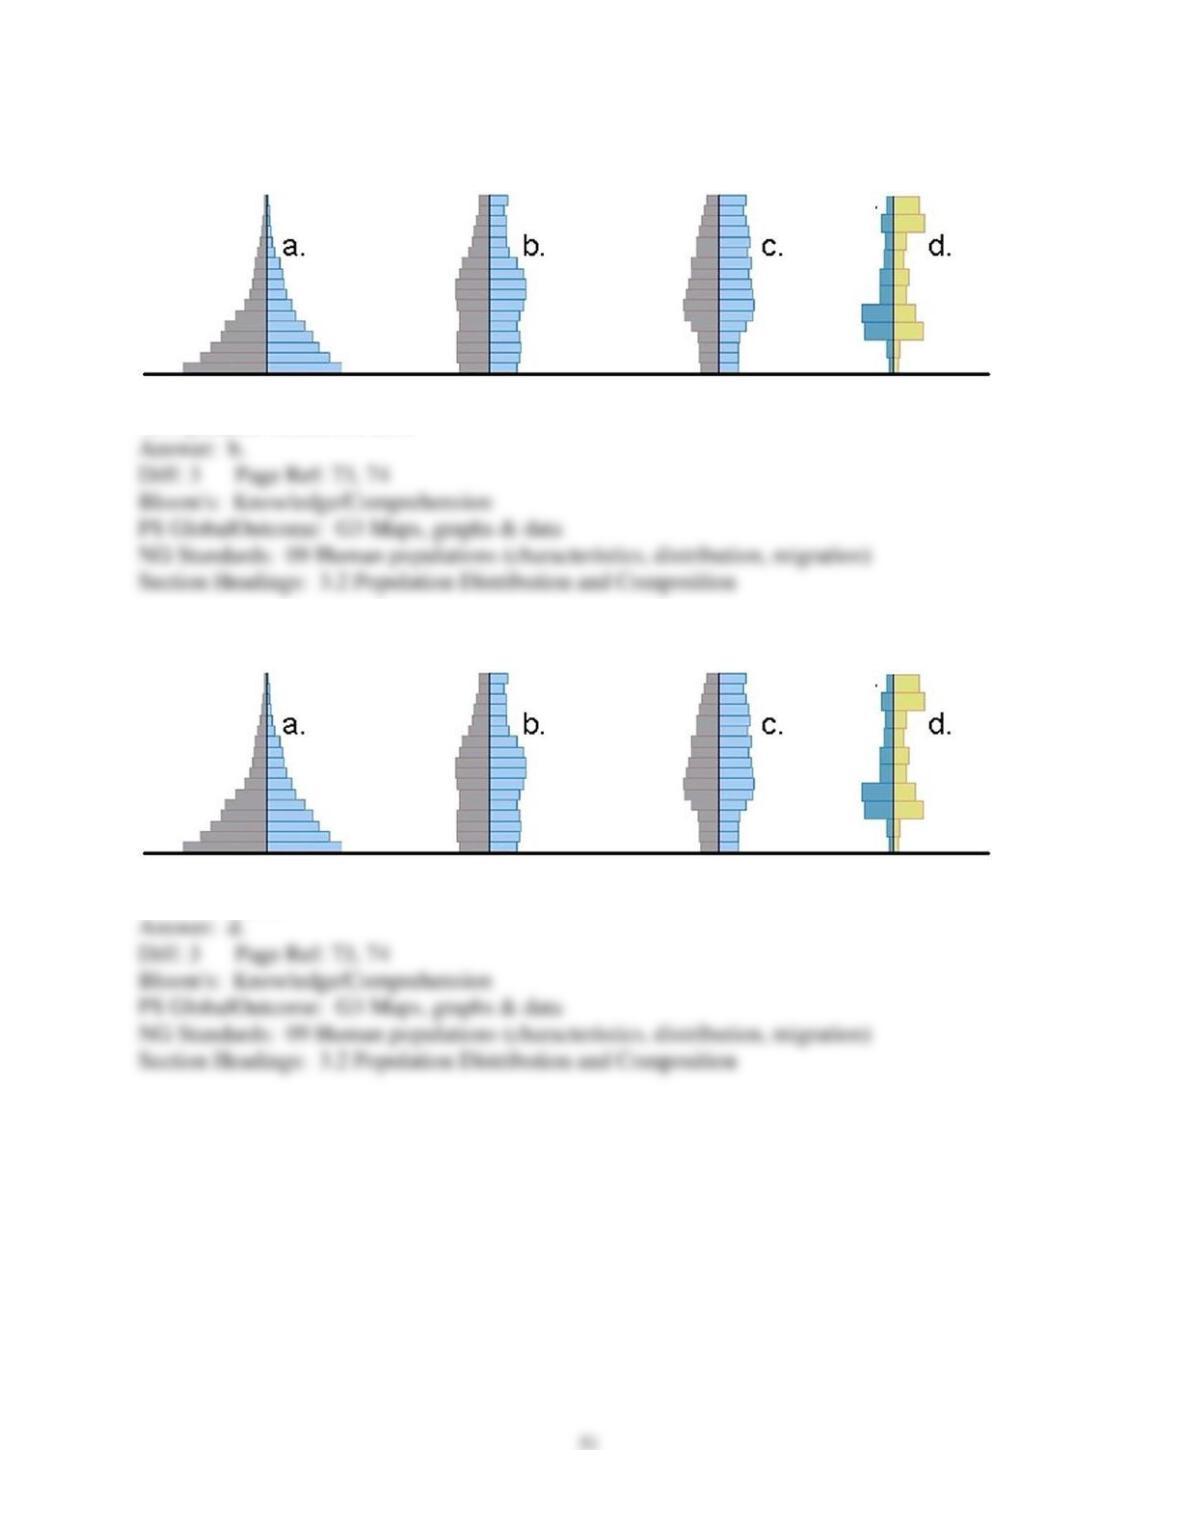
Age-Sex Diagrams: Match diagram to the population it represents.
9) Population with a low RNI
Age-Sex Diagrams: Match diagram to the population it represents.
10) Elderly population
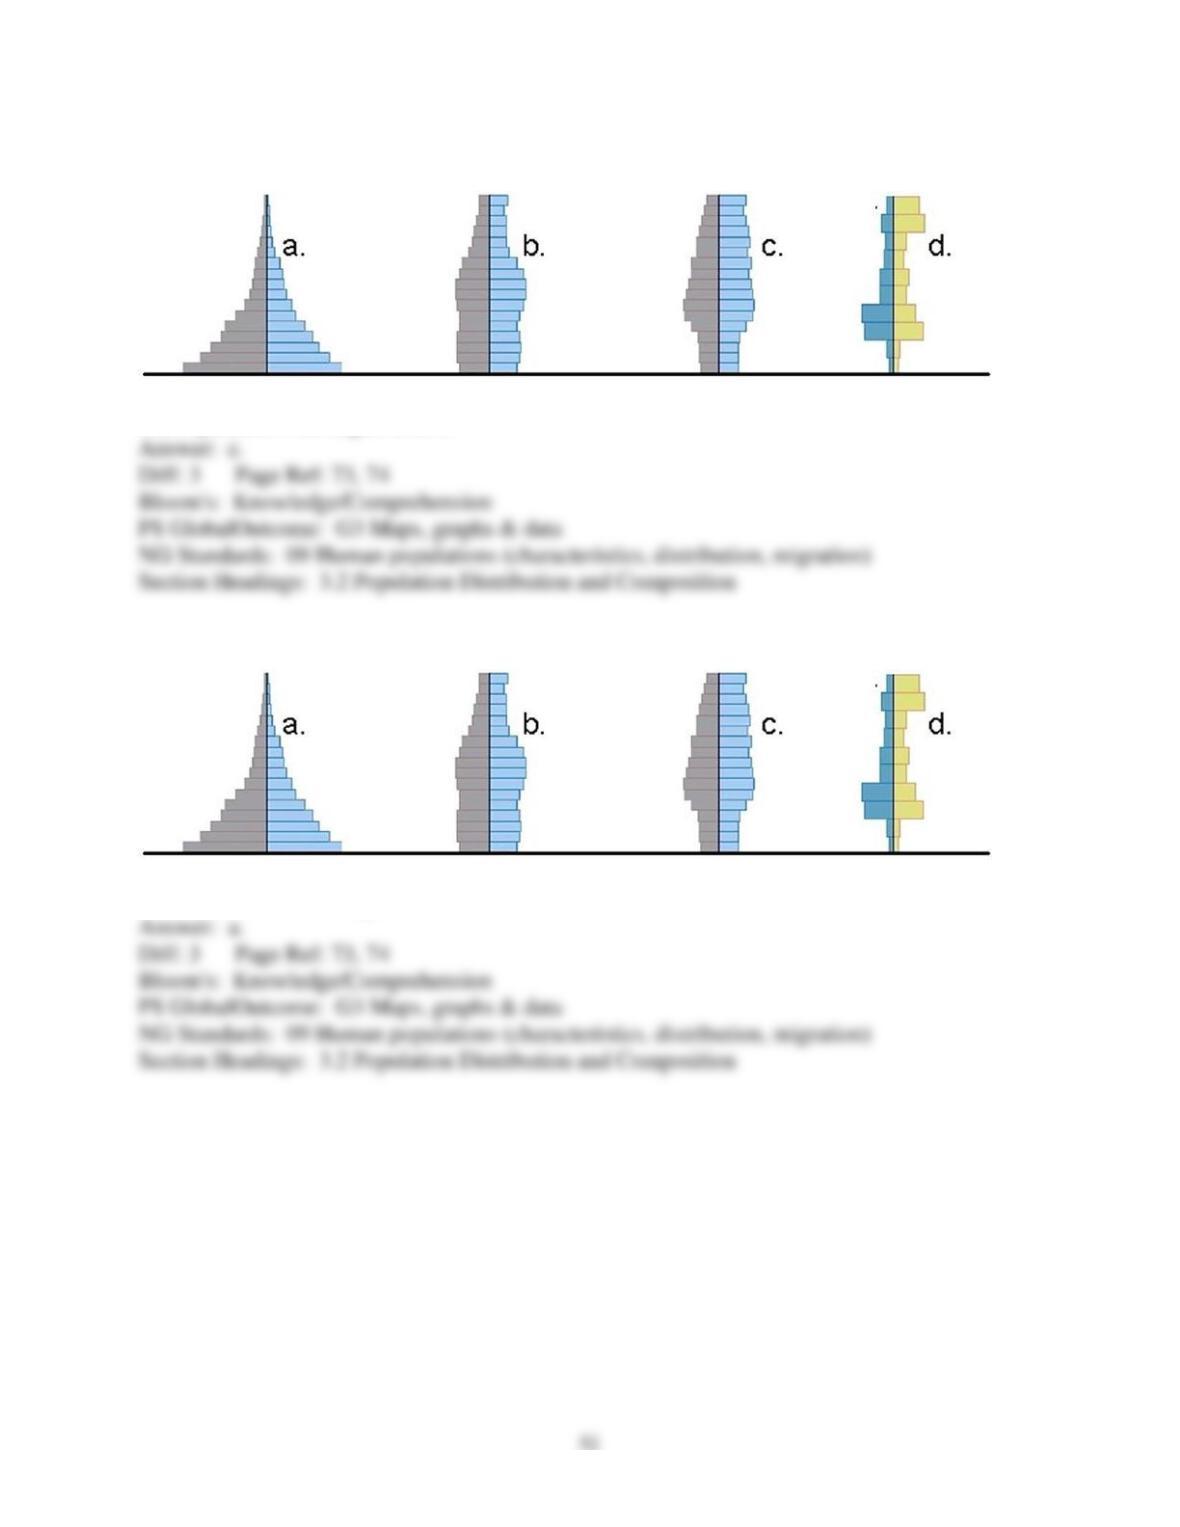
Age-Sex Diagrams: Match diagram to the population it represents.
11) Population with negative RNI
Age-Sex Diagrams: Match diagram to the population it represents.
12) Population with a high RNI