Chapter 3 – Cost Behavior
1. A cost that changes in total as output changes is a variable cost.
a.
True
b.
False
True
2. The cost of raw materials used is usually a fixed cost.
a.
True
b.
False
False
3. Fixed costs are costs that in total remain constant within the relevant range as the level of output increases or decreases.
a.
True
b.
False
True
4. As output decreases fixed costs per unit will increase.
a.
True
b.
False
True
5. As output increases variable cost per unit will also increase.
a.
True
b.
False
False
6. The cost of advertising is usually a discretionary fixed cost.
a.
True
b.
False
True
7. A discretionary fixed cost can be changed relatively easily at management discretion.
a.
True
b.
False
True
8. The relevant range is the range of output within which the assumed cost relationship is valid for the normal operations
of the firm.
a.
True
b.
False
True
9. Determining cost behavior is not essential to planning, controlling, and decision making.
a.
True
b.
False
False
Chapter 3 – Cost Behavior
10. A variable cost increases in total when output increases but the per-unit costs remains the same.
a.
True
b.
False
True
11. Cost relationships may change at output levels outside of the relevant range.
a.
True
b.
False
True
12. Computing unit fixed costs may result in misleading information.
a.
True
b.
False
True
13. Discretionary fixed costs often involve a long-term contract.
a.
True
b.
False
False
Discretionary fixed costs can be changed at management’s discretion.
14. Total variable costs = Variable rate × amount of output.
a.
True
b.
False
True
15. A driver is a factor that causes or leads to a change in a cost.
a.
True
b.
False
True
16. Mixed costs have both a fixed and a variable component.
a.
True
b.
False
True
17. Managerial judgment is critically important in determining cost behavior.
a.
True
b.
False
True
18. The high-low method is an objective method to separate the cost behavior of a mixed cost.
a.
True
b.
False
Determining cost behavior is essential to planning, controlling, and decision making.
Chapter 3 – Cost Behavior
True
19. “Outliers” are points that seem to fit the general pattern of behavior.
a.
True
b.
False
False
“Outliers” are points that do not seem to fit the general pattern of behavior.
20. The slope of a mixed cost line is equal to the fixed element of the cost.
a.
True
b.
False
False
21. Using the high-low method, the calculation of the cost line uses the highest and lowest activity period.
a.
True
b.
False
True
22. Calculation of the cost line using the high-low method tests the lowest cost period to see if it is an outlier.
a.
True
b.
False
False
23. Using a linear regression program, the term ‘Intercept’ refers to the variable cost.
a.
True
b.
False
False
Using a regression program, the term ‘Intercept’ refers to the fixed cost.
24. Using a regression program, the term ‘X Variable 1′ refers to the dependent variable.
a.
True
b.
False
False
25. Using regression, the value of ‘X Variable 1′ equals the slope of the line.
a.
True
b.
False
True
26. The ________________ is the range of output over which the assumed cost relationship is valid for the normal
operations of a firm.
27. A cost __________ is a casual factor that measures the output of the activity that leads costs to change.
driver
28. __________________ is the general term for describing whether a cost changes when the level of output changes.
Chapter 3 – Cost Behavior
29. The fabric used to manufacture curtains is an example of a material or a ____________ cost.
30. Depreciation on factory equipment would be an example of a(n) _________ cost.
31. A type of cost behavior where the true total cost function is increasing at a decreasing rate is called ______________.
32. Rental expense for a warehouse is an example of a ___________ cost.
33. Fixed costs that cannot be easily changed and typically involve a long-term contract are known as
___________________.
34. A fixed cost that management can easily decide to increase or decrease is known as a _________________.
35. ___________________ are costs that in total vary in direct proportion to changes in output within the relevant range.
36. A _______________ displays a constant level of cost for a range of output and then jumps to a higher level of cost at
some point.
37. _______________________ are costs that have both a fixed and a variable component.
38. ______________________________ is a statistical way to find the best-fitting line through a set of data points.
39. __________________________ is critically important in determining cost behavior and is by far the most widely used
method in practice.
40. The _________________________ is a way to see the cost relationship by plotting the data points on a graph.
41. The ________________________ is a variable whose value depends on the value of another variable.
42. Graphically, the ______________ is the point at which the cost line intercepts the cost (vertical) axis.
43. An advantage of the high-low method is that it ___________.
Chapter 3 – Cost Behavior
44. The percentage of variability in the dependent variable explained by an independent variable is called the
____________________________________.
45. The spreadsheet regression program supplies more than the estimates of the coefficients; it also provides information
that can be used to see how ________ the cost equation is which is a feature not available for the high-low method.
46. Knowing how costs change as output changes is essential to
a.
planning and controlling.
b.
controlling and decision making.
c.
planning, controlling and decision making.
d.
None of these are correct.
47. A fixed cost within the relevant range
a.
increases in total as output decreases.
b.
does not change in total as output changes.
c.
decreases in total as output increases.
d.
All of these are correct.
48. Which of the following would be an example of a fixed cost?
a.
wages for an assembly line worker
b.
electric bill
c.
depreciation on equipment
d.
materials used
49. Which of the following would not be an example of a fixed cost?
a.
glue used to put together tables
b.
insurance on factory building
c.
depreciation on factory building
d.
property taxes
50. Discretionary fixed costs
a.
cannot be easily changed.
b.
often involve a long-term contract.
c.
can be changed easily at management’s discretion.
d.
increase as output increases.
Chapter 3 – Cost Behavior
51. Which of the following is an example of a discretionary fixed cost?
a.
depreciation of equipment
b.
advertising costs
c.
rental of machinery
d.
insurance on automobiles
52. Which of the following is not an example of a discretionary fixed cost?
a.
research and development
b.
training costs
c.
advertising costs
d.
direct materials
53. A committed fixed cost
a.
can easily be changed.
b.
often involves a long-term contract.
c.
changes when the level of output changes.
d.
all of these are correct
54. Variable costs within the relevant range
a.
stay constant on a per unit basis as output changes.
b.
increase in total as output increases.
c.
decrease in total as output decreases.
d.
All of these are correct.
55. Which of the following would be a variable cost for a dentist’s office?
a.
depreciation on equipment
b.
cost of renting office space
c.
cost of teeth cleaning material
d.
salary of dentist
56. Total variable costs
a.
increases as output increases.
b.
decreases as output decreases.
c.
equal a variable rate × amount of output.
d.
all of these are correct.
57. A factor that causes or leads to a change in a cost or activity is a(n)
a.
cost formula.
b.
step cost.
Chapter 3 – Cost Behavior
c.
mixed cost.
d.
driver.
58. Which of the following would probably be a fixed cost in a fast-food restaurant?
a.
cost of hamburger
b.
cost of french fries
c.
shift manager’s salary
d.
utility cost
c
59. Which of the following would probably be a variable cost at a college?
a.
salary of the head janitor
b.
cost of registration forms
c.
salary of the college president
d.
none of these options
60. The relevant range
a.
is the normal range of output.
b.
is the range of output where cost relationships are valid.
c.
may change from period to period.
d.
All of these are correct.
61. Per-unit fixed costs
a.
can be misleading and lead to poor decisions.
b.
stay the same as output changes.
c.
decrease as output decreases.
d.
increase as output increases.
a
62. Which of the following would probably be a discretionary fixed cost for a law firm?
a.
salary of receptionist
b.
advertising
c.
depreciation on furniture and equipment
d.
cost of legal forms
63. Which of the following would probably be a committed fixed cost for an accounting firm?
a.
lease of computers
b.
rent on the office building
c.
property taxes on building
d.
All of these are correct.
Chapter 3 – Cost Behavior
64. Per-unit variable costs
a.
can be misleading and lead to poor decisions.
b.
increase as output increases.
c.
decrease as output decreases.
d.
remain constant within the relevant range.
65. If output increases
a.
per-unit fixed cost will increase.
b.
total variable costs will increase.
c.
per-unit variable costs will increase.
d.
per-unit variable costs will decrease.
66. If output decreases
a.
total fixed costs will remain the same.
b.
total variable costs will increase.
c.
per-unit fixed costs will decrease.
d.
All of these are correct.
a
67. If output increases by 50% and is still within the relevant range
a.
total fixed costs will increase by 50%.
b.
per-unit fixed cost will remain the same.
c.
total variable costs will increase by 50%.
d.
net income will increase by 50%.
c
68. Refer to Figure 3-2. The cost behavior of the materials cost is
a.
fixed
b.
variable
c.
committed
d.
discretionary
69. Refer to Figure 3-2. What is the materials cost per unit of output?
a.
$0.10
b.
$0.20
Chapter 3 – Cost Behavior
c.
$0.60
d.
$0.40
SUPPORTING CALCULATIONS: $20,000 / 100,000 = $0.20
70. Refer to Figure 3-2. What should the total materials cost be at a production level of 220,000 toys?
a.
$44,000
b.
$88,000
c.
$22,000
d.
$132,000
SUPPORTING CALCULATIONS: 220,000 × $0.20
Figure 3-6.
Taran Company incurred the following costs for the months of January and February.
Type of Cost
January
February
Insurance
$ 5,000
$ 5,000
Utilities
4,000
5,000
Depreciation
3,500
3,500
Materials
10,000
20,000
71. Refer to Figure 3-6. From the information above we can assume that
a.
insurance and depreciation are fixed costs.
b.
output decreased from January to February.
c.
output stayed the same from January to February.
d.
insurance is a mixed cost.
a
72. Refer to Figure 3-6. Assume that output was 5,000 units in January and 10,000 units in February, utility cost is a
mixed cost, and the fixed cost of utilities was $3,000. What was the variable rate per unit of output for utilities cost?
a.
$0.60
b.
$0.40
c.
$0.20
d.
$0.30
73. Refer to Figure 3-6. If output was 5,000 units in January and 10,000 units in February we can assume that
a.
utilities and materials are variable costs.
b.
utilities, insurance, and depreciation are fixed costs.
c.
insurance and depreciation are mixed costs.
d.
materials are the only variable cost.
Chapter 3 – Cost Behavior
74. The range of output over which the assumed cost relationship is valid for normal operations of a firm is called the
a.
mixed range.
b.
relevant range.
c.
linear range.
d.
dependent range.
75. Cost behavior analysis focuses on
a.
how costs react to increases in activity levels only.
b.
how costs will change in the future.
c.
how costs react to changes in activity level.
d.
None of these are correct.
c
76. Fixed cost per unit is $9 when 20,000 units are produced and $6 when 30,000 units are produced.
What is the total fixed cost when nothing is produced?
a.
$180,000
b.
$360,000
c.
$150,000
d.
$240,000
77. If production volume increases from 8,000 to 10,000 units,
a.
total costs will increase by 20%.
b.
total costs will increase by 25%.
c.
total variable costs will increase by 25%.
d.
mixed and variable costs will increase by 25%.
c
78. When the volume of activity increases within the relevant range, the fixed cost per unit
a.
decreases.
b.
increases at first, then decreases.
c.
remains the same.
d.
increase.
a
79. The cost formula for monthly depreciation cost in a factory is
Total cost = $10,000
This cost is
a.
strictly variable.
b.
strictly fixed.
c.
a mixed cost.
Chapter 3 – Cost Behavior
d.
a step cost.
80. A mixed cost
a.
remains constant when the output level increases.
b.
cannot be separated.
c.
contains both a fixed and variable component.
d.
All of these are correct.
81. When a mixed cost is graphed the Y-intercept corresponds to the
a.
step cost.
b.
variable rate.
c.
fixed cost.
d.
price of the units sold.
82. When a mixed cost is graphed the slope of the line equals
a.
the variable cost per unit of the activity driver.
b.
the total variable cost.
c.
the sales price per unit.
d.
the total fixed cost.
83. Step costs
a.
remain the same within the relevant range.
b.
have an increased fixed component at specified intervals.
c.
increase in direct proportion to increases in output.
d.
None of these are correct.
84. The formula for a mixed cost is
a.
total cost = total variable cost + ( fixed rate × amount of output).
b.
total cost = total fixed cost + (variable rate × amount of output).
c.
total cost = variable rate × amount of output.
d.
None of these are correct.
85. Which of the following would probably be a mixed cost?
a.
rent on building
b.
raw materials
c.
repairs and maintenance
d.
depreciation
Chapter 3 – Cost Behavior
86. A mixed cost
a.
will vary in direct proportion to changes in output.
b.
stays the same regardless of output.
c.
has the same cost behavior as a step cost.
d.
will decrease in total when output decreases.
87. If a cost’s step-cost behavior follows very narrow steps, the costs may be approximated using:
a.
straight variable cost assumptions.
b.
fixed costs assumptions.
c.
step-fixed cost assumptions.
d.
mixed cost assumptions.
a
Figure 3-1.
Total cost = Fixed cost + (Variable Rate × Output)
88. Refer to Figure 3-1. In the cost formula above which element would be the dependent variable?
a.
variable rate
b.
fixed cost
c.
total cost
d.
output
c
89. Refer to Figure 3-1. In the cost formula above which element would be the independent variable?
a.
fixed cost
b.
total cost
c.
output
d.
variable rate
c
90. Refer to Figure 3-1. In the cost formula above which element would be the intercept?
a.
fixed cost
b.
total cost
c.
output
d.
variable rate
a
91. Refer to Figure 3-1. In the cost formula above which element would be the slope?
a.
variable rate
b.
output
c.
fixed cost
d.
total cost
a
92. The high-low method
Chapter 3 – Cost Behavior
a.
is the most accurate methods.
b.
is not affected by the presence of outliers.
c.
has the advantage of objectivity.
d.
has the advantage of subjectivity.
93. The scatter-graph method
a.
displays a constant level of cost for a range of output.
b.
has the advantage of subjectivity.
c.
may reveal the presence of outliers.
d.
all of these are correct
94. The method of least squares
a.
is a way to find the “best fitting” line through a set of data points.
b.
is a statistical way of separating a mixed cost.
c.
always produces the same cost formula when used on the same data set.
d.
all of these are correct
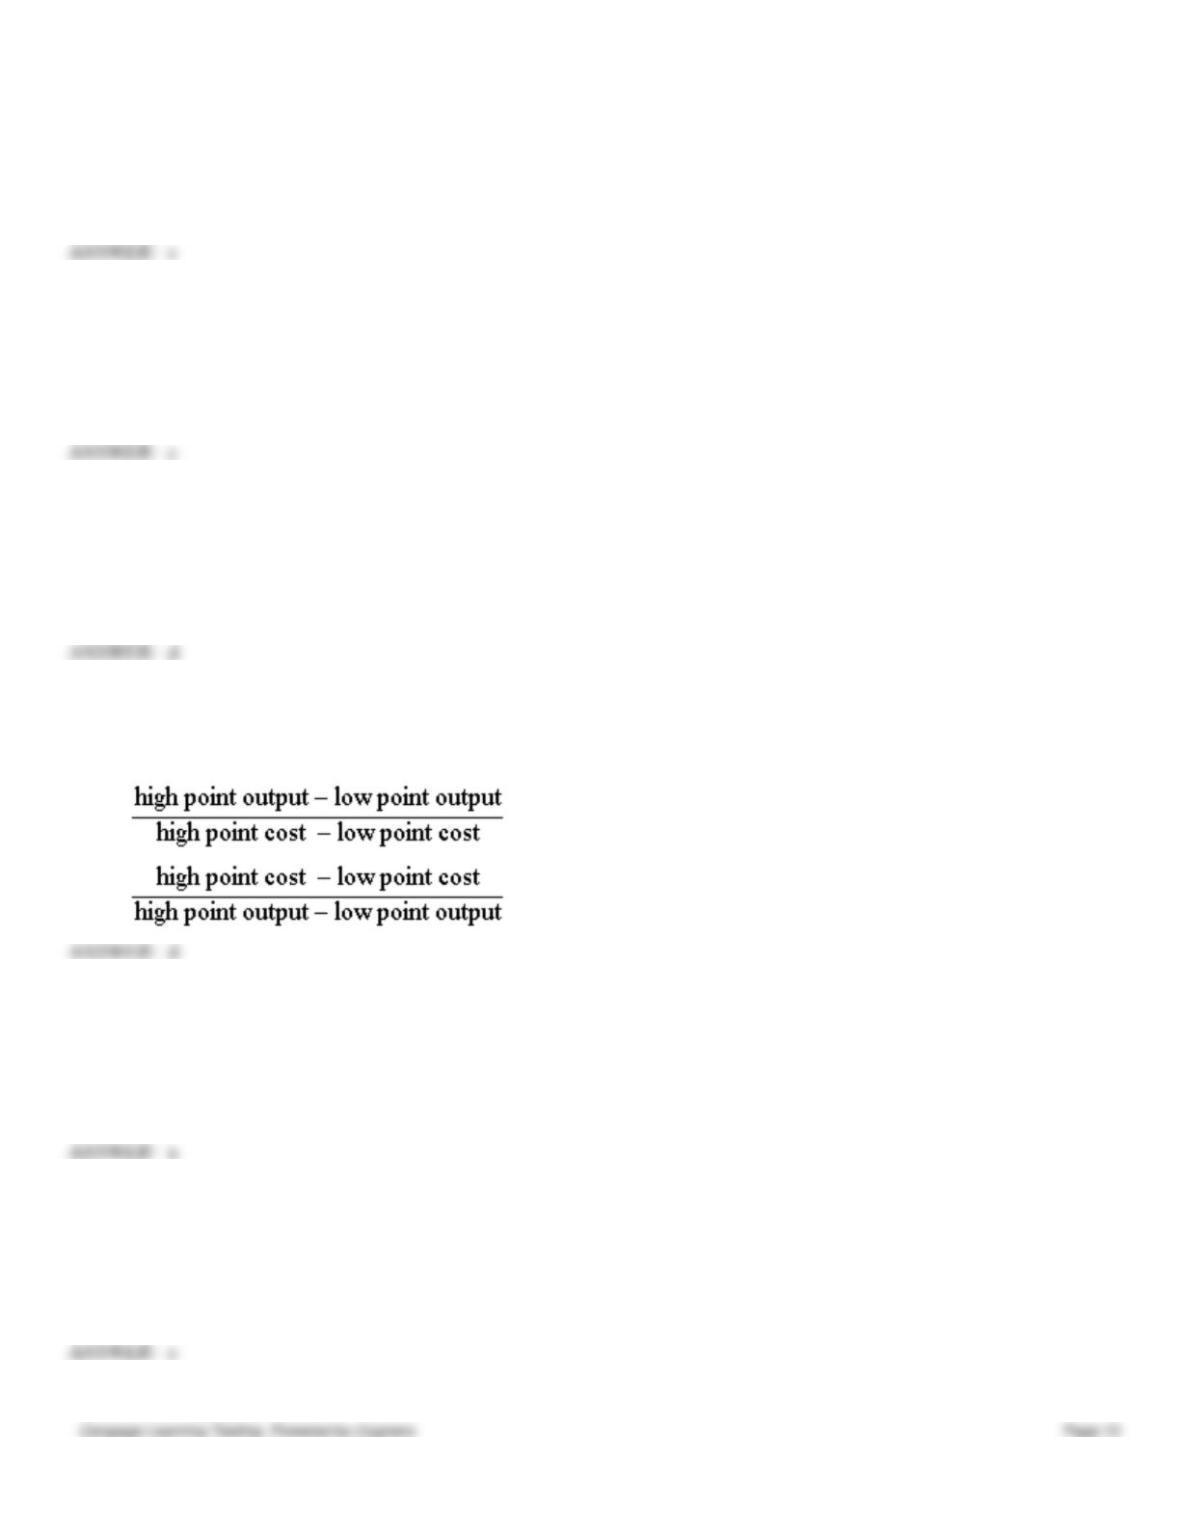
95. Using the high-low method, the variable rate of a mixed cost equals
a.
total cost at high point − (variable rate × output at high point)
b.
total cost at high point − (variable rate × output at low point)
c.
d.
96. The method of least squares
a.
uses the results of regression analysis to construct a cost formula.
b.
is the least accurate method.
c.
analyzes a cost relationship by plotting the data points on a graph.
d.
can easily be calculated by hand.
97. Managerial judgment
a.
is the most accurate way to determine cost behavior.
b.
is the least used method in practice.
c.
is critically important in determining cost behavior.
d.
none of these are correct
98. The scatter-graph method
Chapter 3 – Cost Behavior
a.
allows a cost analyst to inspect data visually.
b.
is objective.
c.
only uses two data points.
d.
none of these are correct
a
99. Ruskin Company had utilities cost of $95,000 at an output level of 30,000 units. The utilities cost was a mixed cost
and the fixed portion was $50,000. What would the estimate of total utilities cost be at an output level of 40,000 units?
a.
$65,000
b.
$95,000
c.
$110,000
d.
$125,000
Figure 3-3.
Okafor Company manufactures skis. The management accountant wants to calculate the fixed and variable costs
associated with the leasing of machinery. Data for the past four months were collected.
Machine
Month
Lease cost
hours
April
$21,000
550
May
16,500
420
June
19,000
510
July
22,230
570
100. Refer to Figure 3-3. Using the high-low method calculate the variable rate for the lease cost
a.
$38.18
b.
$38.20
c.
$61.50
d.
$37.25
101. Refer to Figure 3-3. Using the high-low method calculate the fixed cost of leasing
a.
$482
b.
$516
c.
$420
d.
$456
Chapter 3 – Cost Behavior
102. Refer to Figure 3-3. What would Okafor Company‘s cost formula be to estimate the cost of leasing within the
relevant range?
a.
total lease cost = $456 + ($38.20 × machine hours)
b.
total lease cost = $516 + ($38.18 × machine hours)
c.
total lease cost = $420 + ($37.25 × machine hours)
d.
none of these are correct
a
103. Refer to Figure 3-3. What would the estimate of Okafor Company’s total lease cost be at a level of 500 machine
hours?
a.
$19,606
b.
$19,556
c.
$16,464
d.
$18,546
SUPPORTING CALCULATIONS: $19,556 = $456 + ($38.20 × 500)
Figure 3-4.
Botana Company constructed the following formula for monthly utility cost.
Total utility cost = $1,200 + ($8.10 × labor hours)
Assume that 775 labor hours are budgeted for the month of April.
104. Refer to Figure 3-4. Calculate the total variable utility cost for the month of April.
a.
$1,200.00
b.
$7,477.50
c.
$6,277.50
d.
$5,077.50
SUPPORTING CALCULATIONS: ($8.10 × 775)
105. Refer to Figure 3-4. Calculate the total utility cost for the month of April.
a.
$7,477.50
b.
$6,277.50
c.
$1,200.00
d.
$5,077.50
SUPPORTING CALCULATIONS: $7,477.50 = $1,200 + ($8.10 × 775)
106. Refer to Figure 3-4. If Botana Company incurs 9,600 labor hours for the year, what would be the estimate of total
utility cost?
a.
$76,560
b.
$78,960
c.
$92,160
d.
none of these are correct
Chapter 3 – Cost Behavior
SUPPORTING CALCULATIONS: ($1,200 × 12) + ($8.10 × 9,600)
Figure 3-5.
Maxwell Company makes treadmills. The company controller wants to calculate the fixed and variable costs associated
with the janitorial costs incurred in the factory. Data for the past four months were collected.
Janitorial
Machine
Month
costs
hours
September
$11,000
575
October
11,400
610
November
10,200
510
December
10,725
550
107. Refer to Figure 3-5. Using the high-low method calculate the fixed cost of the janitorial services
a.
$4,080
b.
$7,320
c.
$6,120
d.
none of these are correct
108. Refer to Figure 3-5. What would Maxwell Company’s estimate of total janitorial cost be at a level of 600 machine
hours?
a.
$11,280
b.
$7,500
c.
$4,080
d.
$6,120
SUPPORTING CALCULATIONS: $4080 + ($12 × 600)
Figure 3-7.
Margola Company produces hand-held calculators. The company controller wanted to calculate the fixed and variable
costs associated with the maintenance cost incurred by the factory. Data for the past four months were collected.
Maintenance
Machine
Month
cost
hours
June
$4,180
328
July
3,956
310
August
4,686
386
September
4,240
352
Coefficients shown by a regression program are:
Intercept
1,150
X Variable 1
9.06
Chapter 3 – Cost Behavior
109. Refer to Figure 3-7. Using the results of regression, calculate the fixed cost of maintenance.
a.
$1,150.00
b.
$978.37
c.
$9.06
d.
None of these are correct.
a
110. Refer to Figure 3-7. Using the results of regression, calculate the variable rate of maintenance cost.
a.
$1,150 per machine hour
b.
$12.74 per machine hour
c.
$9.06 per machine hour
d.
$12.14 per machine hour
c
111. Refer to Figure 3-7. Using the results of regression, the cost formula for maintenance cost was
a.
$1,150 × machine hours
b.
($4,686 − $3,956) / (386 − 310)
c.
$9.06 × machine hours
d.
$1,150 + ($9.06 × machine hours)
112. Refer to Figure 3-7. Using the results of regression, what would be the budgeted cost for maintenance next month
assuming that 340 machine hours are budgeted? (Round to the nearest dollar.)
a.
$4,230
b.
$3,928
c.
$1,150
d.
$2,943
SUPPORTING CALCULATIONS: $1,150 + ($9.06 × 340)
Figure 3-8.
Martin Company makes cell phones. The company controller wanted to calculate the fixed and variable costs associated
with electricity use in the factory. Data for the past four months were collected.
Electricity
Machine
Month
cost
hours
January
$7,560
570
February
8,220
625
March
7,480
546
April
7,186
518
Coefficients shown by a regression program are:
Intercept
2,255
X Variable 1
9.48
113. Refer to Figure 3-8. Using the results of regression, calculate the variable rate of the electricity cost.
a.
$9.67 per machine hour
b.
$9.48 per machine hour
Chapter 3 – Cost Behavior
c.
$2,255 per machine hour
d.
none of these are correct
114. Refer to Figure 3-8. Using the results of regression, calculate the fixed cost of electricity.
a.
$2,255
b.
$9.48
c.
$2,200
d.
None of these are correct.
a
115. Refer to Figure 3-8. Using the results of regression, the cost formula for electricity cost was
a.
$9.48 × machine hours
b.
$2,255 × machine hours
c.
$2,255 + ($9.48 × machine hours)
d.
None of these are correct.
c
116. Refer to Figure 3-8. Using the results of regression, what would be the total budgeted cost for electricity next month
assuming that 615 machine hours are budgeted? (Round to the nearest dollar.)
a.
$2,225
b.
$8,240
c.
$8,085
d.
$4,015
SUPPORTING CALCULATIONS: $2,255 + ($9.48 × 615)
Figure 3-9.
The following cost formula was developed using monthly data for a retail clothing store.
Total cost = $75,620 + ($242 × number of customers)
117. Refer to Figure 3-9. The term $75,620
a.
is the independent variable.
b.
is the dependent variable.
c.
is the intercept.
d.
is the variable rate.
c
118. Refer to Figure 3-9. The term $242
a.
is the independent variable.
b.
is the dependent variable.
c.
is the intercept.
d.
is the variable rate.
Chapter 3 – Cost Behavior
119. Refer to Figure 3-9. The term “number of customers”
a.
is the independent variable.
b.
is the dependent variable.
c.
is the intercept.
d.
is the variable rate.
120. Refer to Figure 3-9. The term “total cost”
a.
is the independent variable.
b.
is the dependent variable.
c.
is the intercept.
d.
is the variable rate.
Figure 3-10.
The following cost formula was developed using the monthly data for an accounting firm.
Total cost = $87,100 + ($210 × number of tax returns)
121. Refer to Figure 3-10. The term $87,100
a.
is the independent variable.
b.
is the dependent variable.
c.
is the intercept.
d.
is the variable rate.
122. Refer to Figure 3-10. The term “number of tax returns”
a.
is the independent variable.
b.
is the dependent variable.
c.
is the intercept.
d.
is the variable rate.
123. Refer to Figure 3-10. The term $210
a.
is the independent variable.
b.
is the dependent variable.
c.
is the intercept.
d.
is the variable rate.
124. Refer to Figure 3-10. The term “total cost”
a.
is the independent variable.
b.
is the dependent variable.
c.
is the intercept.
d.
is the variable rate.
Chapter 3 – Cost Behavior
Figure 3-11.
The following four months of data were collected on utility cost and the number of labor hours in a factory.
Utility
Labor
Month
cost
hours
January
$22,100
3,975
February
24,600
5,430
March
23,500
4,400
April
20,140
3,200
125. Refer to Figure 3-11. Select the correct set of high and low months.
a.
high: February, low: April
b.
high: February, low: March
c.
high: January, low: March
d.
high: January, low: April
a
126. Refer to Figure 3-11. Using the high-low method, compute the variable rate for the utility cost.
a.
$1.02
b.
$2.80
c.
$1.07
d.
$2.00
127. Refer to Figure 3-11. Using the high-low method, compute the fixed cost of electricity.
a.
$13,740
b.
$10,860
c.
$6,400
d.
None of these are correct.
$20,140 − ($2.00 × 3,200) = $13,470
128. Refer to Figure 3-11. What would be the estimate of electricity cost if the factory incurred 4,700 labor hours next
month?
a.
$9,400
b.
$20,260
c.
$23,140
d.
$19,560