Larson_Calculus_10e ch03sec05
MULTIPLE CHOICE
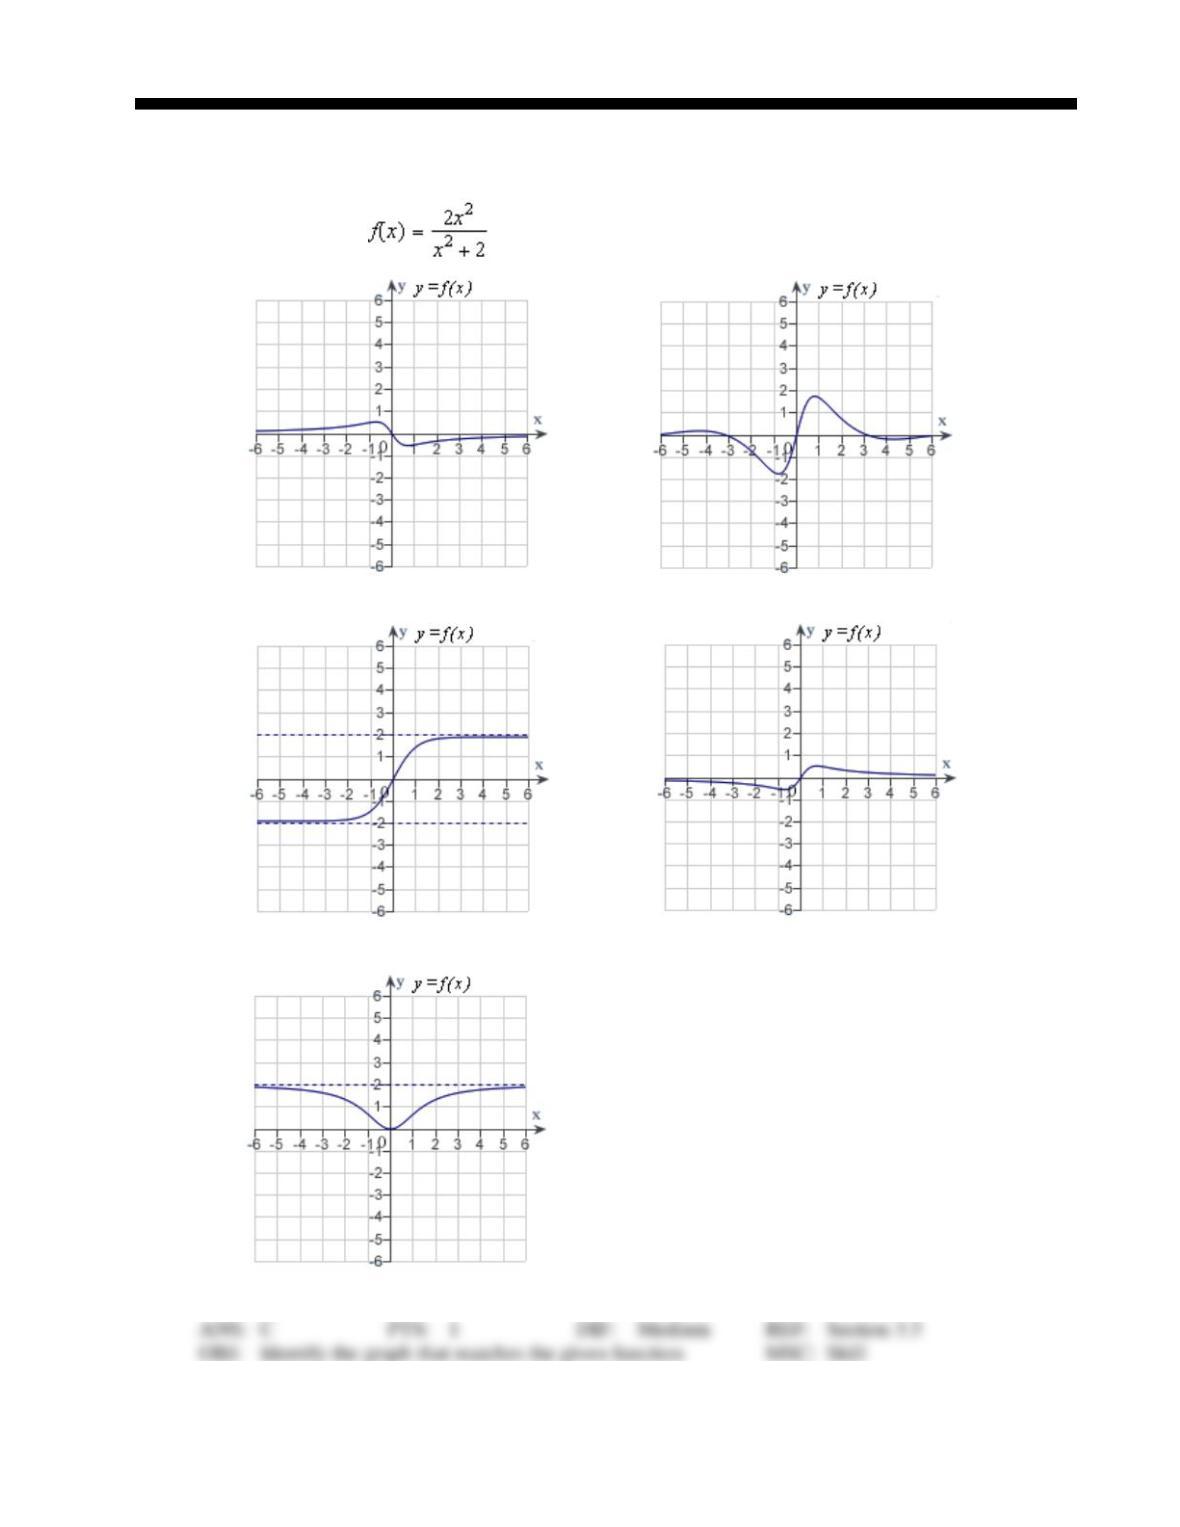
1. Match the function with one of the following graphs.
a.
d.
b.
e.
c.
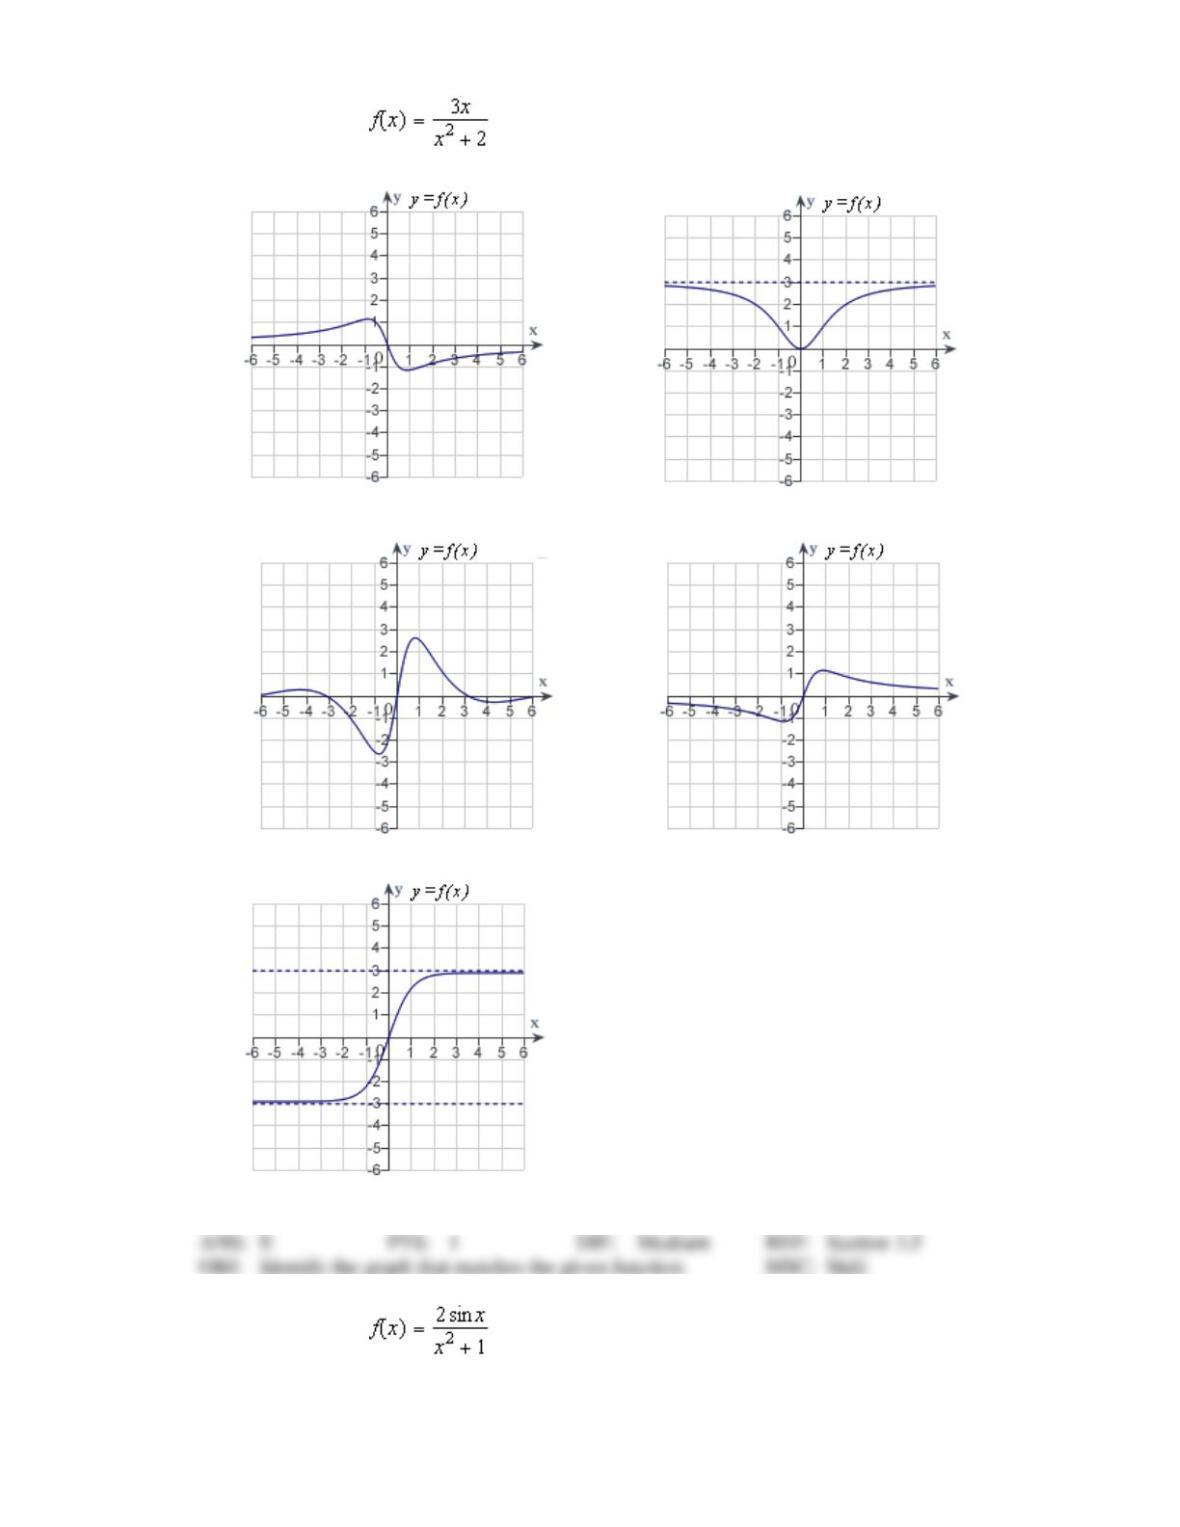
2. Match the function with one of the following graphs.
a.
d.
b.
e.
c.
3. Match the function with one of the following graphs.
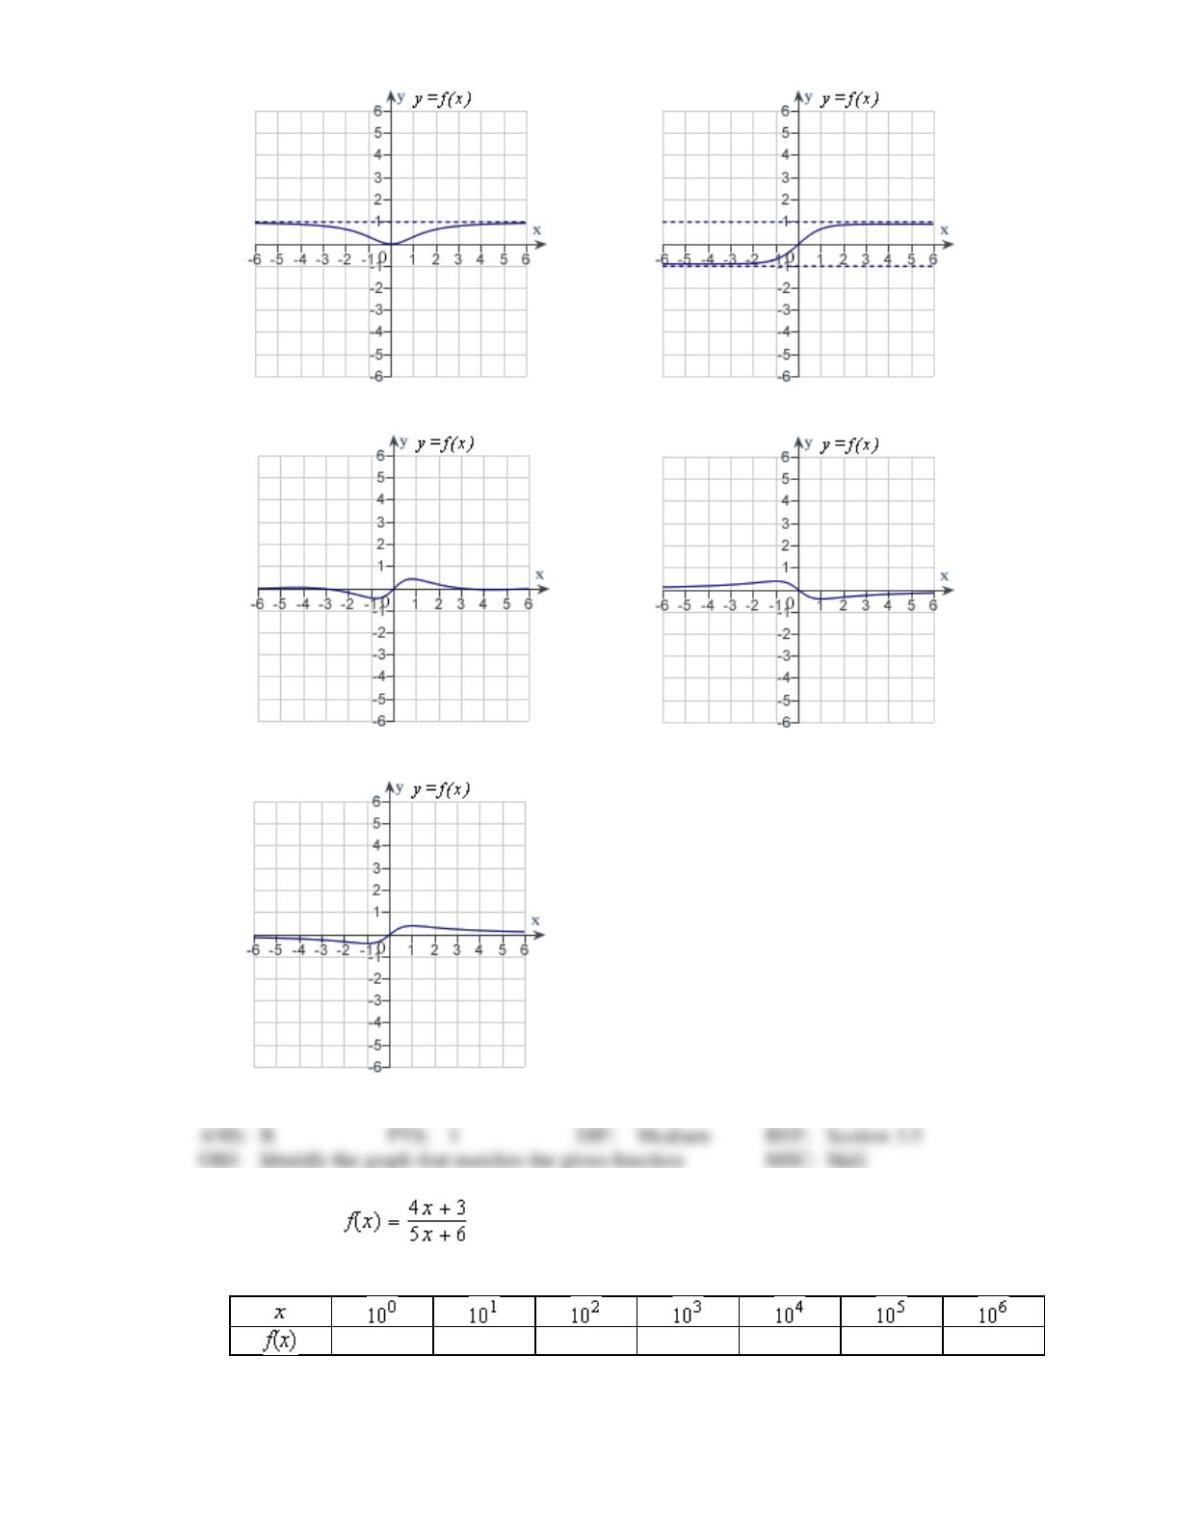
a.
d.
b.
e.
c.
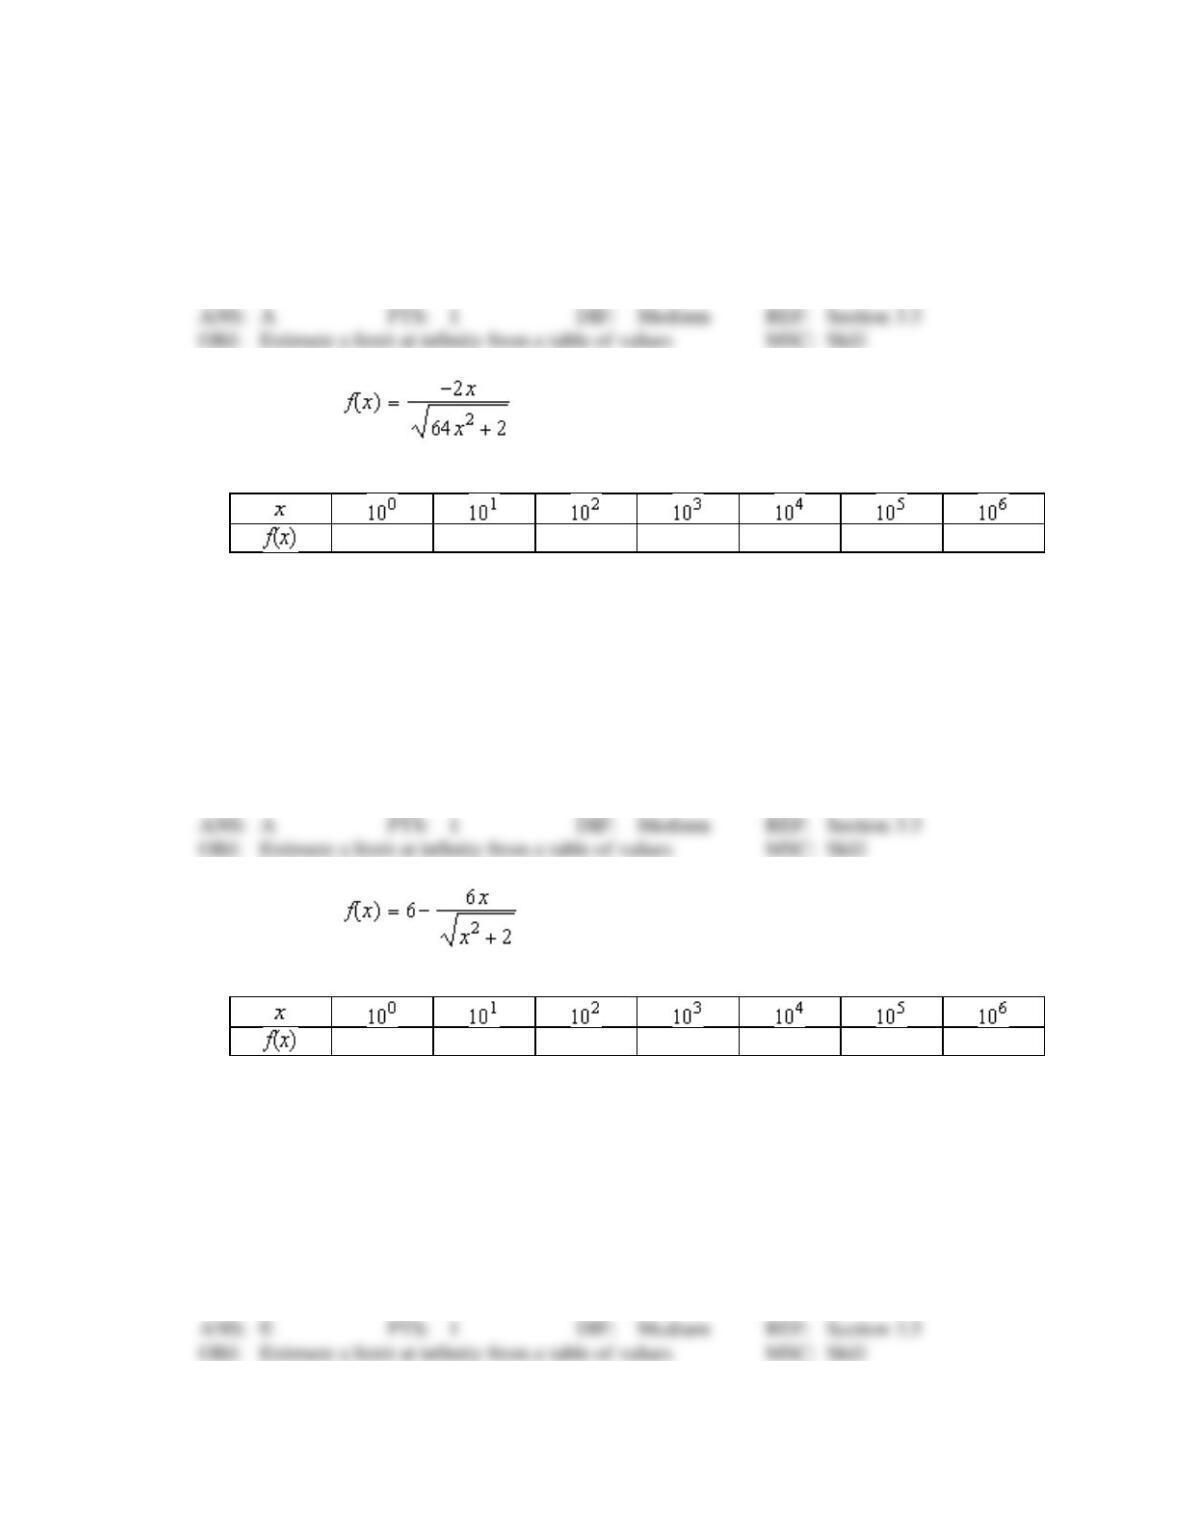
4. For the function , use a graphing utility to complete the table and estimate the limit as x
approaches infinity.
a.
0.8000
b.
1.8000
c.
1.2500
d.
2.2500
e.
0.2500
5. For the function , use a graphing utility to complete the table and estimate the
limit as x approaches infinity.
a.
–0.2500
b.
1.0000
c.
2.1800
d.
–0.9000
e.
does not exist
6. For the function , use a graphing utility to complete the table and estimate the
limit as x approaches infinity.
a.
–6
b.
2
c.
6
d.
0
e.
None of the above
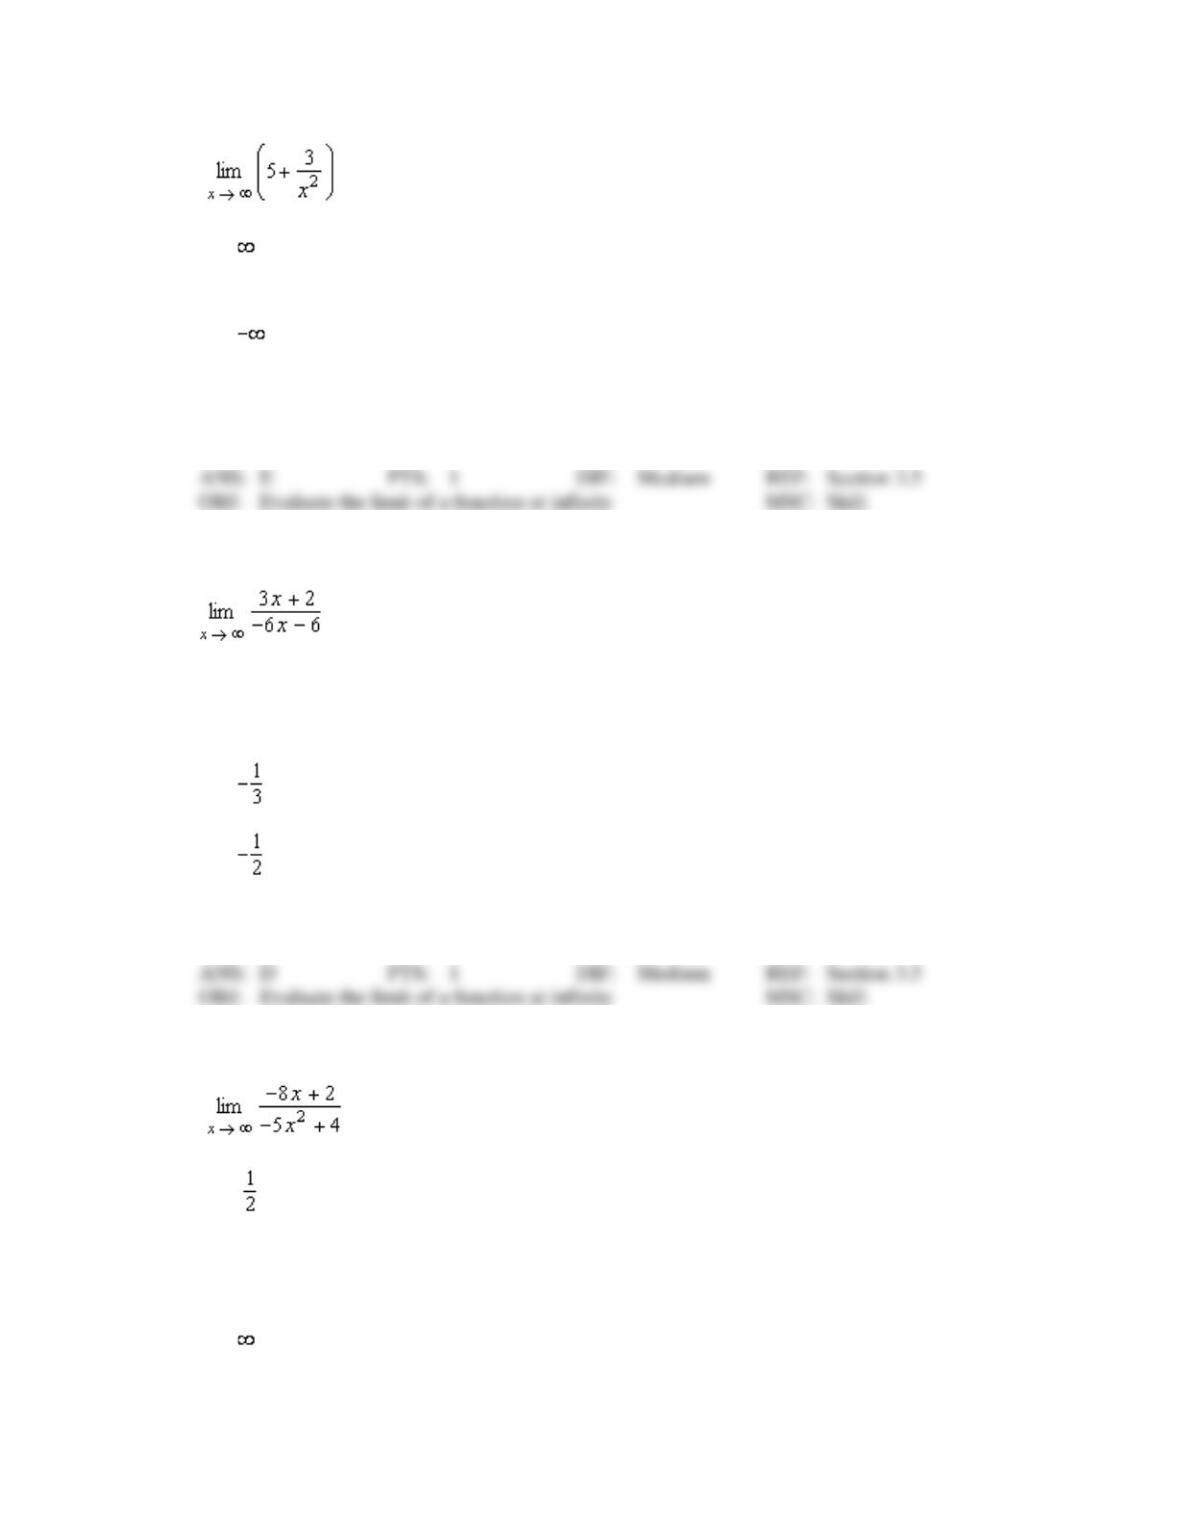
7. Find the limit.
a.
b.
3
c.
d.
–3
e.
5
8. Find the limit.
a.
1
b.
0
c.
d.
e.
does not exist
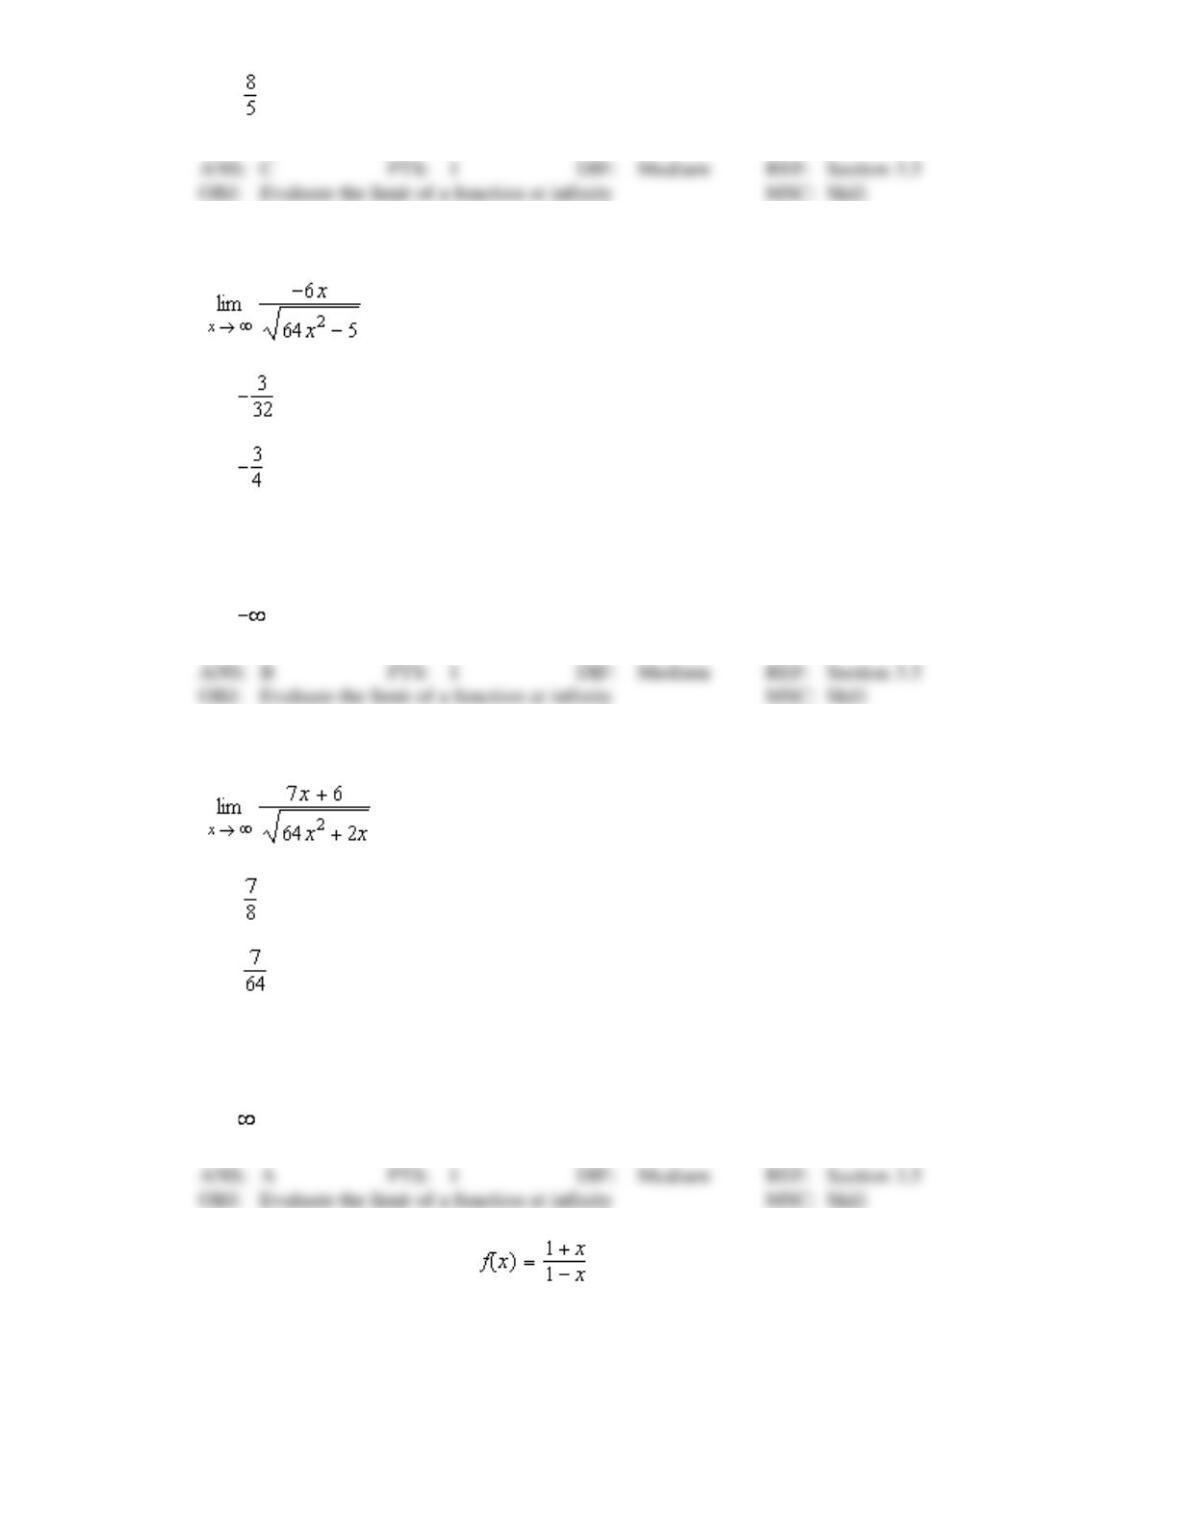
9. Find the limit.
a.
b.
1
c.
0
d.
e.
10. Find the limit.
a.
b.
c.
1
d.
–6
e.
11. Find the limit.
a.
b.
c.
1
d.
7
e.
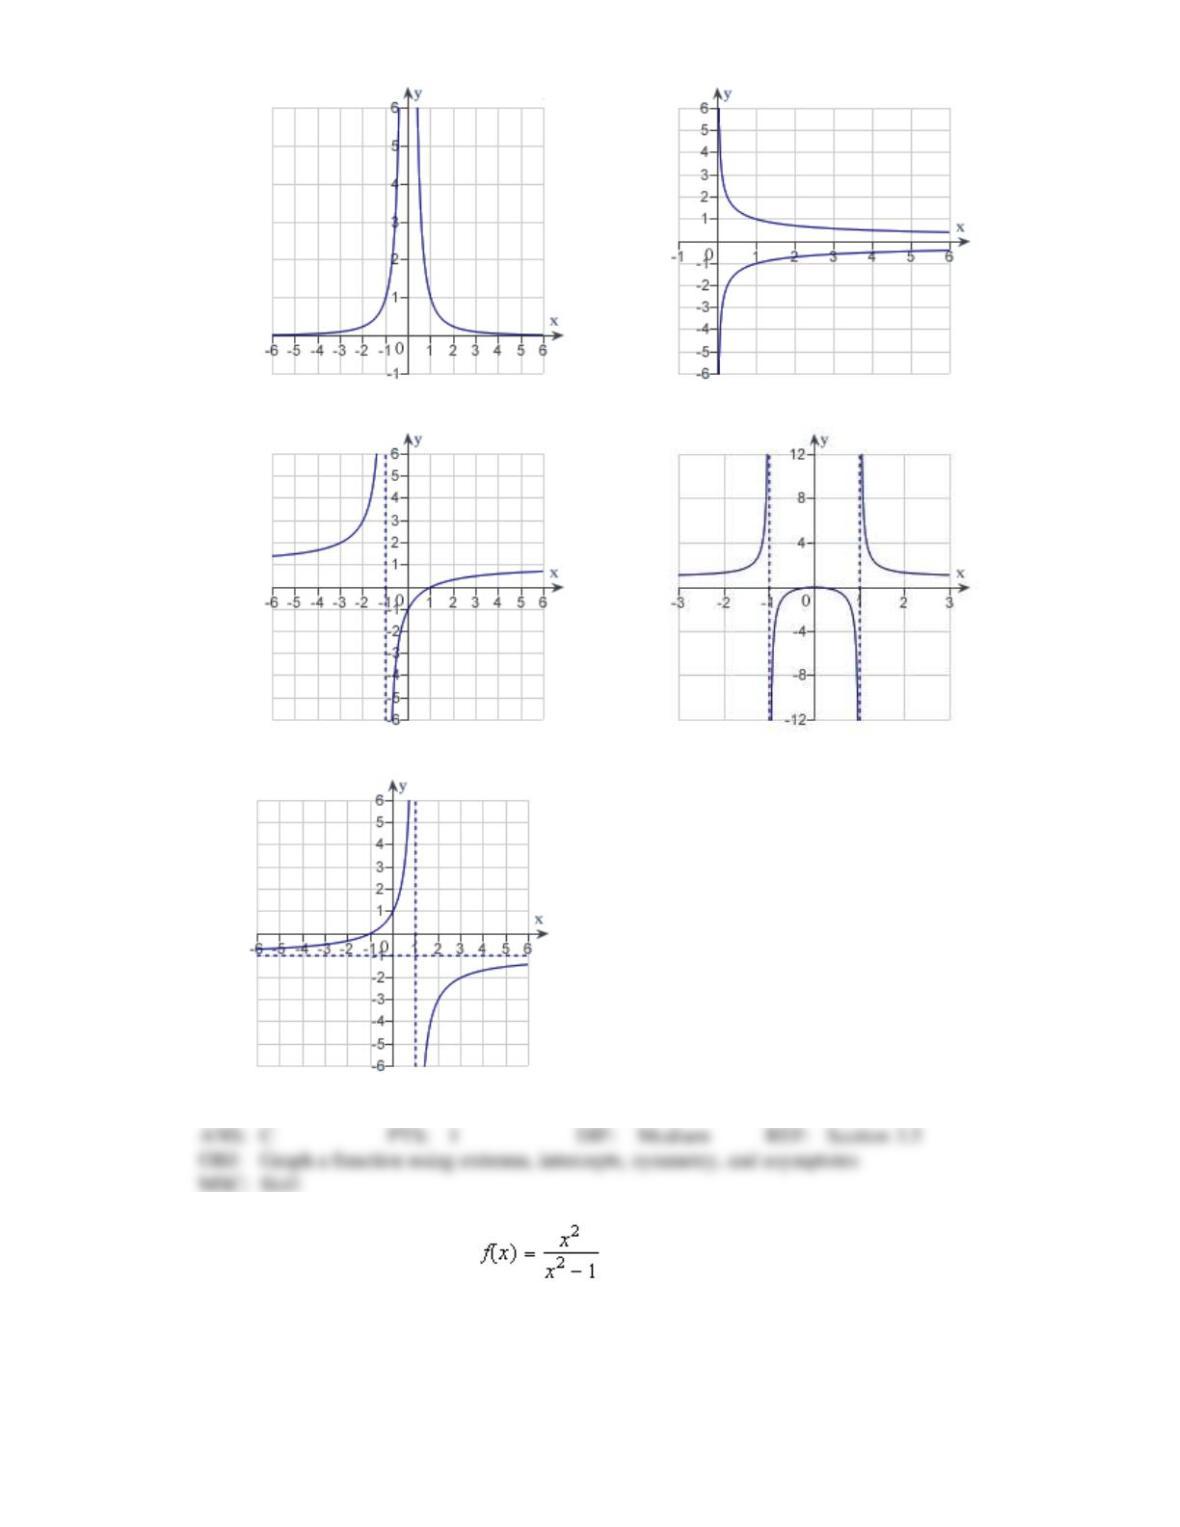
12. Sketch the graph of the function using any extrema, intercepts, symmetry, and
asymptotes.
a.
d.
b.
e.
c.
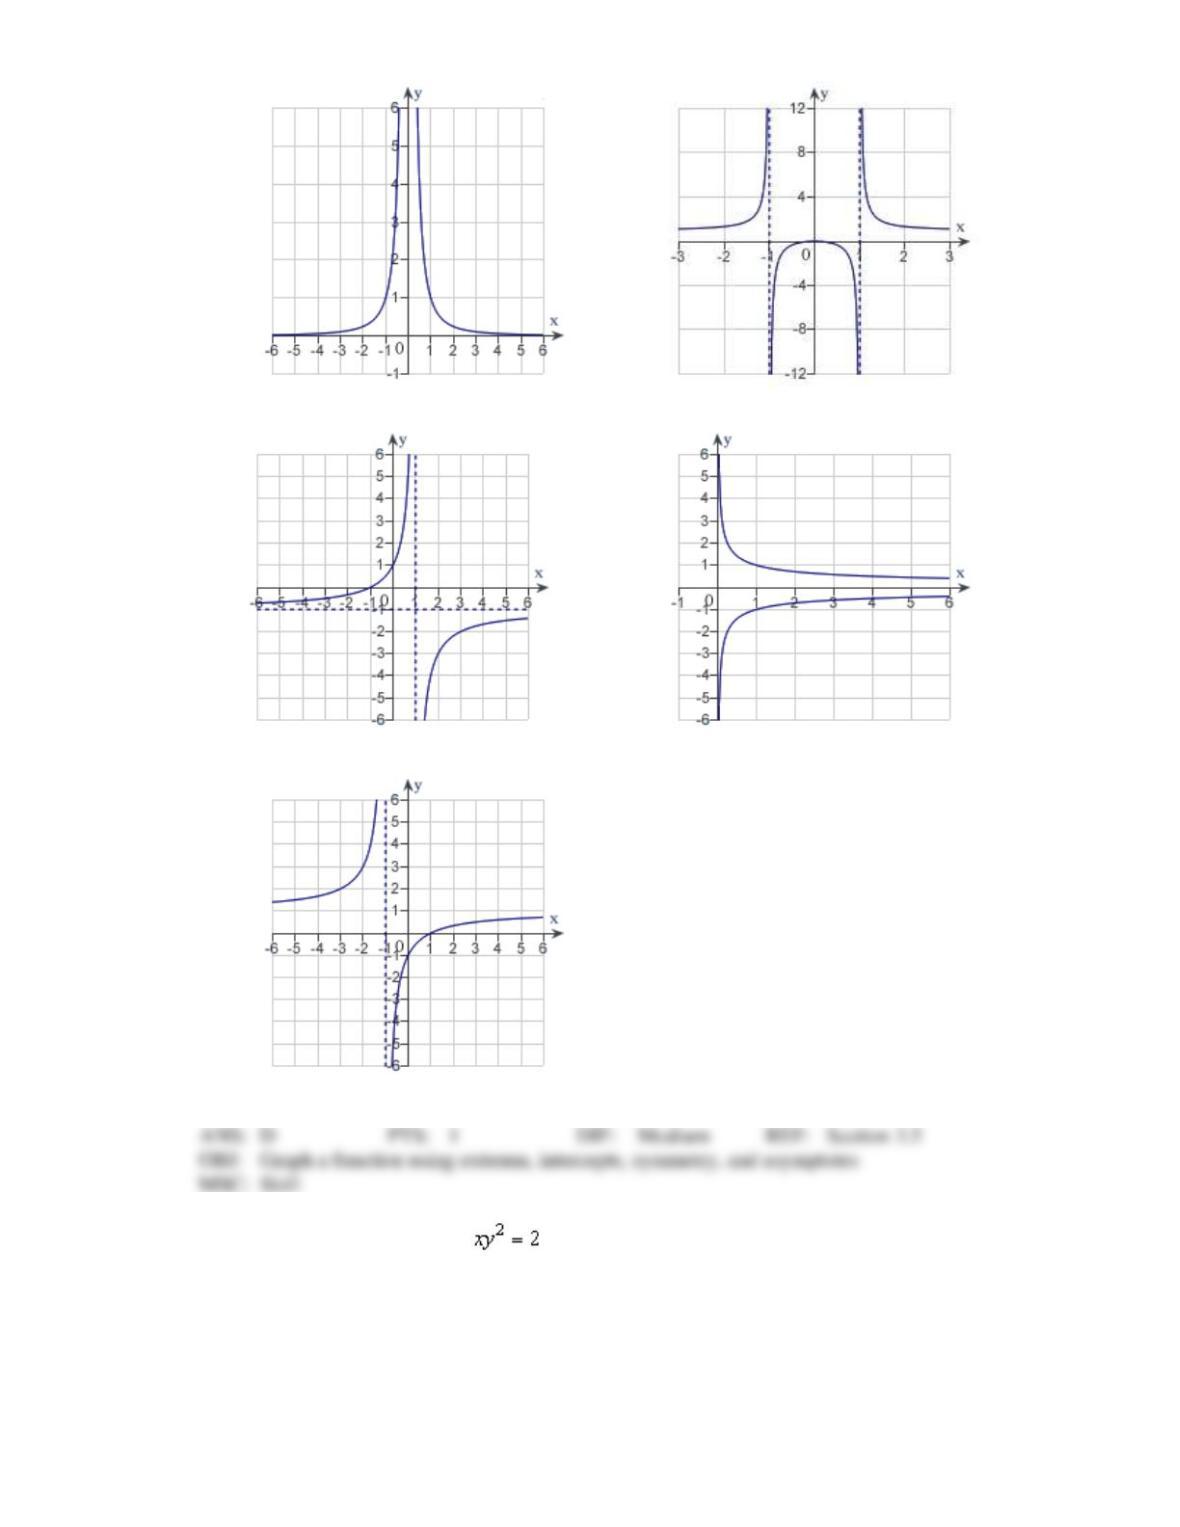
13. Sketch the graph of the function using any extrema, intercepts, symmetry, and
asymptotes.
a.
d.
b.
e.
c.
14. Sketch the graph of the relation using any extrema, intercepts, symmetry, and asymptotes.
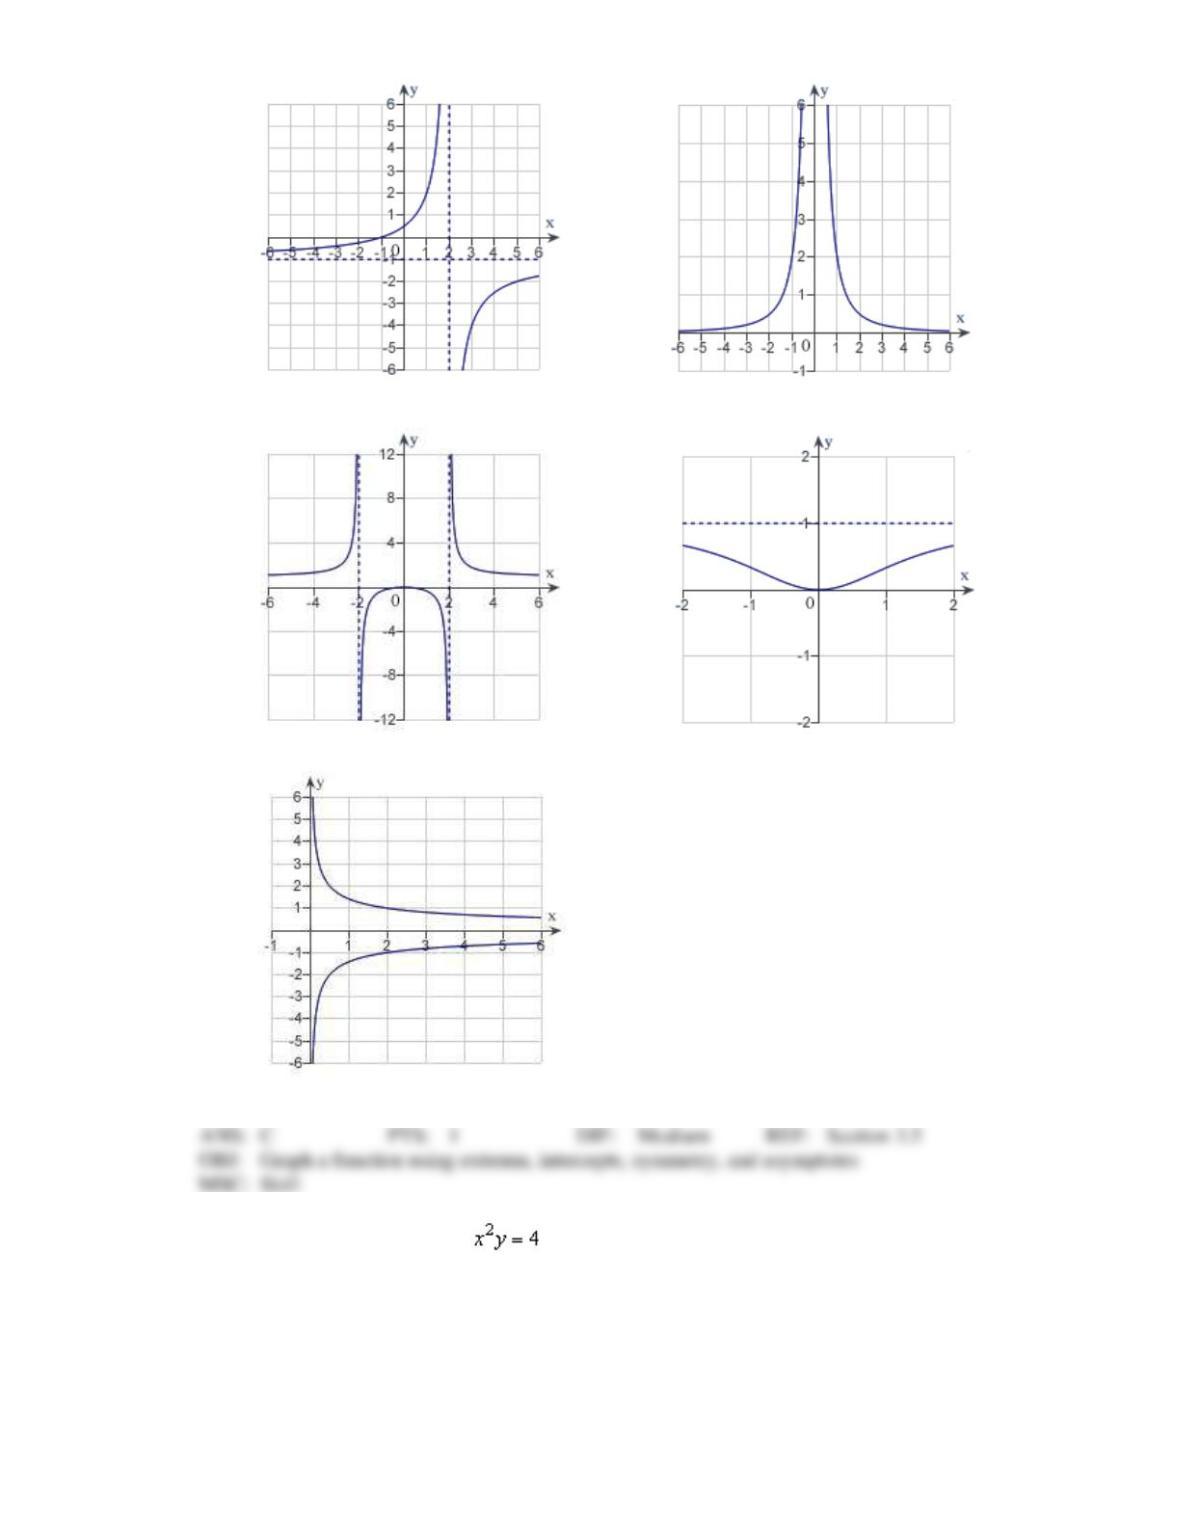
a.
d.
b.
e.
c.
15. Sketch the graph of the relation using any extrema, intercepts, symmetry, and asymptotes.
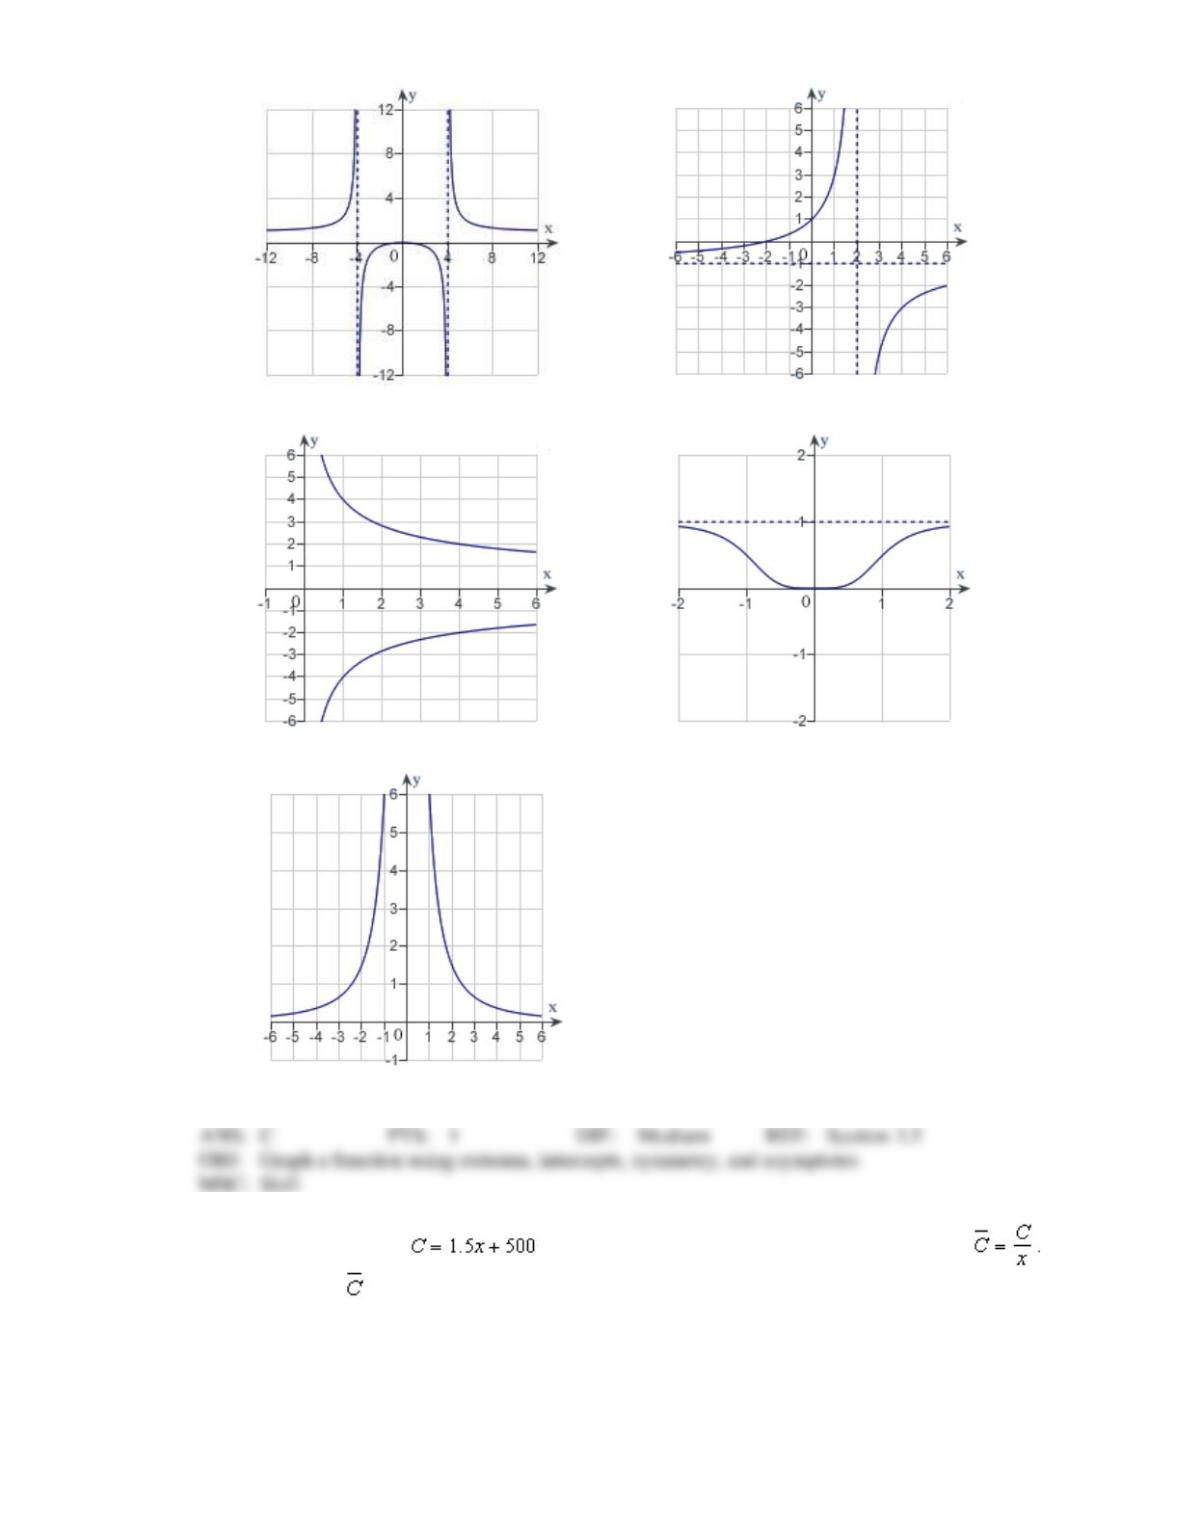
a.
d.
b.
e.
c.
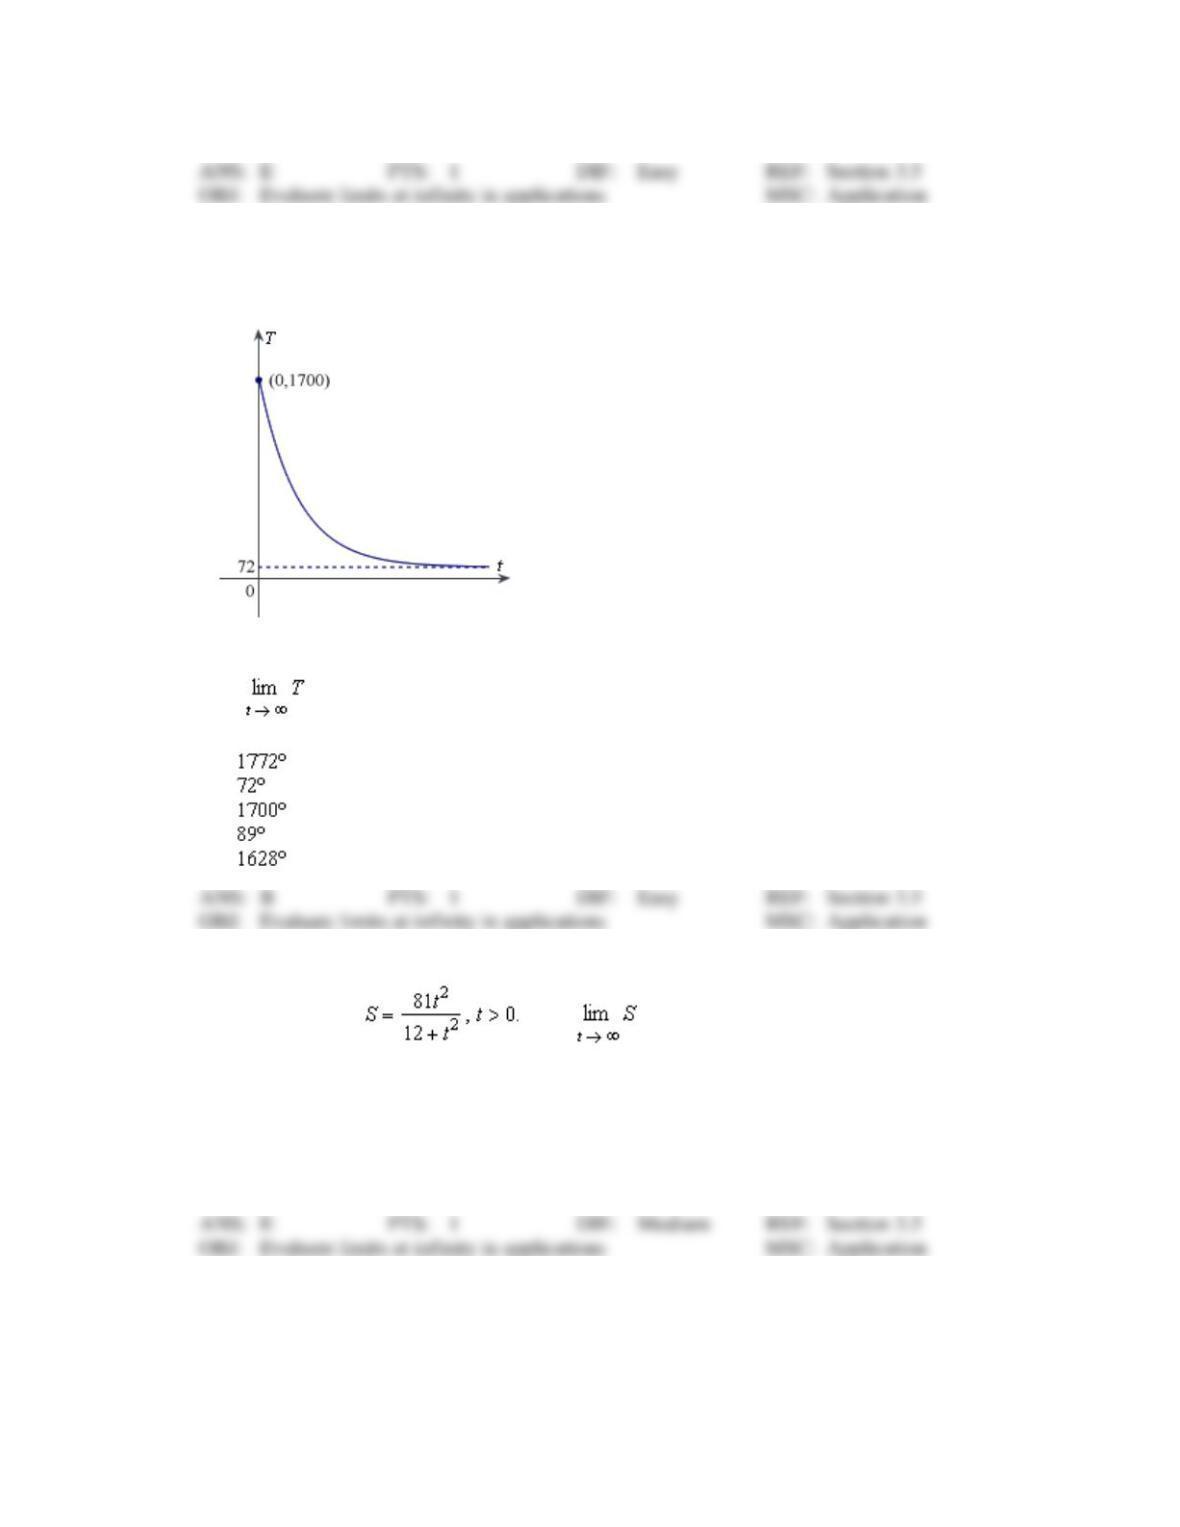
16. A business has a cost of for producing x units. The average cost per unit is
Find the limit of as x approaches infinity.
a.
333.3
b.
1
c.
500
d.
0
e.
1.5
17. The graph shows the temperature T, in degrees Fahrenheit, of molten glass t seconds after it is
removed from a kiln.
Find .
a.
b.
c.
d.
e.
18. A model for the average typing speeds S (words per minute) of a typing student after t weeks of
lessons is given by Find .
a.
96 words per minute
b.
12 words per minute
c.
56 words per minute
d.
162 words per minute
e.
81 words per minute
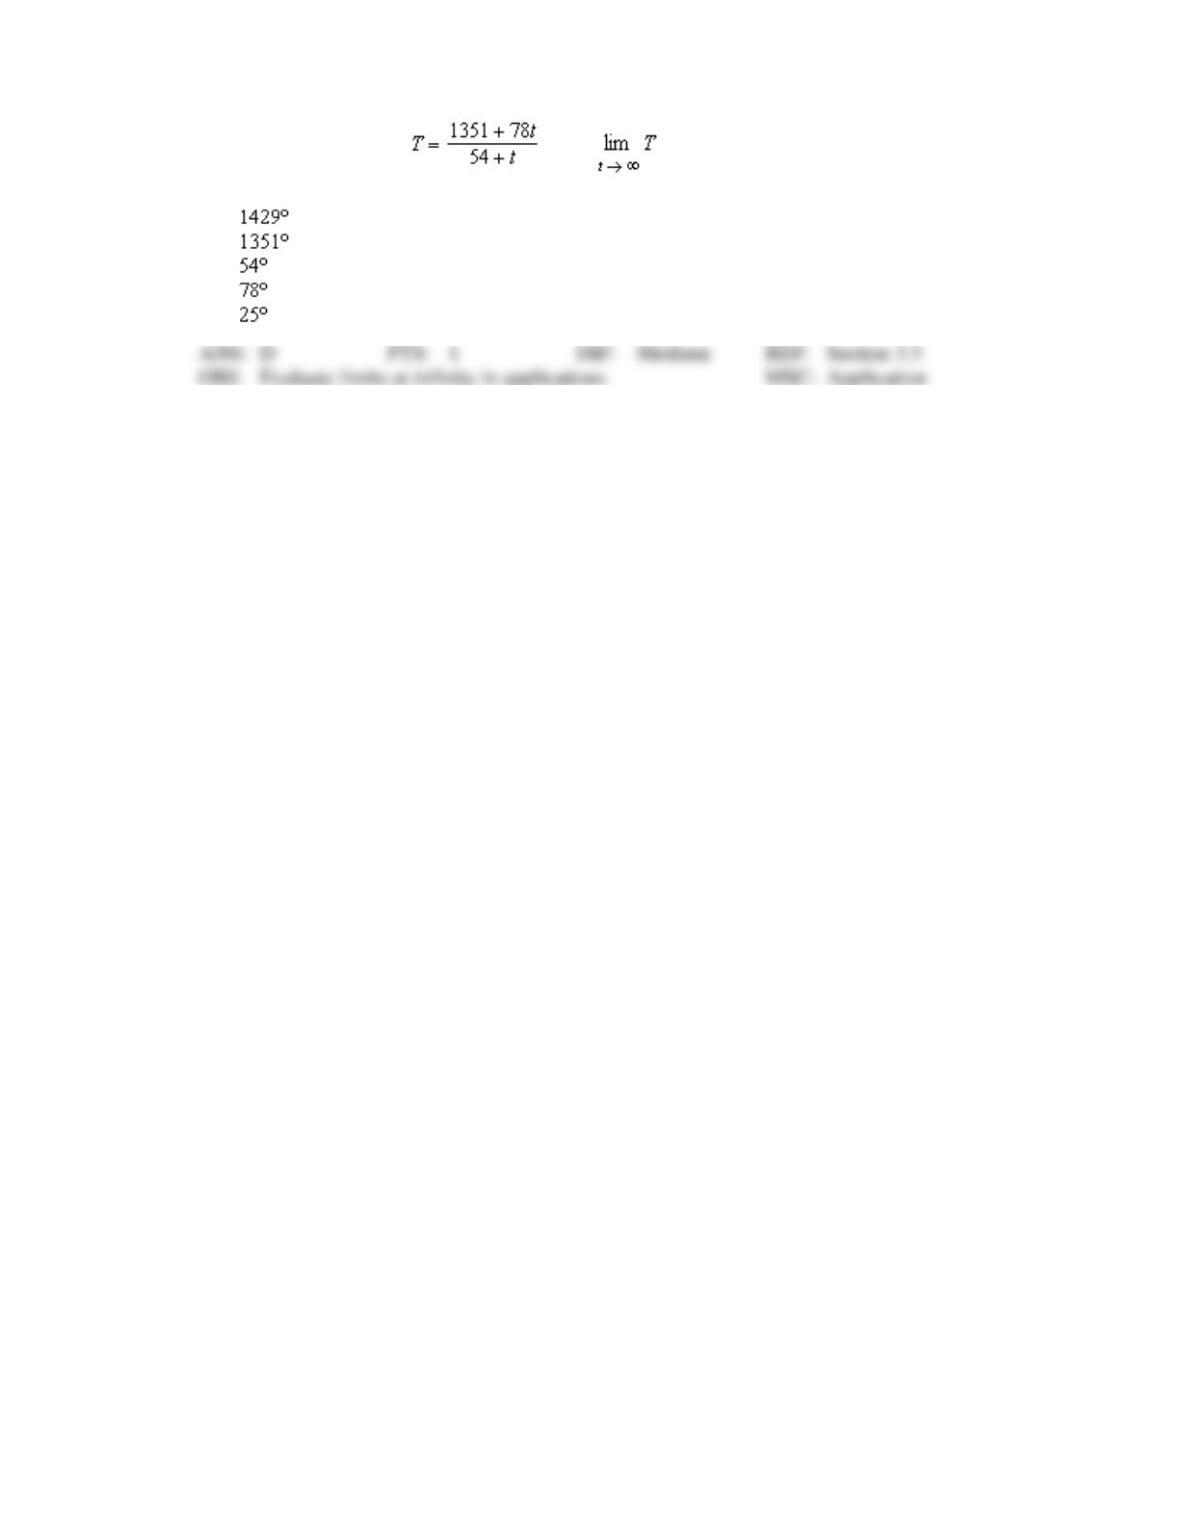
19. A heat probe is attached to the heat exchanger of a heating system. The temperature T (in degrees
Celsius) is recorded t seconds after the furnace is started. A model for the data recorded for the first
two minutes is given by . Find .
a.
b.
c.
d.
e.