Chapter 3 Part 2—Market Demand and Supply
MULTIPLE CHOICE
1. If a shortage of a product currently exists in the market,
a.
the market price is too high.
b.
the quantity demanded is less than the quantity supplied.
c.
the quantity demanded exceeds the quantity supplied at the market price.
d.
there is an excess supply of the product.
e.
there will be a tendency for the price to fall.
2. If the market price is below the equilibrium price, then:
a.
a surplus of product will result.
b.
the quantity supplied will exceed the quantity demanded.
c.
the market supply curve will shift to the right.
d.
the quantity demanded will exceed the quantity supplied.
e.
the market demand curve will shift to the left.
3. If quantity demanded is greater than quantity supplied, then according to the market process:
a.
an excess supply exists.
b.
the market is in equilibrium.
c.
the price will rise.
d.
the supply curve must be vertical.
e.
there will be no tendency for the situation to change.
4. Assume Qs represents the quantity supplied at a given price and Qd represents quantity demanded at
the same given price. Which of the following market conditions produces an upward movement of the
price?
a.
Qs = 1,000, Qd = 750.
c.
Qs = 750, Qd = 1,000.
b.
Qs = 750, Qd = 750.
d.
Qs = 1,000, Qd = 1,000.
5. If a shortage exists in a market then:
a.
the price is below equilibrium.
b.
the quantity demanded exceeds the quantity supplied.
c.
the price will rise in the near future.
d.
all of these.
6. If the price of tea is below its equilibrium level, then:
a.
the demand for tea will decrease.
c.
sellers will be stuck with unsold tea.
b.
the market for tea has cleared.
d.
there is a shortage of tea.
7. When the price of a good is below its equilibrium level, a:
a.
shortage puts upward pressure on the price.
b.
surplus puts downward pressure on the price.
c.
shortage puts downward pressure on the price.
d.
surplus puts upward pressure on the price.
8. Which of the following situations results from a ticket price to a concert set below the equilibrium
price?
a.
A long line of people wanting to purchase tickets to the concert.
b.
No line of people wanting to buy tickets to the concert.
c.
Tickets available at the box office, but no line of people wanting to buy them.
d.
None of these.
9. If equilibrium is present in a market:
a.
there is either a shortage or a surplus.
b.
the quantity demanded equals quantity supplied.
c.
the quantity demanded exceeds quantity supplied.
d.
the quantity supplied exceeds quantity demanded.
10. When quantity supplied equals quantity demanded, there is:
a.
disequilibrium.
b.
excess quantity supplied.
c.
a market-clearing price (equilibrium price).
d.
excess quantity demanded.
e.
a shortage.
11. The most important characteristic of the equilibrium price is that it:
a.
guarantees that producers earn profit.
c.
increases the quantity demanded.
b.
clears the market.
d.
decreases the quantity demanded.
12. If the current price of a good is the same as that found at the intersection of the market demand and
supply curves, then:
a.
excess demand exists.
b.
excess supply exists.
c.
price will rise.
d.
price will fall.
e.
the market is in equilibrium.
13. All of the following apply to the description of a market in equilibrium except:
a.
quantity supplied equals quantity demanded.
b.
the intersection of the supply and demand curves.
c.
no excess supply exists.
d.
no excess demand exists.
e.
the price of the good is falling.
14. The equilibrium price is best defined as the price at which:
a.
demand is smaller than supply.
b.
suppliers want to supply more goods.
c.
demanders want to buy more goods.
d.
quantity demanded is equal to quantity supplied.
e.
the quantity demanded increases.
15. Which of the following best explains the determination of the equilibrium price of a product?
a.
Production costs.
c.
The interaction of supply and demand.
b.
The supply of a good.
d.
The decisions of government.
16. The use of a price system eliminates:
a.
scarcity.
c.
shortages and surpluses.
b.
equilibrium.
d.
changes in supply and demand.
17. In a market, competitive forces guarantee that any price other than the equilibrium price is:
a.
market-clearing.
c.
temporary.
b.
stable.
d.
unaffordable.
18. Market equilibrium is:
a.
defined as the condition in which there is neither a shortage or surplus.
b.
defined as the condition under which the separately formulated plans of buyers and sellers
exactly mesh when tested in the market.
c.
represented graphically by the intersection of the supply and demand curves.
d.
all of these.
19. When the price of a good in a market is above equilibrium:
a.
the quantity supplied exceeds the quantity demanded.
b.
a surplus is observed.
c.
the price will fall in the near future.
d.
all of these.
20. Which of the following is true about the market equilibrium?
a.
As the price increases, the quantity demanded and the quantity supplied increases.
b.
As the price increases, the quantity demanded and the quantity supplied decreases.
c.
As the price increases, the quantity demanded increases and the quantity supplied
decreases.
d.
As the price increases, the quantity demanded decreases and the quantity supplied
increases.
e.
As the price increases, neither the quantity demanded nor quantity supplied change.
21. At any price below the equilibrium price, the:
a.
demand is greater than supply.
b.
supply is greater than demand.
c.
quantity demanded is greater than quantity supplied.
d.
quantity supplied is greater than quantity demanded.
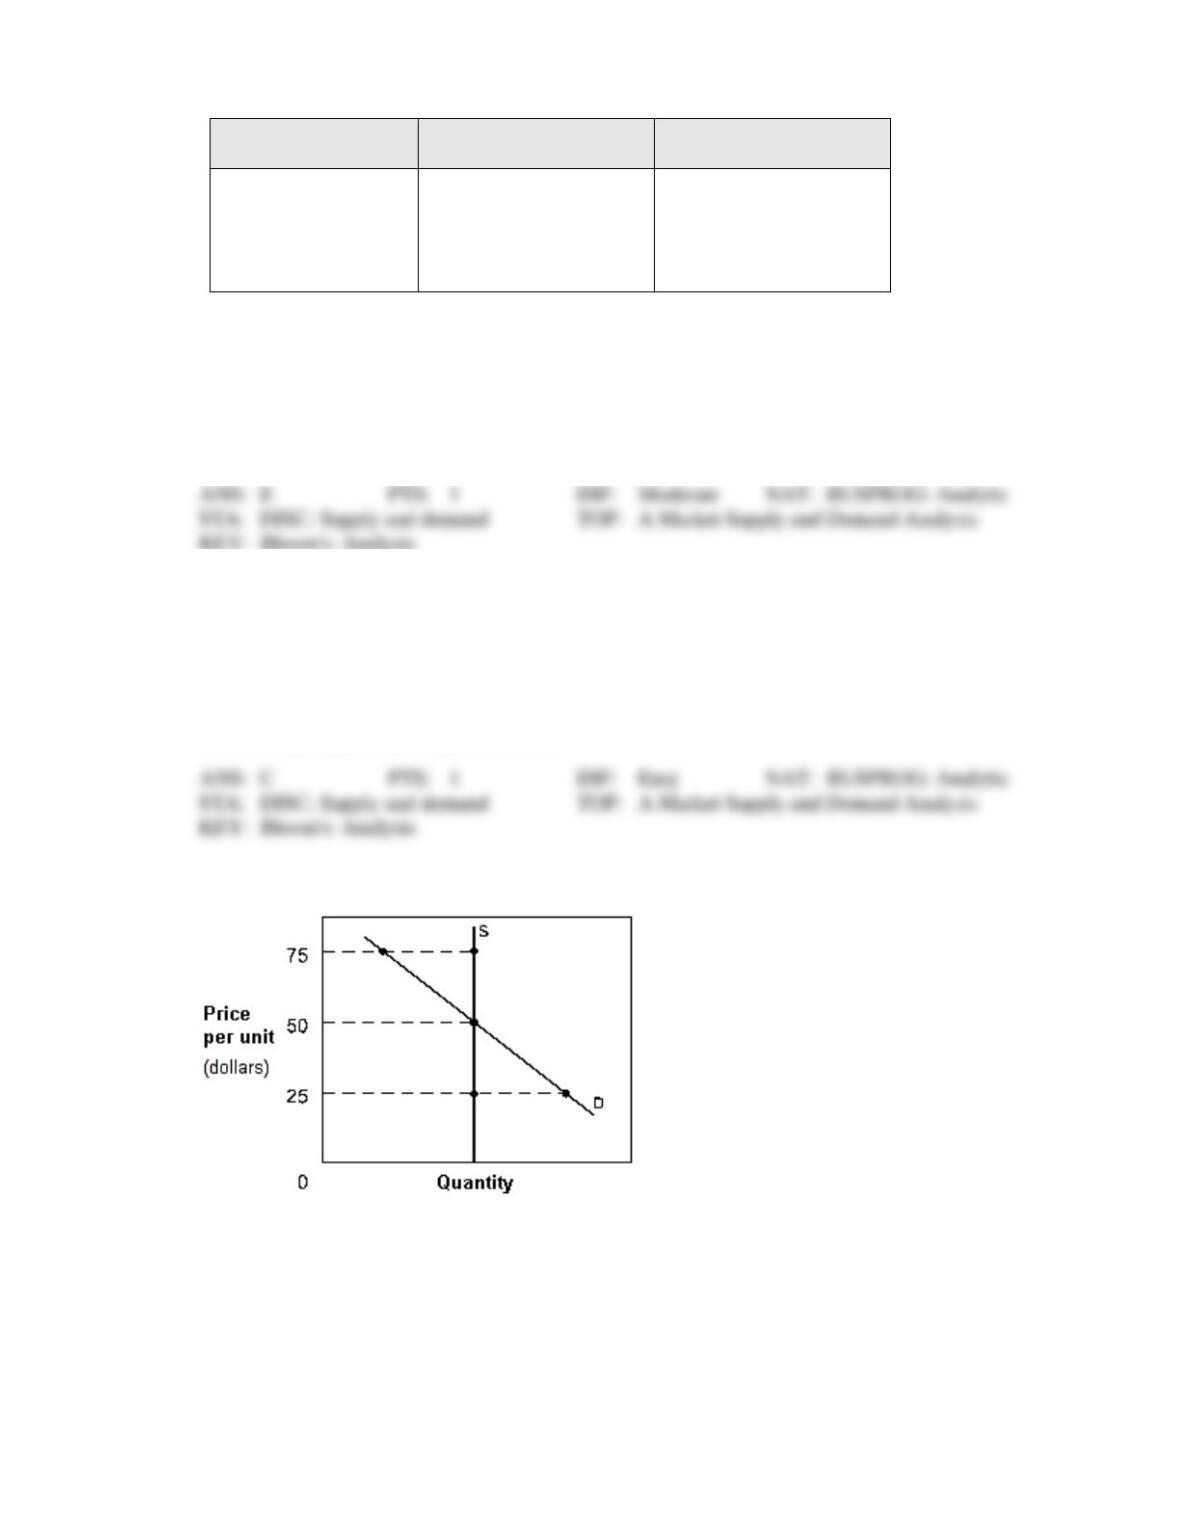
Exhibit 3-6 Milk market
Price per Quart
Quantity Demanded
(Quarts per week)
Quantity Supplied
(Quarts per week)
0.70
20
180
0.60
60
140
0.50
100
100
0.40
140
60
0.30
180
20
22. In Exhibit 3-6, which of the following is true about the milk market?
a.
At price 0.60 there is an excess demand of milk.
b.
At price 0.40 there is an excess supply of milk.
c.
At price 0.30 there is an excess supply of milk.
d.
At price 0.50 there is an excess demand of milk.
e.
At price 0.70 there is an excess supply of milk.
23. In Exhibit 3-6, which of the following are the equilibrium price and equilibrium quantity in the milk
market?
a.
$0.70 per quart and 200 quarts of milk.
b.
$0.60 per quart and 100 quarts of milk.
c.
$0.50 per quart and 100 quarts of milk.
d.
$0.40 per quart and 60 quarts of milk.
e.
$0.30 per quart and 20 quarts of milk.
Exhibit 3-7 Demand and supply curves
24. In Exhibit 3-7, if price happened to currently be $75 in this market, a ____ would result, causing a(n)
____ in price.
a.
shortage; increase
b.
shortage; decrease
c.
surplus; increase
d.
surplus; decrease
e.
market clearing; change
25. In Exhibit 3-7, if price happened to currently be $25 in this market, a ____ would result, causing a(n)
____ in price.
a.
shortage; increase
b.
shortage; decrease
c.
surplus; increase
d.
surplus; decrease
e.
scarcity; stabilization
Exhibit 3-8 Demand and supply data for Video games
Price
Quantity Demanded
of Video games
Quantity Supplied
of Video games
$75
400
900
70
450
850
65
500
800
60
550
750
55
600
700
50
650
650
45
700
600
40
750
550
26. Exhibit 3-8 presents supply and demand data for the video game market. If the price of video games
was currently $70, there would be an ____ of ____ video games in this market.
a.
excess demand; 450
b.
excess demand; 500
c.
excess supply; 400
d.
excess supply; 850
e.
excess demand; 400
27. In Exhibit 3-8, at any market price of video games above $50, a(n) ____ would result, causing price to
____.
a.
excess demand; rise
b.
excess supply; rise
c.
excess demand; fall
d.
excess supply; fall
e.
shortage; rise
28. In Exhibit 3-8, if the price of video games was currently $45, there would be an ____ of ____ video
games in this market.
a.
excess demand; 700
b.
excess demand; 500
c.
excess supply; 100
d.
excess supply; 600
e.
excess demand; 100
29. In Exhibit 3-8, at any market price of video games below $50, a(n) ____ would result, causing price to
____.
a.
excess demand; rise
b.
excess supply; rise
c.
excess demand; fall
d.
excess supply; fall
e.
surplus; rise
30. In Exhibit 3-8, if there is a shortage of video games of 200 units, the current price of video games must
be:
a.
$60.
b.
$55.
c.
$50.
d.
$45.
e.
$40.
31. In Exhibit 3-8, if there is a surplus of video games of 200 units, the current price of video games must
be:
a.
$60.
b.
$55.
c.
$50.
d.
$45.
e.
$40.
32. In Exhibit 3-8, the equilibrium market price in this video game market would be:
a.
$65
b.
$60
c.
$55
d.
$50
e.
$45
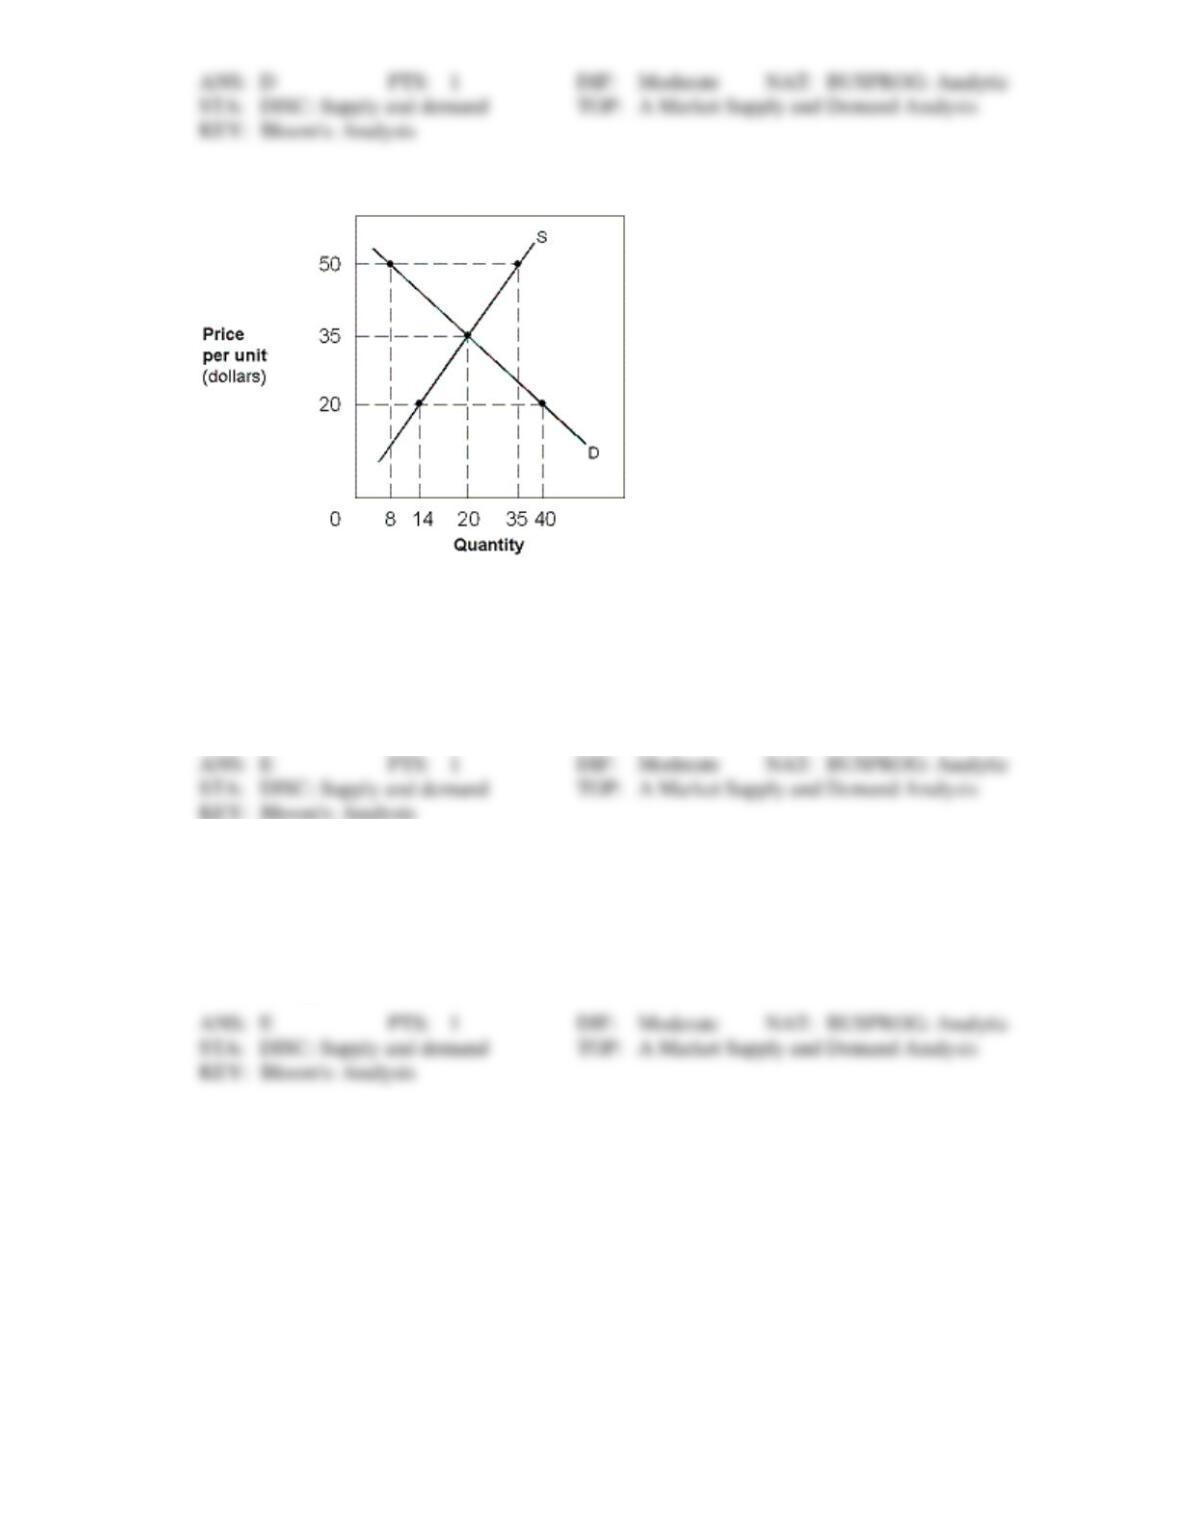
Exhibit 3-9 Demand and supply curves
33. In Exhibit 3-9, if the market price is $50,
a.
this market will be in equilibrium.
b.
a shortage of 27 units would result.
c.
the price is below the equilibrium price.
d.
a surplus of 26 units would result.
e.
a surplus of 27 units would result.
34. In Exhibit 3-9, if the market price is $20,
a.
this market will be in equilibrium.
b.
a shortage of 27 units will result.
c.
the price is above the equilibrium price.
d.
a surplus of 26 units will result.
e.
a shortage of 26 units will result.
Exhibit 3-10 Demand and supply curves
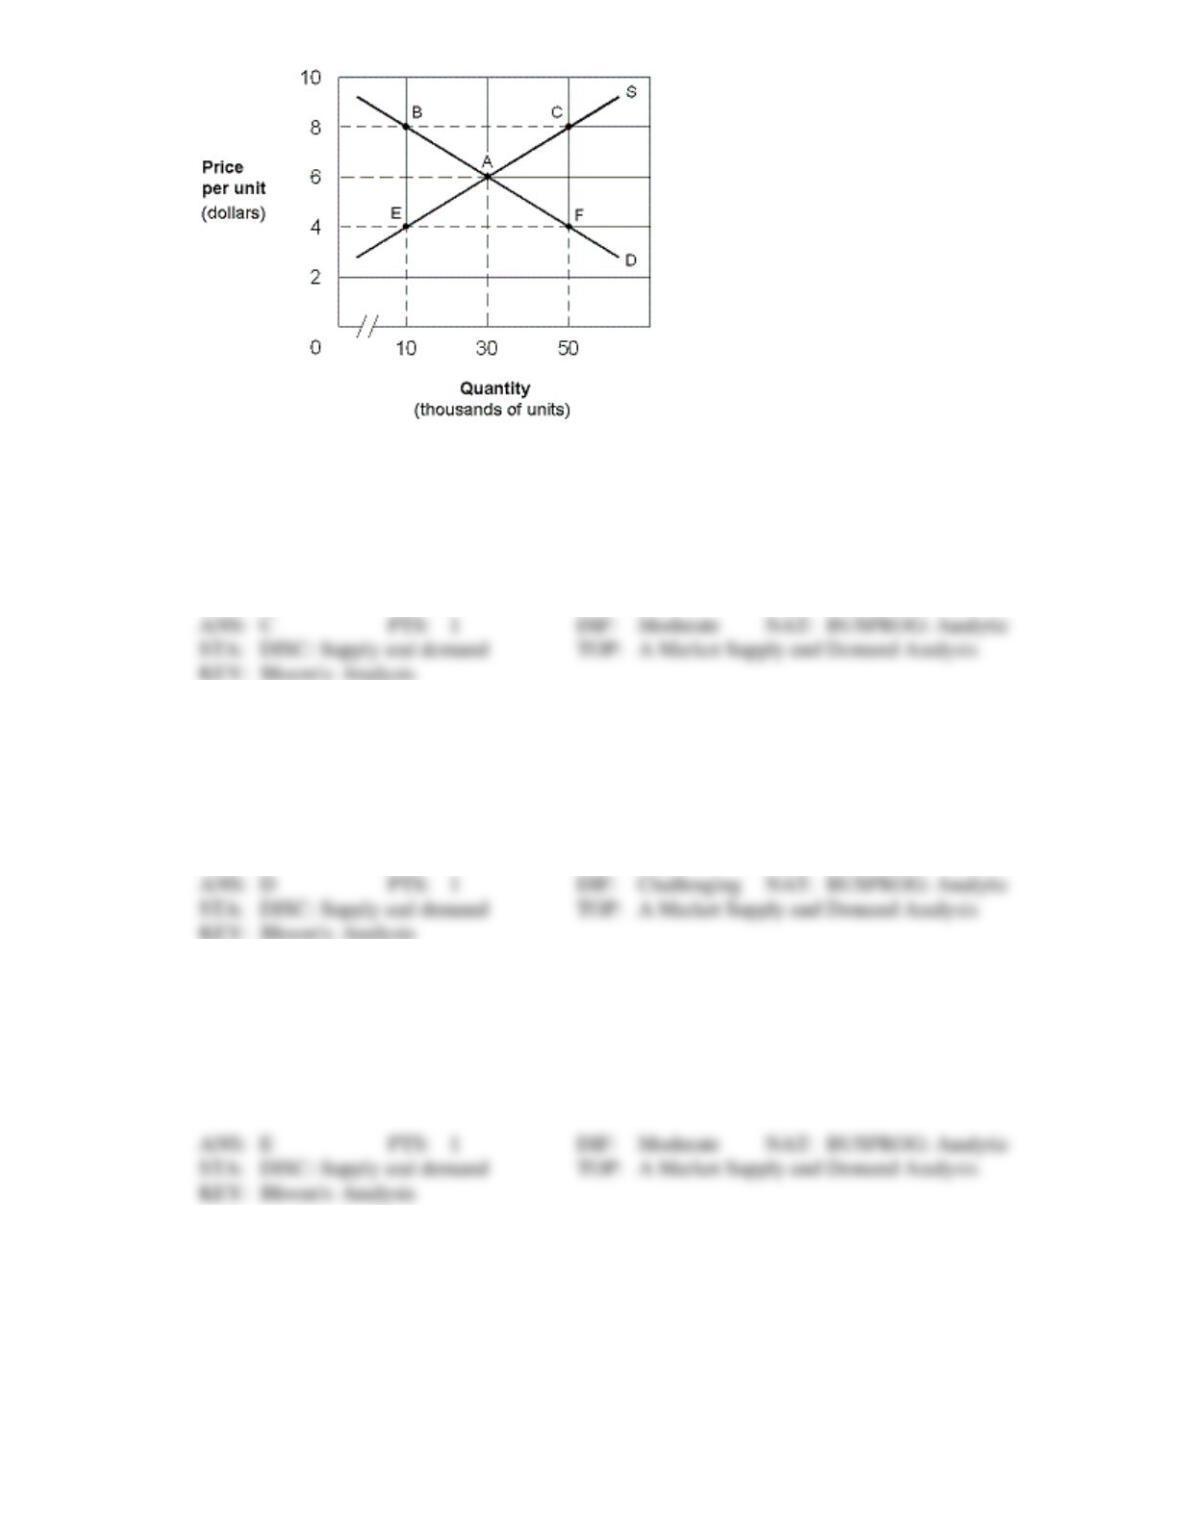
35. In Exhibit 3-10, which of the following points represents an excess quantity supplied?
a.
Point E.
b.
Point B.
c.
Point C.
d.
Point F.
e.
Point A.
36. In Exhibit 3-10, what do you expect to happen in this market at point C?
a.
Competition among demanders will drive the price down.
b.
Competition among demanders will drive the price up.
c.
Competition among suppliers will drive the price up.
d.
Competition among suppliers will drive the price down.
e.
The equilibrium price A is not attainable.
37. In Exhibit 3-10, which of the following is true about this graph?
a.
When the price is $4, there is an excess supply.
b.
When the price is $8, there is an excess demand.
c.
When the price is $4, excess supply is greater than excess demand.
d.
When the price is $8, excess demand is greater than excess supply.
e.
When the price is $6, there is no excess demand or excess supply.
Exhibit 3-11 Demand and supply curves
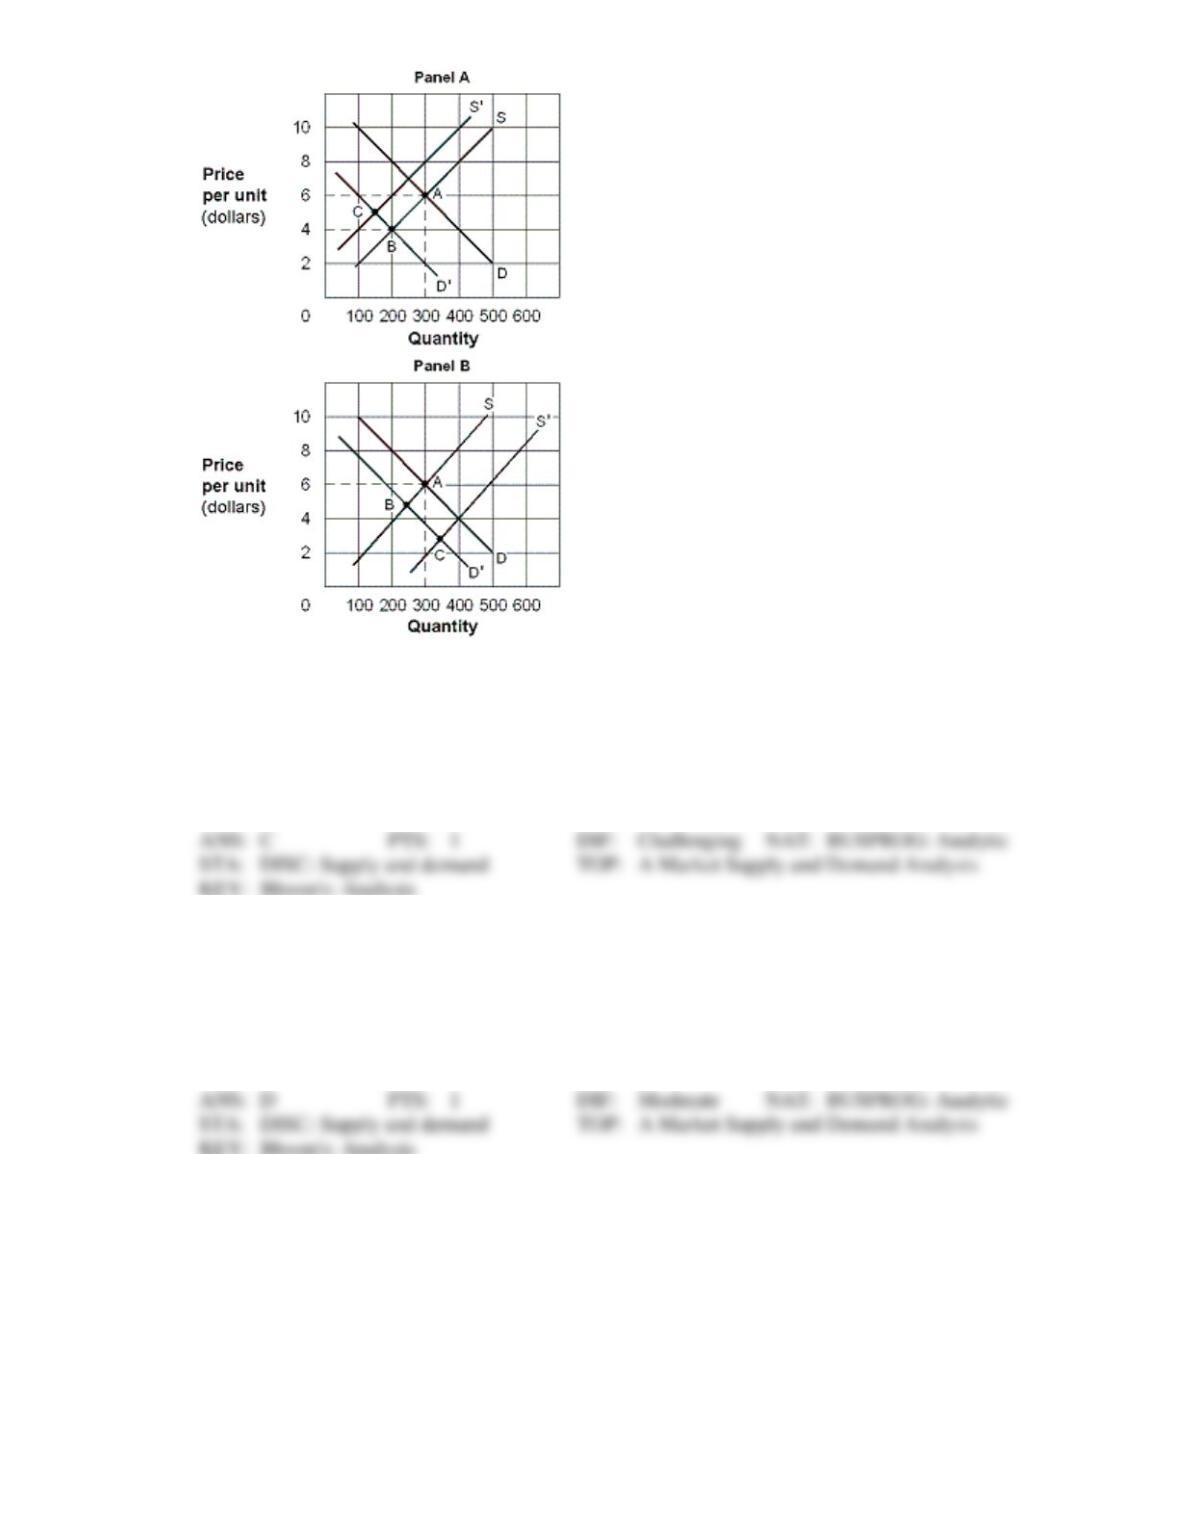
38. In Exhibit 3-11, in Panel A the movement from A to B describes a(n):
a.
increase in demand and an increase in the quantity supplied.
b.
increase in the quantity demanded and an increase in supply.
c.
decrease in demand and a decrease in the quantity supplied.
d.
decrease in the quantity demanded and a decrease in supply.
e.
decrease in the quantity demanded and an increase in supply.
39. In Exhibit 3-11, in Panel A the movement from A to C describes a(n):
a.
ambiguous change in price and a decrease in quantity.
b.
increase in price and an ambiguous change in quantity.
c.
increase in both price and quantity.
d.
decrease in both price and quantity.
e.
change in supply that dominates a change in demand.
40. In Exhibit 3-11, in Panel B the movement from A to C describes a(n):
a.
increase in demand and a decrease in supply, where the increase in demand is relatively
bigger.
b.
decrease in both demand and supply, where the decrease in supply is relatively bigger.
c.
increase in demand and a decrease in supply, where the decrease in supply is relatively
bigger.
d.
decrease in demand and increase in supply, where the increase in supply is relatively
bigger.
e.
increase in both demand and supply, where the increase in supply is relatively bigger.
Exhibit 3-12 Supply and demand data
Price
Quantity
Demanded
Quantity
Supplied
$1.00
250
150
1.50
200
200
2.00
150
250
2.50
100
300
41. In Exhibit 3-12, at a price of $2.00 the market will experience a(n):
a.
shortage of 150 units.
c.
shortage of 100 units.
b.
surplus of 100 units.
d.
equilibrium.
42. In Exhibit 3-12, which of the following occurs at a price of $1.00?
a.
A shortage puts a downward pressure on price.
b.
Quantity demanded exceeds quantity supplied, putting upward pressure on price.
c.
Quantity supplied exceeds quantity demanded, putting upward pressure on price.
d.
The surplus would be so small that there would be only slight upward pressure on price.
43. In Exhibit 3-12 the equilibrium price and quantity in the market are:
a.
$1.00, 200.
c.
$2.00, 100.
b.
$1.50, 400.
d.
$1.50, 200.
Exhibit 3-13 Supply and demand curves