Exam
Name___________________________________
MULTIPLE CHOICE. Choose the one alternative that best completes the statement or answers the question.
Use the empirical rule to solve the problem.
1)
A data set has 90 observations and has mean 50 and standard deviation 8. Approximately how
many observations lie between 26 and 74?
1)
A)
61
B)
90
C)
63
D)
86
Solve the problem.
2)
A quantitative data set has mean 17 and standard deviation 2. At least what percentage of the
observations lie between 9 and 25?
2)
A)
93.75%
B)
68%
C)
95%
D)
6.25%
Use the empirical rule to solve the problem.
3)
A data set has mean 12 and standard deviation 3. Approximately 99.7% of the observations lie
between ____ and ____ .
3)
A)
3, 21
B)
6, 18
C)
6, 21
D)
9, 15
4)
A data set has size 100. Approximately how many observations lie within 2 standard deviations to
either side of the mean?
4)
A)
68
B)
95
C)
5
D)
100
SHORT ANSWER. Write the word or phrase that best completes each statement or answers the question.
Provide an appropriate response.
5)
Can the sample variance ever be a negative number? If so, for what types of data? If not,
why not? Can the sample variance ever be zero? If so, for what types of data? If not, why
not? Explain your reasoning.
5)
6)
A machine fills bottles with juice. The average amount filled in the bottles is 16 ounces;
however this amount varies slightly from bottle to bottle. The manufacturer is interested in
knowing how much the amount of juice varies from bottle to bottle. How could the
manufacturer obtain an estimate of the population standard deviation ?
6)
7)
For a particular population, the _____________ mean is a constant and the ____________
mean is a variable.
7)
8)
Explain how to find the adjacent values when constructing a modified boxplot. When are
the adjacent values equal to the minimum and maximum observations?
8)
9)
We want to compare two different groups of students, students taking Composition 1 in a
traditional lecture format and students taking Composition 1 in a distance learning format.
We know that the mean score on the research paper is 85 for both groups. What additional
information would be provided by knowing the standard deviation?
9)
10)
Explain the difference between the interquartile range and the range. Which is more
sensitive to extreme values? Explain your thinking.
10)
11)
A company advertises an average of 42,000 miles for one of its new tires. In the
manufacturing process there is some variation around that average. Would the company
want a process that provides a large or a small variance? Justify your answer.
11)
12)
Roughly speaking, the standard deviation indicates how far, on average, the observations
are from the mean. Do you think that for the data set below the standard deviation will
give a good indication of the typical deviation from the mean?
2, 3, 4, 4, 5, 5, 6, 6, 100
What drawback of the standard deviation is illustrated by this example?
12)
13)
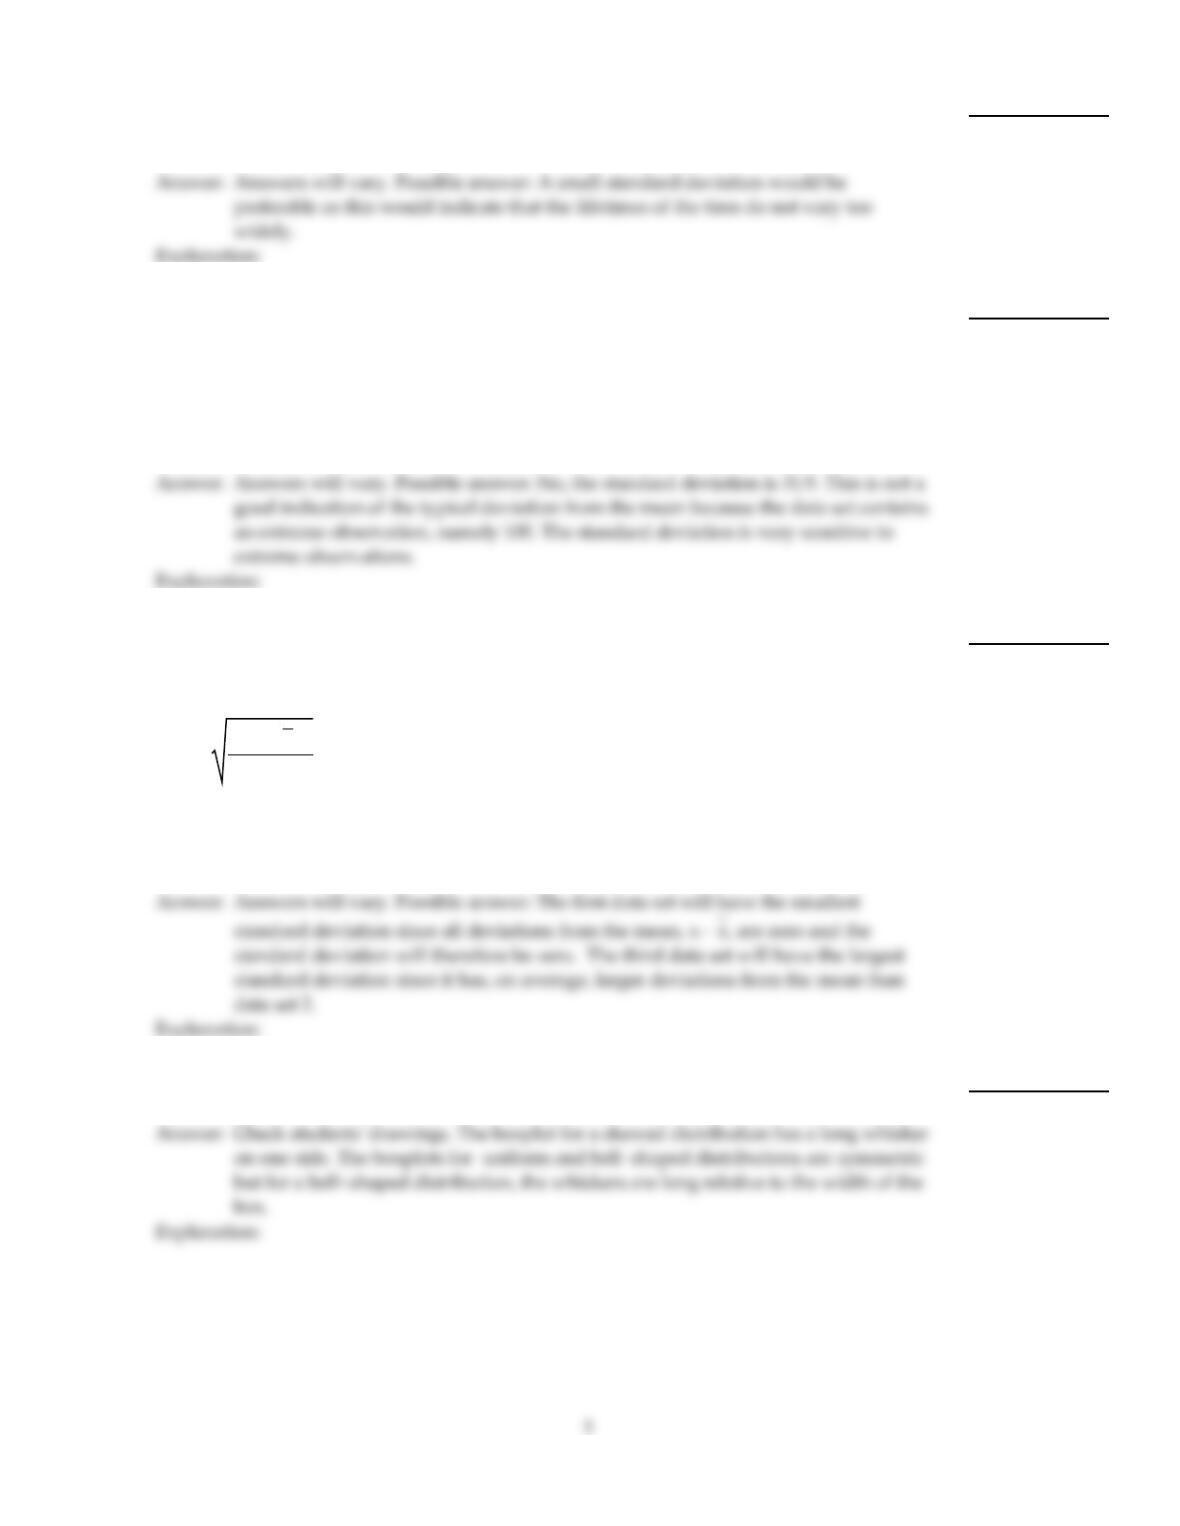
Without calculating the standard deviation, compare the standard deviation for the
following data sets. (Note: All data sets have a mean of 30.) Which do you expect to have
the largest standard deviation and which do you expect to have the smallest standard
deviation? Explain your answers in terms of the formula
s =(x –x)2
n – 1 .
Data set 1: 30, 30, 30, 30, 30, 30, 30, 30, 30, 30
Data set 2: 20, 25, 25, 30, 30, 30, 30, 35, 35, 40
Date set 3: 20, 20, 20, 25, 25, 35, 35, 40, 40, 40
13)
14)
Draw one boxplot to illustrate bell–shaped data, another for uniform data, and a third for
skewed data.
14)
15)
A census bureau collects information about the household income (total income of
everyone living in one residence) of people in a certain country.
(i) Identify the variable and population under consideration.
(ii) By consulting the most recent census data, it was found that the mean household
income of all residents in the country is $35,352. Decide whether this descriptive measure
is a parameter or a statistic and use the correct notation to express the result.
15)
16)
A machine fills bottles with juice. The average amount filled in the bottles is 16 ounces;
however this amount varies slightly from bottle to bottle. The manufacturer is interested in
knowing how much the amount of juice varies from bottle to bottle. In this context, what is
the population of interest and what does represent?
16)
17)
Dave is a college student contemplating a possible career option. One factor that will
influence his decision is the amount of money he is likely to make. He decides to look up
the average starting salary of graduates in that profession. Which information would be
most useful to him, the mean starting salary, the median starting salary, or the mode of the
starting salaries? Why?
17)
18)
Do you think it is possible to find two data sets such that the first data set has a smaller
range but a larger standard deviation than the second set? If so, give an example of two
such data sets. If it is not possible, explain why not.
18)
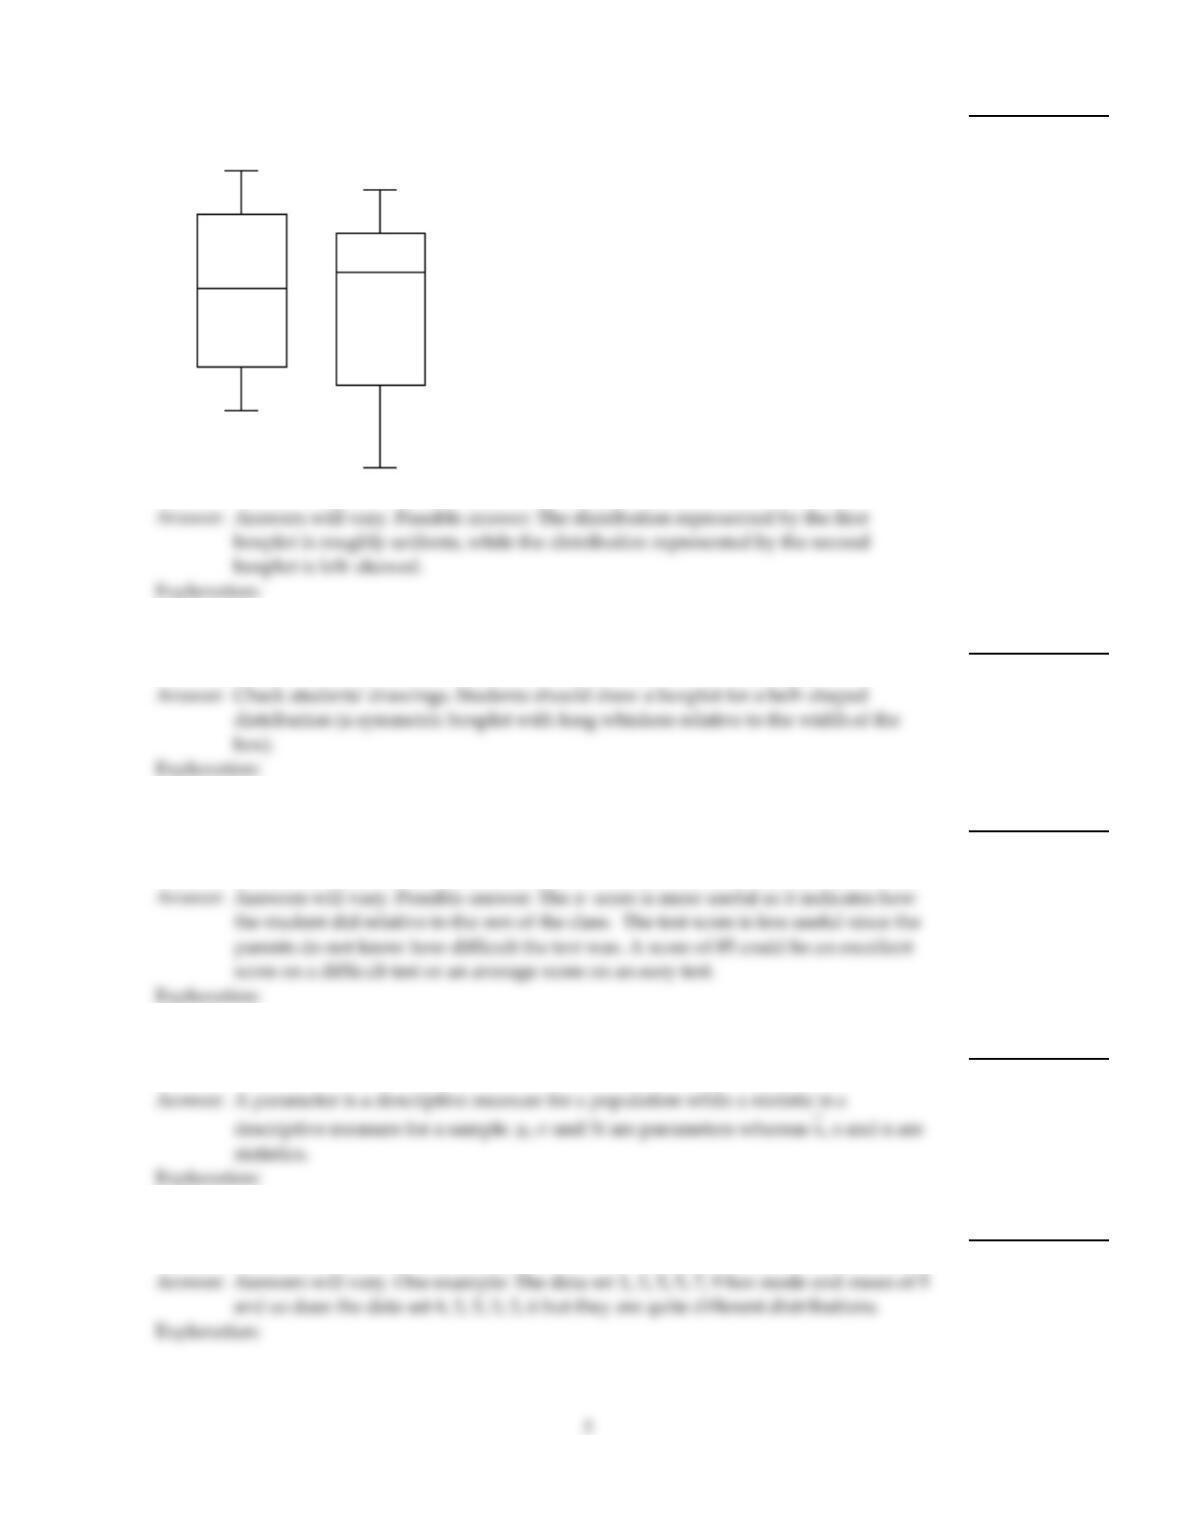
19)
Describe any similarities or differences in the two distributions represented by the
following boxplots. Assume the two boxplots have the same scale. Explain your reasoning.
19)
20)
Heights of adult women are known to have a bell–shaped distribution. Draw a boxplot to
illustrate the results.
20)
21)
A teacher records the test scores for the 30 students in her class. Corresponding to each
score, she calculates a z–score. If you were the parents of a girl in the class, would you be
more interested in knowing your daughter’s test score or z–score? Explain your reasoning.
21)
22)
Explain in your own words the difference between a parameter and a statistic. Give
examples of two statistics and two parameters.
22)
23)
Explain how two data sets could have equal means and modes but still differ greatly. Give
an example with two data sets to illustrate.
23)
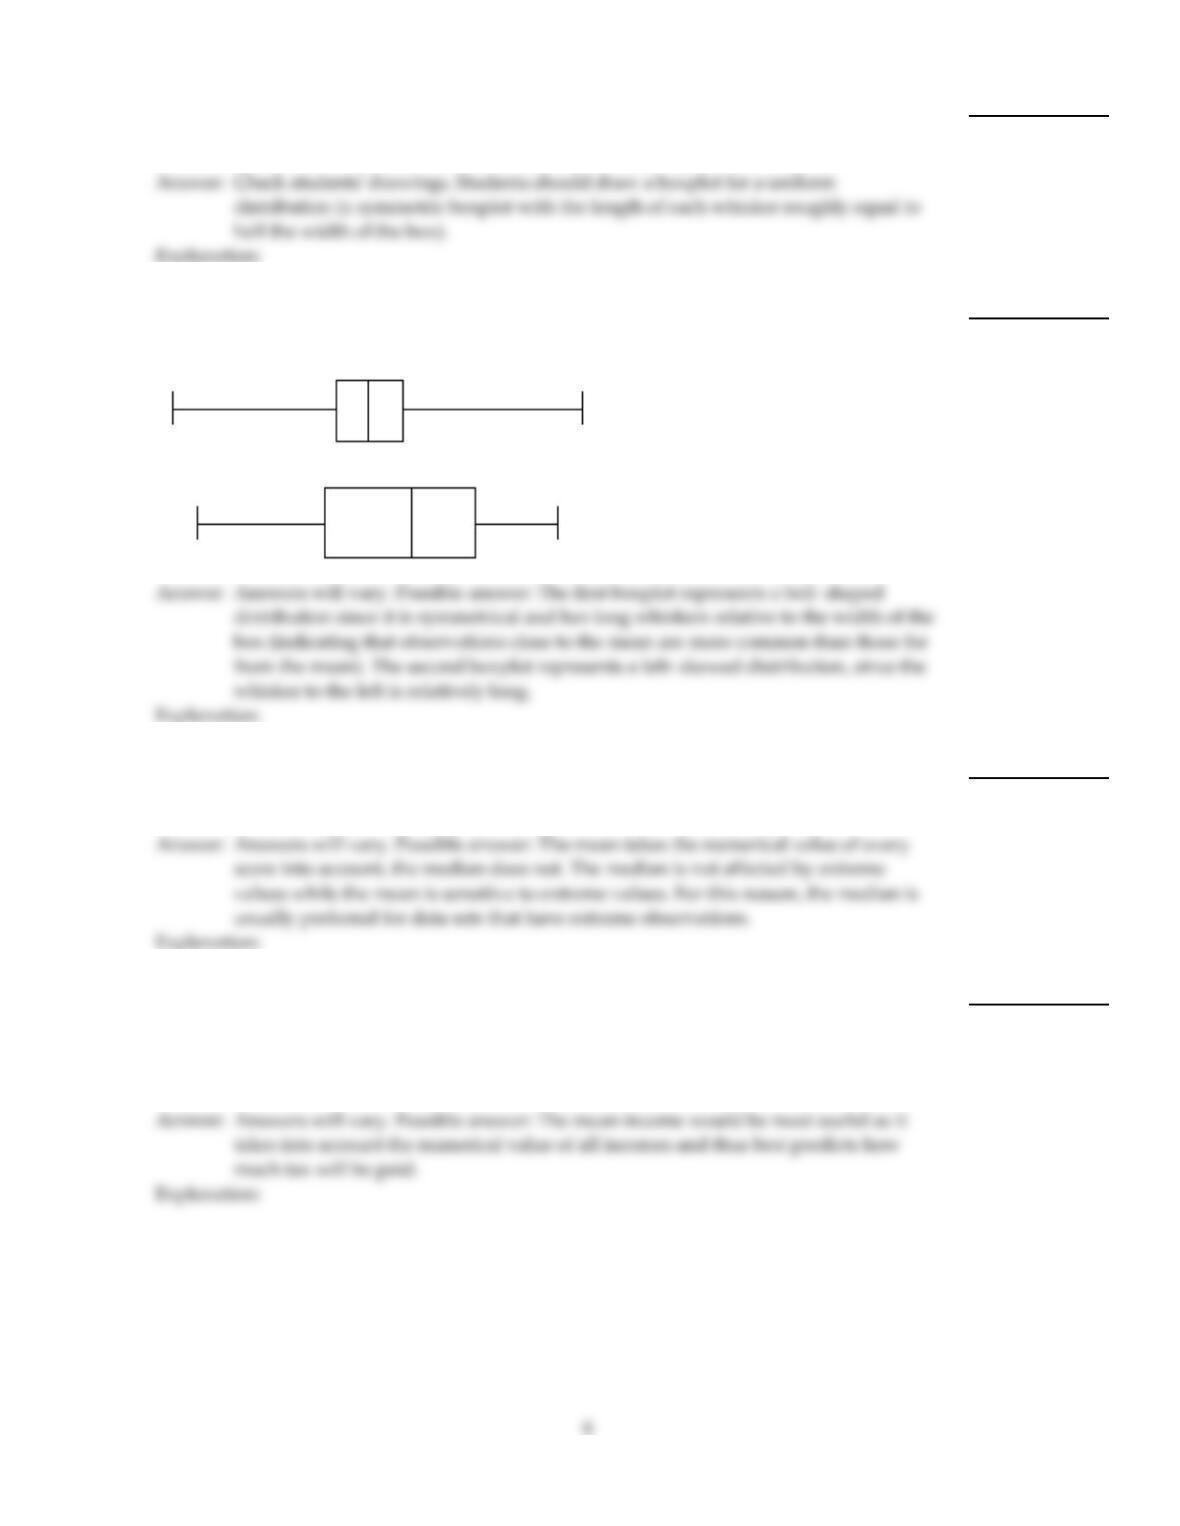
24)
In the Florida lottery, the numbers (between 1 and 49) are generated randomly with the
expectation that each number has an equal chance of winning. Draw a boxplot which
should illustrate the data set of all numbers picked for the lottery during the past year.
24)
25)
Discuss the differences between the distributions represented by the two boxplots below.
Assume the two boxplots have the same scale. Explain your reasoning.
25)
26)
The two most frequently used measures of central tendency are the mean and the median.
Compare these two measures for the following characteristics: Takes every score into
account? Affected by extreme scores? Advantages.
26)
27)
Suppose that a state introduces a state income tax which will be at a flat rate of 3%. The
state legislature wishes to estimate how much money they will receive in taxes, and to do
this they need to know the average income of residents of the state. Which information
would be most useful, the mean income, the median income, or the mode of the incomes?
Why?
27)
28)
In Mary’s first math test she scored 87%. The mean and standard deviation for the class
were 71% and 18% respectively. In her second math test, Mary scored 66%. The mean and
standard deviation for the class were 53% and 14% respectively. In which test did Mary do
better relative to the rest of the class? Explain your reasoning. (Hint: find the z–scores
corresponding to her two test scores.)
28)
29)
The table below provides a frequency distribution for the winner of the Davis Cup during
the period 1977–1994.
Winner of
Davis Cup Frequency
United States 6
Germany 3
Czechoslovakia 1
Australia 3
France 1
Sweden 4
Which measure of center, the mean, the median, or the mode is most appropriate here?
Why?
29)
30)
The range and standard deviation of the data set below are 35 and 12.47 respectively.
5, 24, 25, 26, 40
If the 26 is replaced with 39, how will this affect the range? How will this affect the
standard deviation. Use your answers to explain why the standard deviation is preferable
to the range as a measure of variation.
30)
31)
Does the mode of a data set always lie near the center? Explain your answer and give an
example of a data set to illustrate your answer.
31)
32)
A teacher records the test scores for the 40 students in her class. Corresponding to each
score, she calculates a z–score. Julia’s z–score is –2.8. Should she be concerned? Explain
your reasoning.
32)
33)
Explain what each symbol represents: (i) , (ii) n, (iii) x
33)
34)
A population consists of 100 professional gymnasts and 100 professional basketball
players. For this group, the average height is 70 inches. However, most of the gymnasts are
between 57 and 61 inches tall while most of the basketball players are between 78 and 82
inches tall. For this group, observations far from the mean are more common than
observations close to the mean. Describe what a boxplot for the heights of this group
would look like. Discuss, in particular, the lengths of the whiskers relative to the width of
the box and explain your reasoning.
34)
35)
The data set below consists of the scores of 15 students on a quiz. For this data set, which
measure of variation do you think is more appropriate, the range or the standard
deviation? Explain your thinking.
90 90 91 91 89
90 89 91 91 90
60 90 89 90 91
35)
36)
A group of medical researchers is interested in knowing the mean cholesterol level for all
men in the U.S. aged between 70 and 80. They pick a sample of 5,000 men and measure
their cholesterol levels. They then calculate the mean and standard deviation of these
cholesterol levels. Do the mean and standard deviation obtained in this way represent
parameters or statistics? Why? What symbols could you use to denote the mean and
standard deviation of the 5,000 cholesterol levels?
36)
37)
When finding the 5–number summary, it becomes easy to identify the outliers of a data set.
Under what conditions should outliers be deleted, and when should they be further
investigated?
37)
38)
Which boxplot shape (uniform, bell–shaped, or skewed) best matches the boxplot for the
first 100 digits of ? (Below is the frequency table for the first 100 digits of .)
x
f 0 1 2 3 4 5 6 7 8 9
8 8 12 11 10 8 9 8 12 14
38)
39)
The median of a data set is always/sometimes/never (select one) one of the data points in a
set of data. Explain your answer with brief examples.
39)
40)
Fill in the blank. If both the sample standard deviation, s, and the population standard
deviation, , are computed for the same data set, they will tend to be closer together if the
data set is ___________.
40)
MULTIPLE CHOICE. Choose the one alternative that best completes the statement or answers the question.
41)
Obtain the population standard deviation, , for the given data. Assume that the data represent
population data. Round your final answer to one more decimal place than that used for the
observations.
The number of years of teaching experience is given below for 12 high–school teachers.
613 17 10 12 19
17 8 5 13 22 31
41)
A)
7.1 yr
B)
8.6 yr
C)
49.7 yr
D)
7.4 yr
Find the mode(s) for the given sample data.
42)
–20, –35, –46, –35, –49, –35, –49
42)
A)
–46
B)
–38.4
C)
–49
D)
–35
Find the median for the given sample data.
43)
In ten trips to Las Vegas, a person had the following net gains:
$2818 $3584 $4898 $6566 $2942
$3205 $6069 $8391 $6769 $4228
43)
A)
$4947.50
B)
$4898
C)
$4563.00
D)
$5497.72
Construct and interpret a boxplot or a modified boxplot as specified.
44)
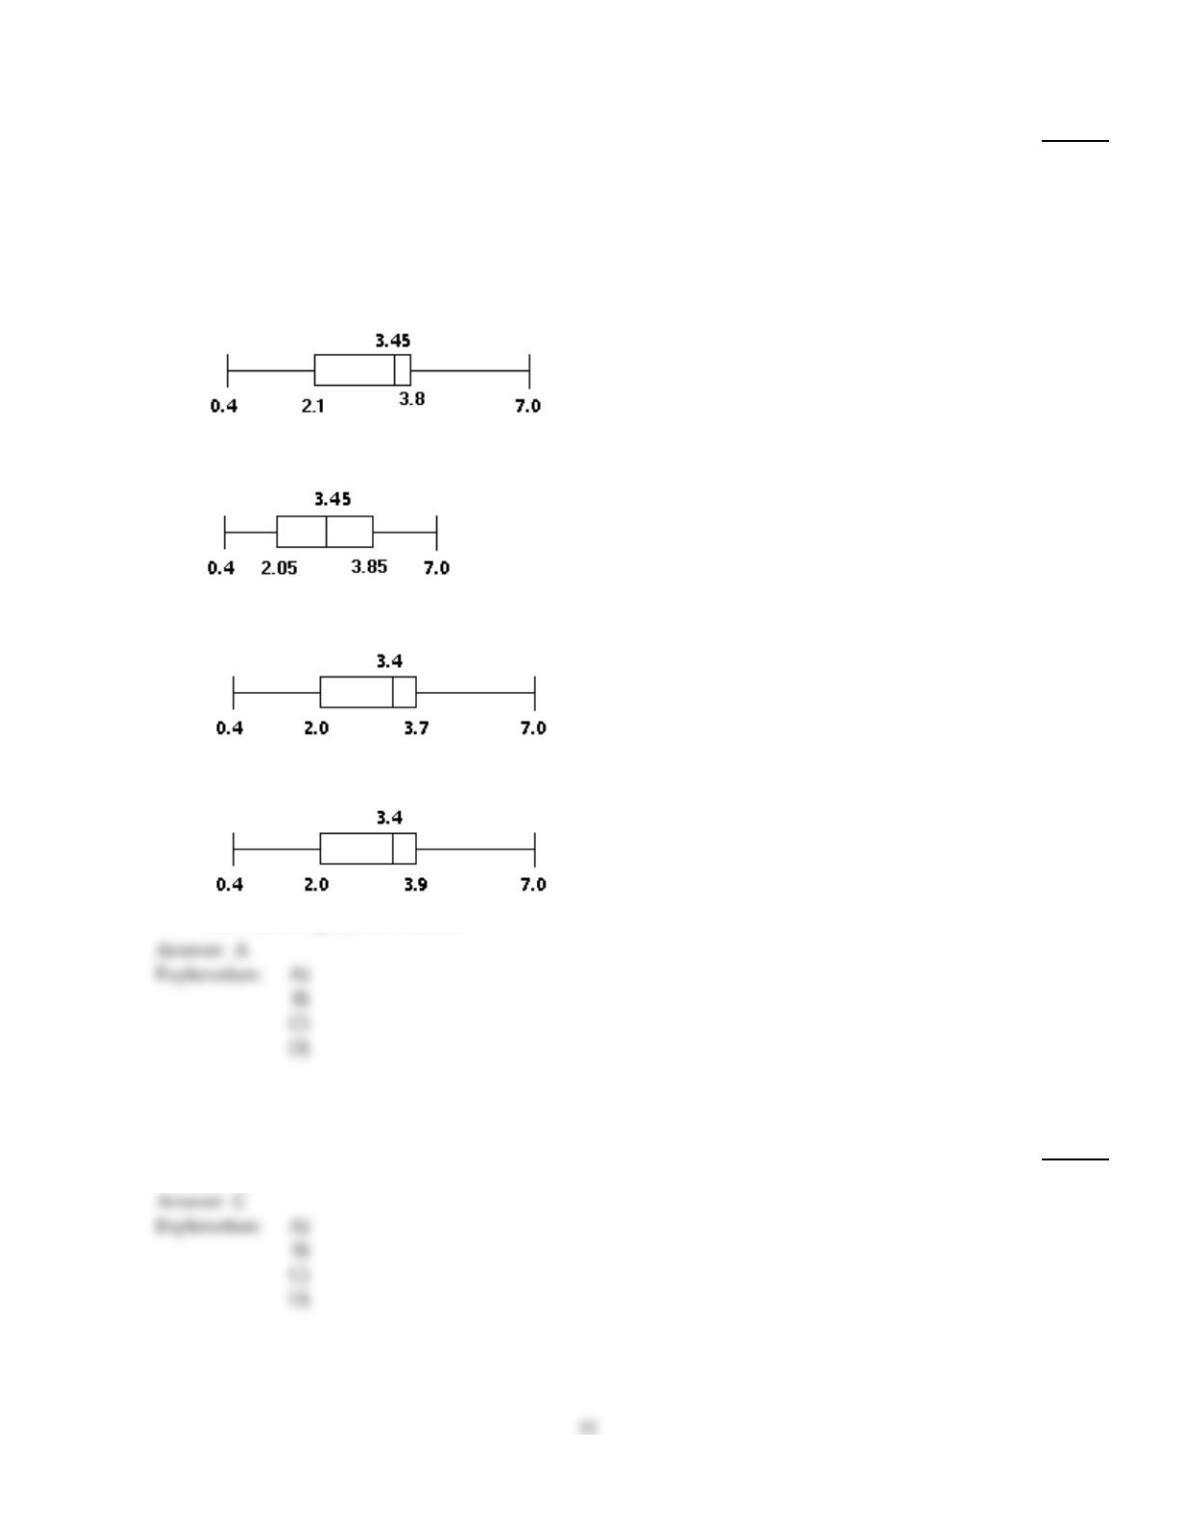
The normal monthly precipitation (in inches) for August is listed for 20 different U.S. cities.
Construct a boxplot for the data.
0.4 1.0 1.5 1.6 2.0
2.2 2.4 2.7 3.4 3.4
3.5 3.6 3.6 3.7 3.7
3.9 4.1 4.2 4.2 7.0
44)
A)
The data is slightly left–skewed.
B)
The data is symmetrical. It is a uniform distribution.
C)
The data is highly left–skewed.
D)
The data is slightly left–skewed.
Find the sample standard deviation for the given data. Round your final answer to one more decimal place than that used
for the observations.
45)
15, 42, 53, 7, 9, 12, 14, 28, 47
45)
A)
16.6
B)
15.8
C)
17.8
D)
29.1
Construct and interpret a boxplot or a modified boxplot as specified.
46)
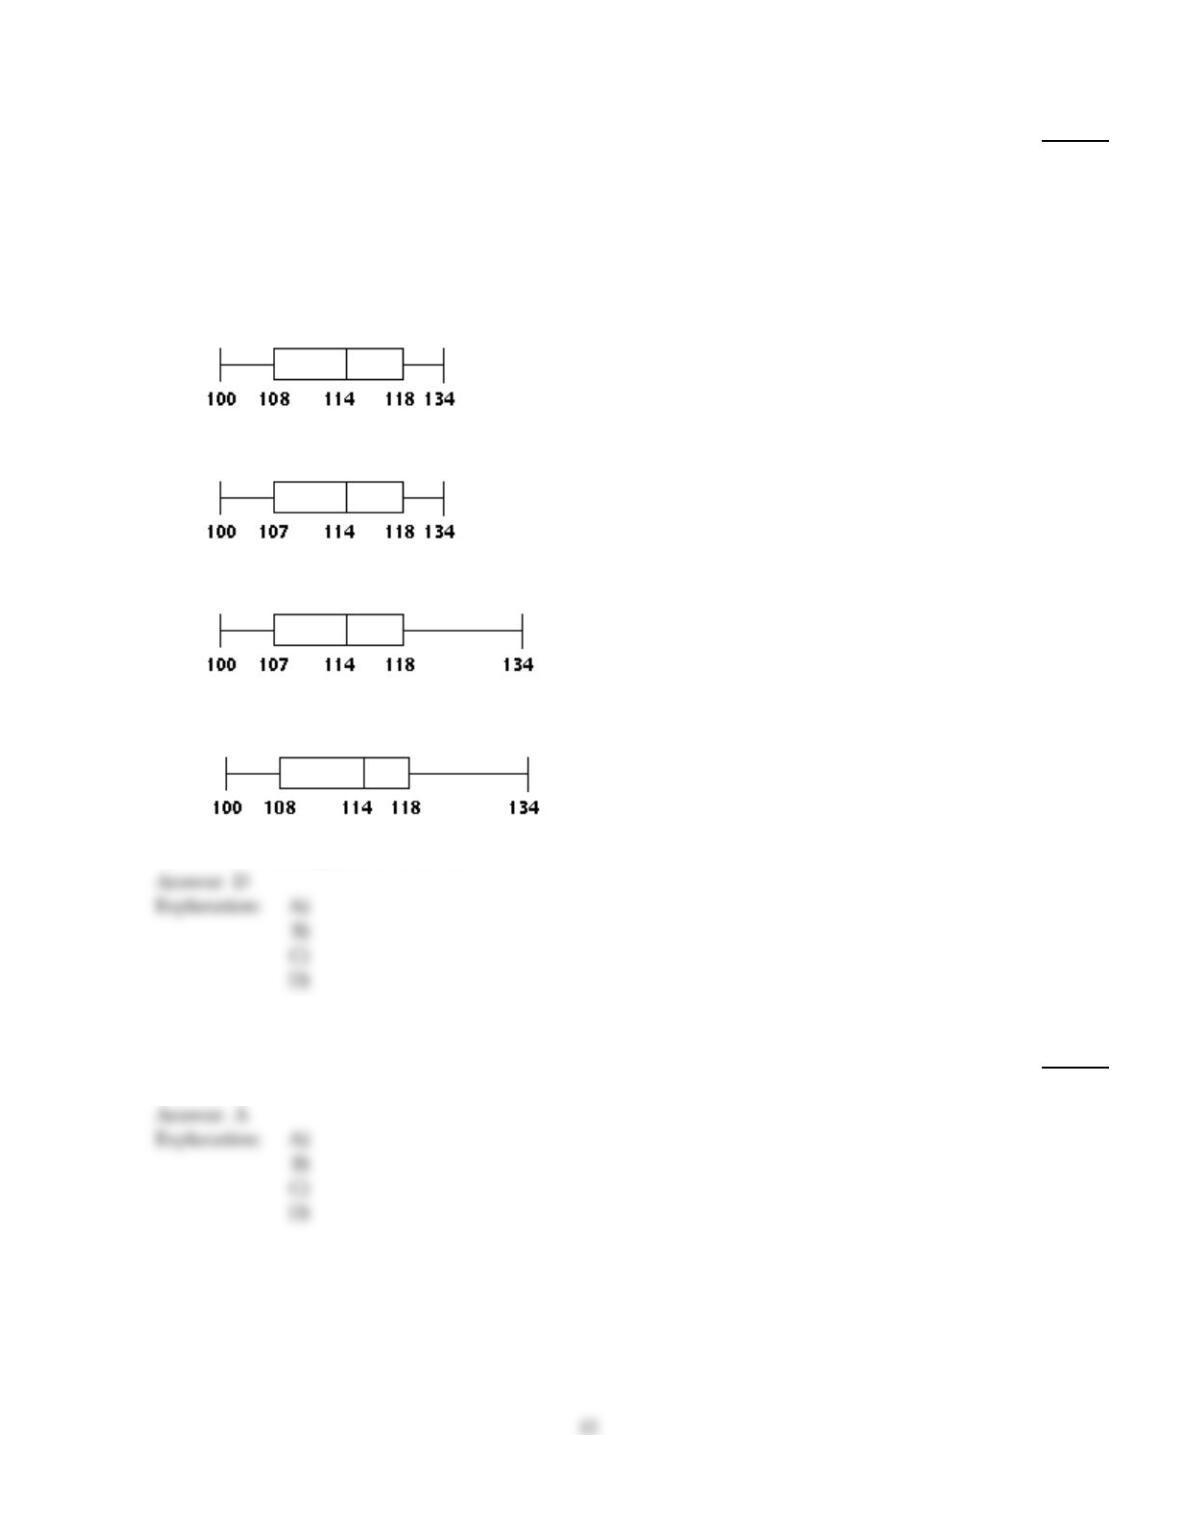
The highest temperatures ever recorded (in °F) in 32 different U.S. states are shown below.
Construct a boxplot for the data.
100 100 105 105 106 106 107 107
109 110 110 112 112 112 113 113
115 115 116 117 118 118 118 118
118 119 120 121 122 125 128 134
46)
A)
The data is fairly symmetrical.
B)
The data is fairly symmetrical.
C)
The data is slightly right–skewed.
D)
The data is slightly left–skewed.
Solve the problem. If necessary, round your answer to one more decimal place than that used for the observations.
47)
Let x1=14, x2=8, x3=13, x4=9, and x5=15. Find n.
47)
A)
5
B)
11.8
C)
4
D)
59
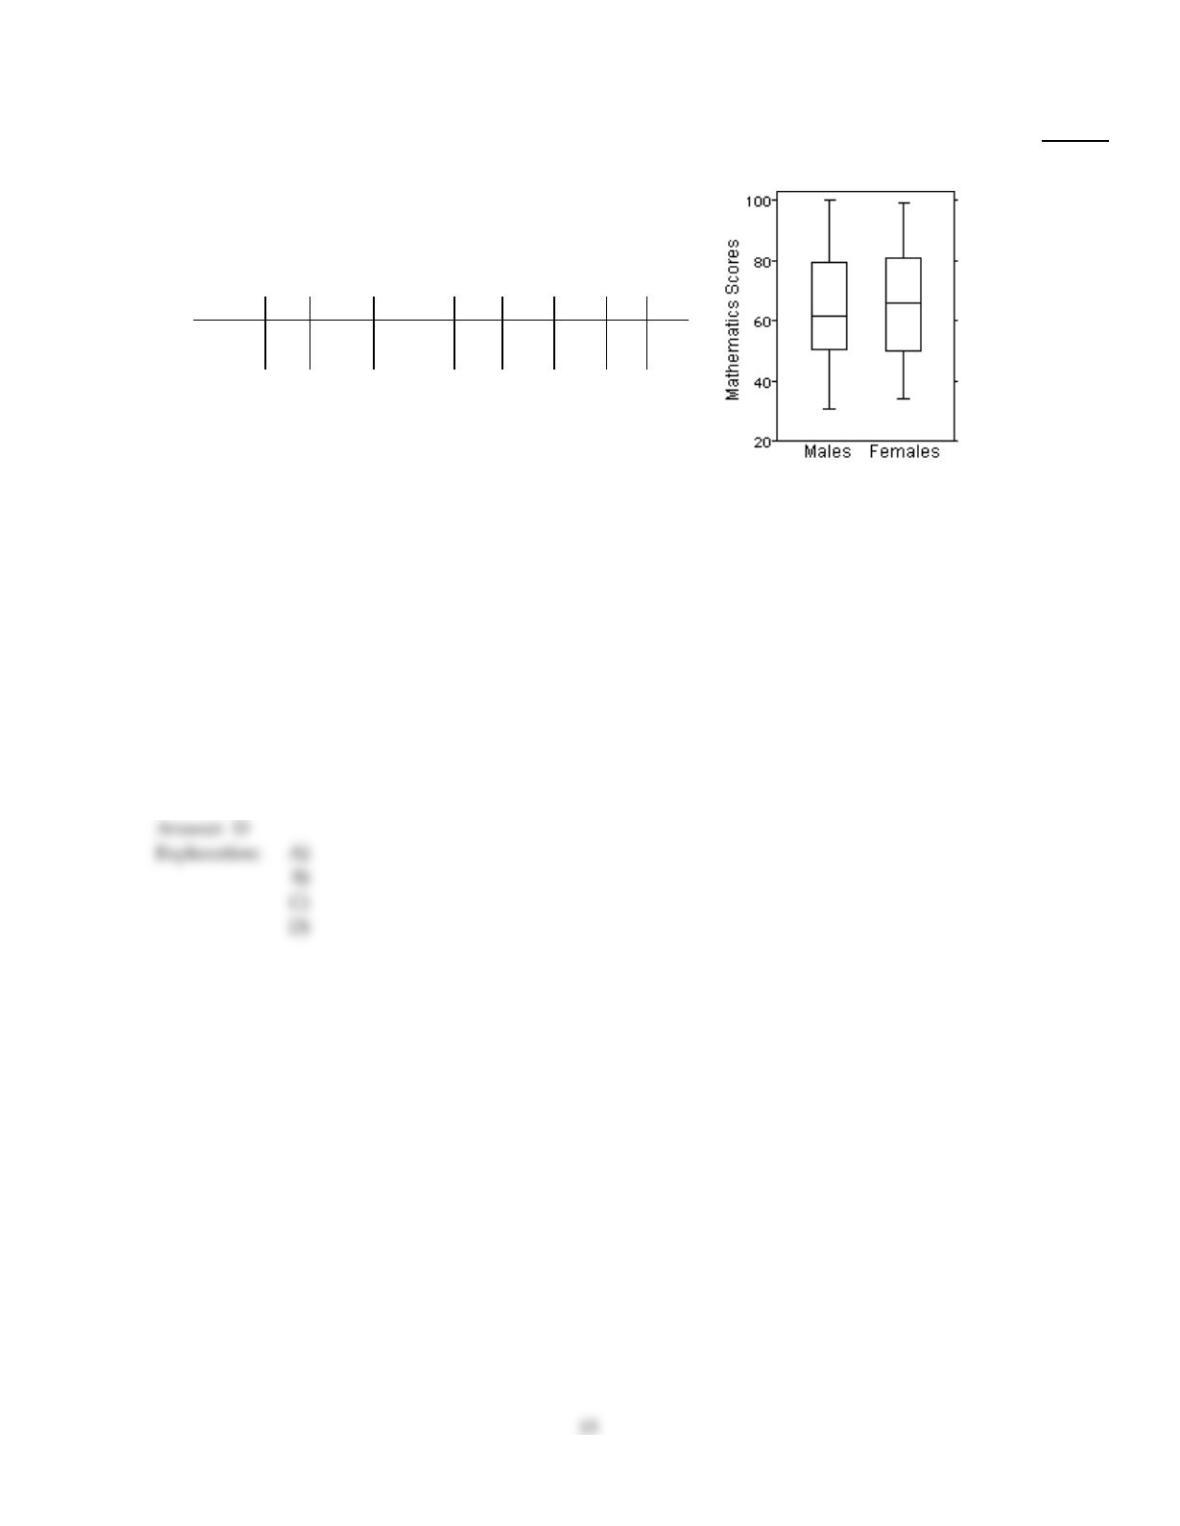
Solve the problem.
48)
Here are the summary statistics for mathematics scores for one high–school graduating class, and
the parallel boxplots comparing the scores of male and female students. Write a brief report on
these results. Be sure to discuss center and variation.
n Mean Median SD Min Max Q1 Q3
Male 17 60 63 18.6 30 100 52 78
Female 18 65 66 17.7 36 98 50 80
48)
A)
Median score by females at 66 points is 3 points higher than that by males. The middle 50%
for both group is close with a IQR at 26 for the males and 30 for the females. The males have a
larger range from 30 to 100. Both distributions are right–skewed.
B)
Median score by females at 66 points is 3 points higher than that by males. The middle 50%
for both group is close with a IQR at 30 for the males and 26 for the females. The males have a
smaller range from 36 to 98. The distribution is right–skewed for the males and symmetric for
the females.
C)
Median score by females at 66 points is 3 points higher than that by males. The middle 50%
for both group is close with a IQR at 26 for the males and 30 for the females. The males have a
smaller range from 36 to 98. Both distributions are left–skewed.
D)
Median score by females at 66 points is 3 points higher than that by males. The middle 50%
for both group is close with a IQR at 26 for the males and 30 for the females. The males have a
larger range from 30 to 100. The distribution is slightly right–skewed for the males and
symmetric for the females.
Provide an appropriate response.
49)
The manager of a bank recorded the amount of time each customer spent waiting in line during
peak business hours one Monday. The frequency distribution below summarizes the results. Find
the standard deviation. Round your answer to one decimal place.
Waiting time
(minutes) Number of
customer
0–under 4 10
4–under 8 11
8–under 12 11
12–under 16 16
16–under 20 0
20–under 24 2
49)
A)
5.2
B)
7.0
C)
5.5
D)
5.0
50)
Which score has a higher relative position, a score of 46.8 on a test with a mean of 40 and
a standard deviation of 4, or a score of 278.2 on a test with a mean of 260 and a a standard
deviation of 26? (Assume that the distributions being compared have approximately the same
shape.)
50)
A)
A score of 278.2
B)
A score of 46.8
C)
Both scores have the same relative position.
Solve the problem.
51)
A meteorological office keeps records of the annual precipitation in different cities. For one city, the
mean annual precipitation is 27.1 and the standard deviation of the annual precipitation amounts is
5.1. Let x represent the annual precipitation in that city. Determine the standardized version of x.
51)
A)
z = – 27.1
5.1
B)
x =z –27.1
5.1
C)
z =x –27.1
5.1
D)
z =x –5.1
27.1
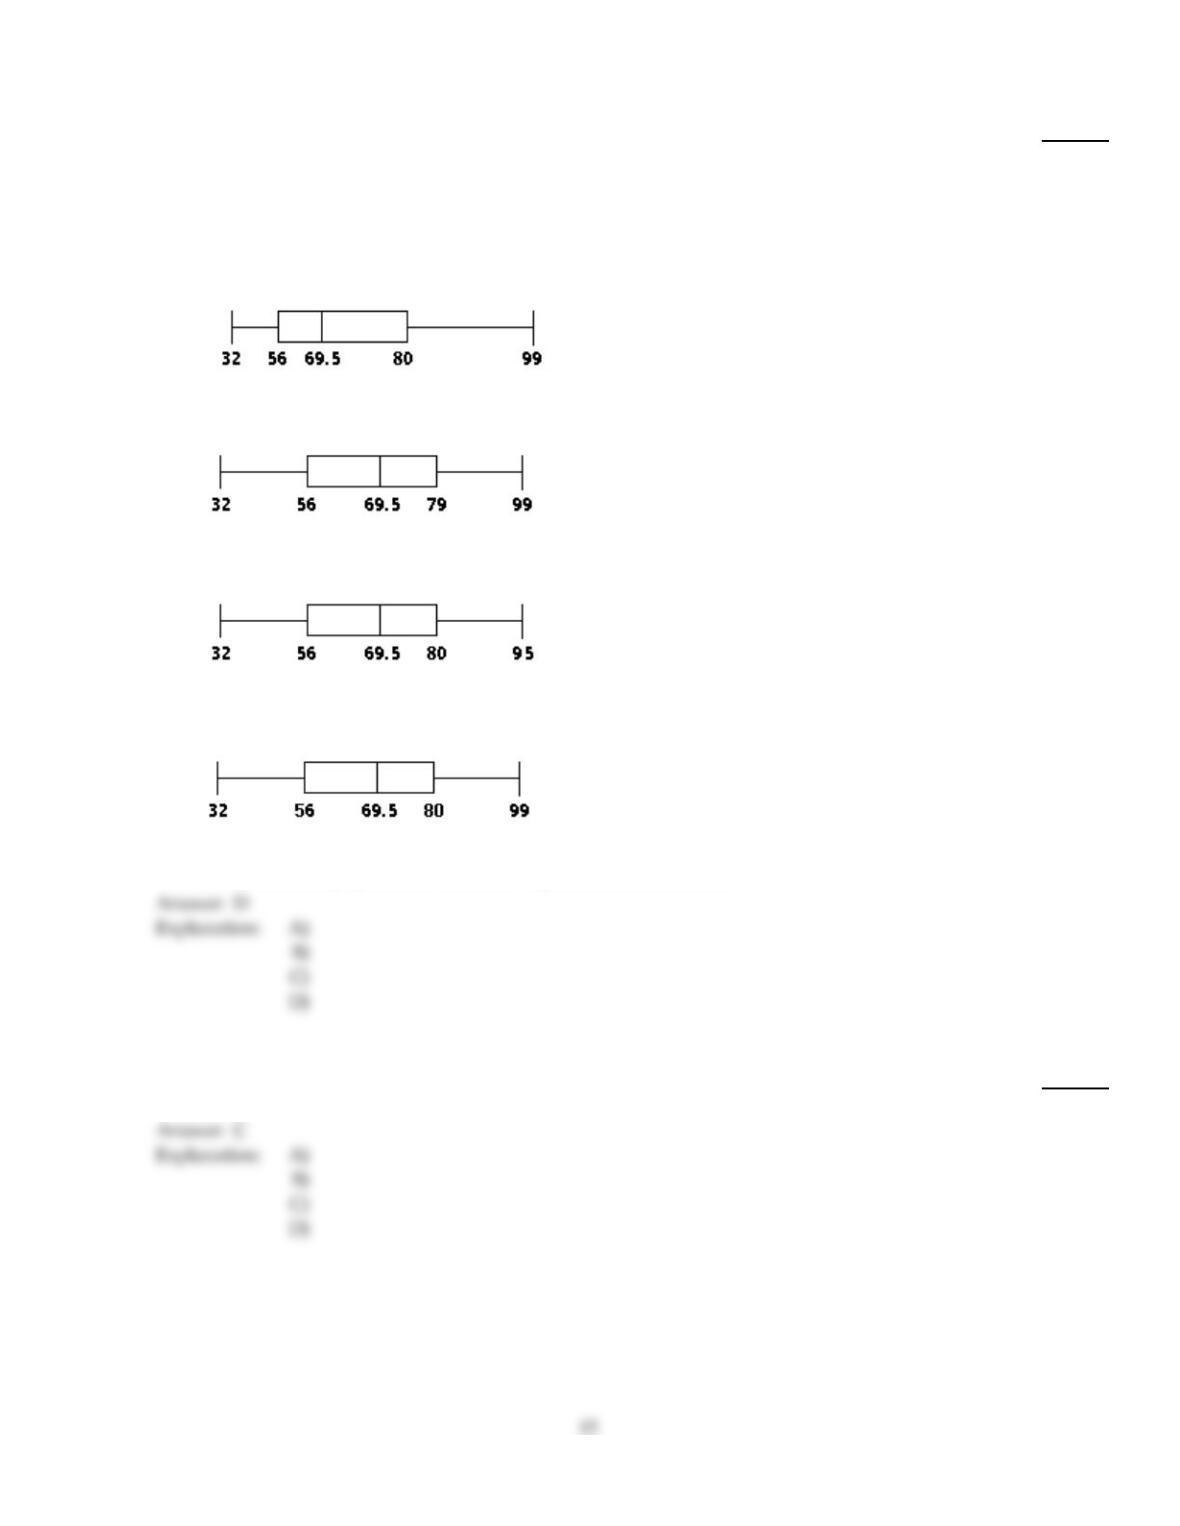
Construct and interpret a boxplot or a modified boxplot as specified.
52)
The test scores of 32 students are listed below. Construct a boxplot for the data.
32 37 41 44 46 48 53 55
57 57 59 63 65 66 68 69
70 71 74 74 75 77 78 79
81 82 83 86 89 92 95 99
52)
A)
The data is highly right–skewed
B)
The data is left–skewed.
C)
The data is fairly symmetrical. It is a fairly uniform distribution.
D)
The data is fairly symmetrical. It is a fairly uniform distribution.
Find the median for the given sample data.
53)
11, 13, 18, 21, 30, 30, 49
53)
A)
25.5
B)
30
C)
21
D)
18
Identify potential outliers, if any, for the given data.
54)
The ages of the 21 members of a track and field team are listed below.
15 18 18 19 22 23 24
24 24 24 25 26 26 27
28 28 30 32 33 40 42
54)
A)
40, 42
B)
15, 42
C)
42
D)
None
Provide an appropriate response.
55)
A teacher records the test scores for the 30 students in her class. The standard deviation of the
scores was 10. Corresponding to each score, she calculates a z–score. Hugh’s test score was one and
a half standard deviations below the mean. What would his z–score have been?
55)
A)
1.5
B)
–15
C)
15
D)
–1.5
56)
Find the z–score corresponding to the given value and use the z–score to determine whether the
value is unusual. Consider a score to be unusual if it is at least three standard deviations above or
below the mean. Round the z–score to one decimal place, if necessary.
A test score of 91.0 on a test having a mean of 73 and a standard deviation of 10.
56)
A)
–1.8; not unusual
B)
18; unusual
C)
1.8; not unusual
D)
1.8; unusual
Find the sample standard deviation for the given data. Round your final answer to one more decimal place than that used
for the observations.
57)
The manager of an electrical supply store measured the diameters of the rolls of wire in the
inventory. The diameters of the rolls (in m) are listed below.
0.504 0.65 0.329 0.561 0.509 0.644 0.116
57)
A)
1.5680 m
B)
1.7868 m
C)
0.1910 m
D)
0.5610 m
Find the median for the given sample data.
58)
1, 1, 29, 11, 48, 43, 42
58)
A)
29
B)
11
C)
42
D)
25
Solve the problem. If necessary, round your answer to one more decimal place than that used for the observations.
59)
The students in Hugh Logan‘s math class took the Scholastic Aptitude Test. Their math scores are
shown below. Find xi.
555 504 599 625
397 599 648 607
625 411 482
59)
A)
11
B)
5931
C)
6052
D)
6173
Obtain the five–number summary for the given data.
60)
The weekly salaries (in dollars) of sixteen government workers are listed below.
690 604 813 636
728 575 483 628
538 672 685 470
550 787 518 826
60)
A)
470, 541.00, 628, 718.5, 826 dollars
B)
470, 538, 628, 690, 826 dollars
C)
470, 544.0, 632.0, 709, 826 dollars
D)
470, 541.00, 632.0, 718.5, 826 dollars
Provide an appropriate response.
61)
Find the z–score corresponding to the given value and use the z–score to determine whether the
value is unusual. Consider a score to be unusual if it is at least three standard deviations above or
below the mean. Round the z–score to one decimal place, if necessary.
A time for the 100 meter sprint of 23.3 seconds at a school where the mean time for the 100 meter
sprint is 17.6 seconds and the standard deviation is 2.1 seconds.
61)
A)
5.7; unusual
B)
–2.7; not unusual
C)
2.7; unusual
D)
2.7; not unusual
Determine the quartile or interquartile range as specified.
62)
The test scores of 15 students are listed below. Find the first quartile, Q1.
42 49 51 56 59
62 67 68 74 80
85 87 90 94 95
62)
A)
54.75
B)
56
C)
53.5
D)
57.5
63)
The weekly salaries (in dollars) of sixteen government workers are listed below. Find the third
quartile, Q3.
492 778 545 840
506 753 605 822
673 900 450 581
704 473 657 527
63)
A)
$753
B)
$765.50
C)
$657
D)
$771.75
Solve the problem. If necessary, round your answer to one more decimal place than that used for the observations.
64)
Let x1=12, x2=14, x3=9, x4=16, and x5=11. Compute xi.
64)
A)
12.4
B)
62
C)
5
D)
51
Find the range for the given data set.
65)
The manager of an electrical supply store measured the diameters of the rolls of wire in the
inventory. The diameters of the rolls (in m) are listed below.
0.483 0.65 0.151
0.437 0.245 0.116
65)
A)
0.534 m
B)
0.483 m
C)
0.094 m
D)
0.116 m
Find the mode(s) for the given sample data.
66)
20, 29, 46, 29, 49, 29, 49
66)
A)
49
B)
29
C)
35.9
D)
46
Find the median for the given sample data.
67)
A new business had the following monthly net gains:
$6926 $1099 $2993 $7015 $8144
$3848 $1442 $8874 $4852 $4559
67)
A)
$5528.00
B)
$4852.00
C)
$4705.50
D)
$4975.20
Find the mean for the given sample data. Unless otherwise specified, round your answer to one more decimal place than
that used for the observations.
68)
Bill kept track of the number of hours he spent exercising each week. The results for four months are
shown below. Find the mean number of hours Bill spent exercising per week.
8.7 6.8 7.5 6.5 8.5 8.7
7.5 7.5 8.4 8.7 6.5 8.4
6.6 6.8 6.8 7.2 8.5 7.5
68)
A)
7.83 hr
B)
7.62 hr
C)
7.22 hr
D)
8.06 hr
Find the mode(s) for the given sample data.
69)
97, 25, 97, 13, 25, 29, 56, 97
69)
A)
54.9
B)
25
C)
42.5
D)
97
Construct and interpret a boxplot or a modified boxplot as specified.
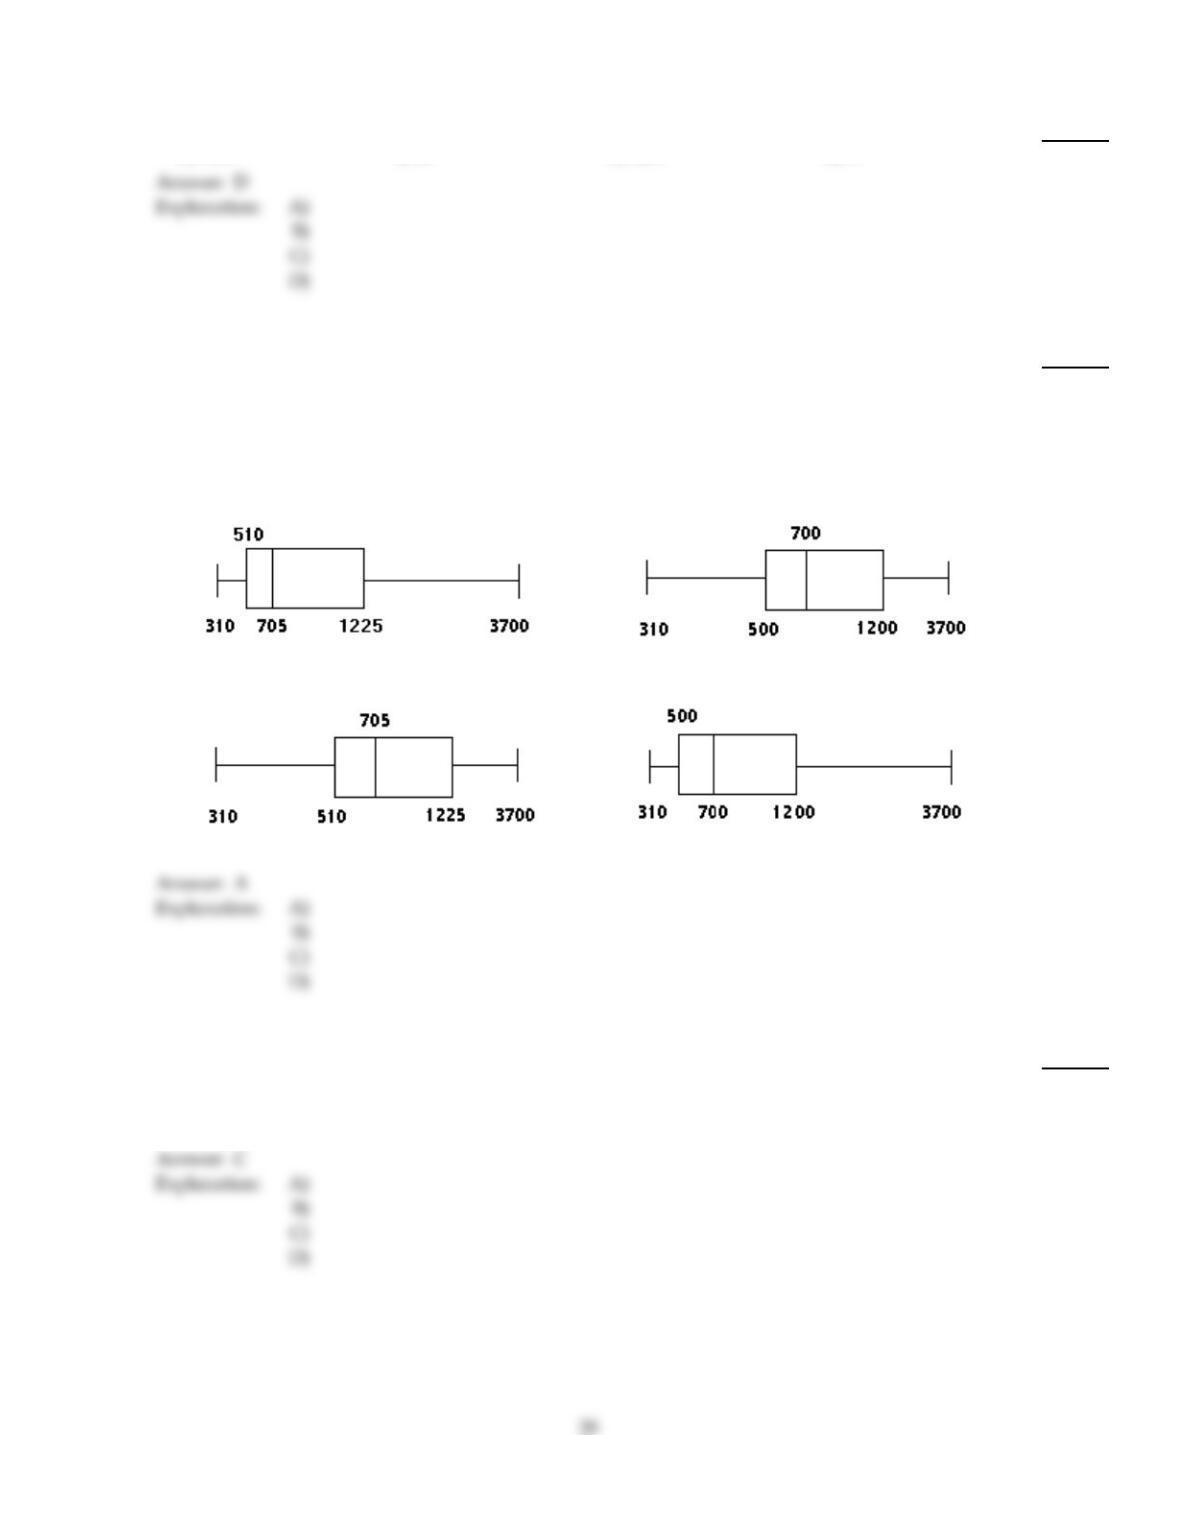
70)
The weekly salaries (in dollars) of 24 randomly selected employees of a company are shown below.
Construct a boxplot for the data.
310 320 450 460 470 500 520 540
580 600 650 700 710 840 870 900
1000 1200 1250 1300 1400 1720 2500 3700
70)
A)
The data is highly right–skewed.
B)
The data is fairly symmetrical.
C)
The data is fairly symmetrical.
D)
The data is highly right–skewed.
Use the empirical rule to solve the problem.
71)
The systolic blood pressure of 18–year–old women is a roughly bell–shaped distribution with a
mean of 120 mmHg and a standard deviation of 12 mmHg. What percentage of 18–year–old
women have a systolic blood pressure between 96 mmHg and 144 mmHg?
71)
A)
99.99%
B)
68%
C)
95%
D)
99.7%
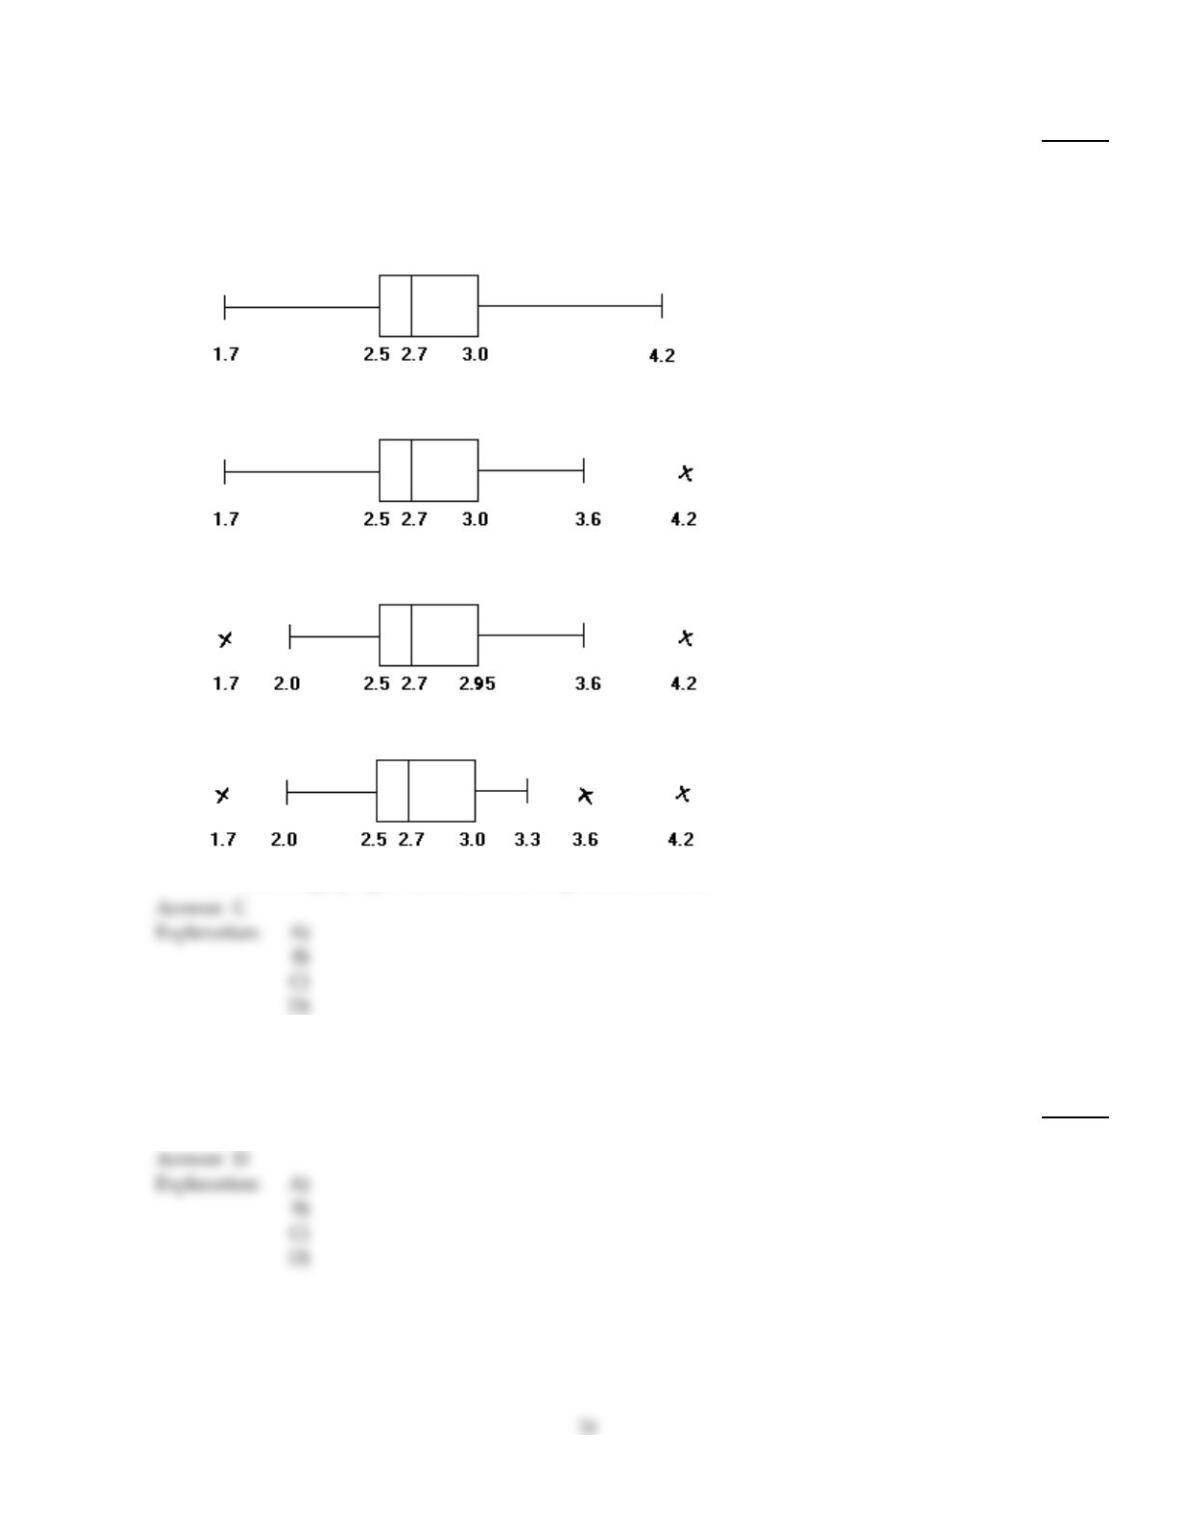
Construct and interpret a boxplot or a modified boxplot as specified.
72)
The weights (in ounces) of 27 tomatoes are listed below. Construct a modified boxplot for the data.
1.7 2.0 2.2 2.2 2.4 2.5 2.5 2.5 2.6
2.6 2.6 2.6 2.6 2.7 2.8 2.8 2.8 2.9
2.9 2.9 3.0 3.0 3.1 3.1 3.3 3.6 4.2
72)
A)
The data is roughly symmetrical, possibly bell–shaped, with no potential outliers.
B)
The data is left–skewed and has one potential outlier.
C)
The data is roughly symmetrical and has two potential outliers.
D)
The data is highly right–skewed with three potential outliers.
Find the sample standard deviation for the given data. Round your final answer to one more decimal place than that used
for the observations.
73)
22, 29, 21, 24, 27, 28, 25, 36
73)
A)
2.8
B)
4.2
C)
1.6
D)
4.8
Provide an appropriate response.
74)
Find the z–score corresponding to the given value and use the z–score to determine whether the
value is unusual. Consider a score to be unusual if it is at least three standard deviations above or
below the mean. Round the z–score to one decimal place, if necessary.
The mean height of a basketball team is 6.3 feet with a standard deviation of 0.2 feet. The team’s
center is 7 feet tall.
74)
A)
3, not unusual
B)
3.85, unusual
C)
3.5, unusual
D)
2.98, not unusual
75)
Find the z–score corresponding to the given value and use the z–score to determine whether the
value is unusual. Consider a score to be unusual if it is at least three standard deviations above or
below the mean. Round the z–score to one decimal place, if necessary.
A body temperature of 95.8° F given that human body temperatures have a mean of 98.20° F and a
standard deviation of 0.62°.
75)
A)
–2.4; not usual
B)
–3.8; unusual
C)
–3.8; not unusual
D)
3.8; not unusual
D)
Solve the problem.
76)
A meteorological office keeps records of the annual precipitation in different cities. For one city, the
mean annual precipitation is 25.2 and the standard deviation of the annual precipitation amounts is
3.7. Let x represent the annual precipitation in that city. Determine the z–score for an annual
precipitation in that city of 24.8 inches. Round your final answer to two decimal places.
76)
A)
0.84
B)
0.11
C)
13.51
D)
–0.11
D)
Find the mean for the given sample data. Unless otherwise specified, round your answer to one more decimal place than
that used for the observations.
77)
Six college students spent $208.67, $224.71, $249.78, $143.07, $124.55, and $149.31 respectively for
books. Compute the mean amount spent. Round your answer to the nearest cent.
77)
A)
$220.02
B)
$183.35
C)
$275.02
D)
$208.02
D)
D)
Solve the problem.
78)
A variable x has a mean, µ, of 21 and a standard deviation, , of 2. Determine the standardized
version of x.
78)
A)
z =x –2
21
B)
x =z –21
2
C)
z =x –21
2
D)
z = – 21
2
Determine the quartile or interquartile range as specified.
79)
The weights (in pounds) of 17 randomly selected adults are given below. Find the interquartile
range.
144 165 187 143 119 132
127 156 179 159 180 202
114 146 151 168 173
79)
A)
38 lb
B)
37.5 lb
C)
37 lb
D)
30 lb
80)
The normal annual precipitation (in inches) is given below for 21 different U.S. cities. Find the first
quartile, Q1.
39.1 16.5 25.4 18.2 27.1 27.8 30.6
15.3 42.6 18.2 13.1 19.3 32.3 10.3
14.9 33.6 12.7 35.0 22.3 11.3 51.7
80)
A)
15.10 in.
B)
15.000 in.
C)
15.3 in.
D)
14.9 in.
Find the mode(s) for the given sample data.
81)
The weights (in ounces) of 14 different apples are shown below.
5.9 6.1 4.3 6.9 4.0 5.9 6.1
6.9 5.8 6.9 5.9 6.9 6.9 5.6
81)
A)
5.9 oz
B)
6.40 oz
C)
6.9 oz
D)
5.9 oz, 6.9 oz
Find the range for the given data set.
82)
Rich Borne is currently taking Chemistry 101. On the five laboratory assignments for the quarter, he
got the following scores.
26 37 13 46 52
82)
A)
11
B)
52
C)
13
D)
39
Provide an appropriate response.
83)
The heights of a group of professional basketball players are summarized in the frequency
distribution below. Find the standard deviation. Round your answer to one decimal place.
Height (in.) Frequency
70–under 72 3
72–under 74 7
74–under 76 16
76–under 78 12
78–under 80 10
80–under 82 4
82–under 84 1
83)
A)
3.2
B)
2.9
C)
3.3
D)
2.8
Identify potential outliers, if any, for the given data.
84)
The weekly salaries (in dollars) of 24 randomly selected employees of a company are shown below.
310 320 450 460 470 500 520 540
580 600 650 700 710 840 870 900
1000 1200 1250 1300 1400 1720 2500 3700
84)
A)
2500
B)
3700
C)
310, 2500, 3700
D)
2500, 3700
Find the mode(s) for the given sample data.
85)
The speeds (in mi/h) of the cars passing a certain checkpoint are measured by radar. The results are
shown below.
42.6 43.0 42.9 42.5 41.8
41.8 43.0 44.8 44.4 42.5
42.6 44.8 42.5 44.3 43.0
42.1 42.1 42.9 41.5 42.6
85)
A)
42.6 mi/hr, 42.5 mi/hr, 43.0 mi/hr
B)
42.70 mi/hr
C)
42.6 mi/hr
D)
43.0 mi/hr
Find the sample standard deviation for the given data. Round your final answer to one more decimal place than that used
for the observations.
86)
The manager of a small dry cleaner employs six people. As part of their personnel file, she asked
each one to record to the nearest one–tenth of a mile the distance they travel one way from home to
work. The six distances are listed below.
22.7 19.7 45.2 47.8 16.5 20.7
86)
A)
13.91 mi
B)
5932.00 mi
C)
46.50 mi
D)
4965.13 mi
Find the mean for the given sample data. Unless otherwise specified, round your answer to one more decimal place than
that used for the observations.
87)
15, 7, 23, 15
87)
A)
22.3
B)
15.5
C)
15
D)
13.5
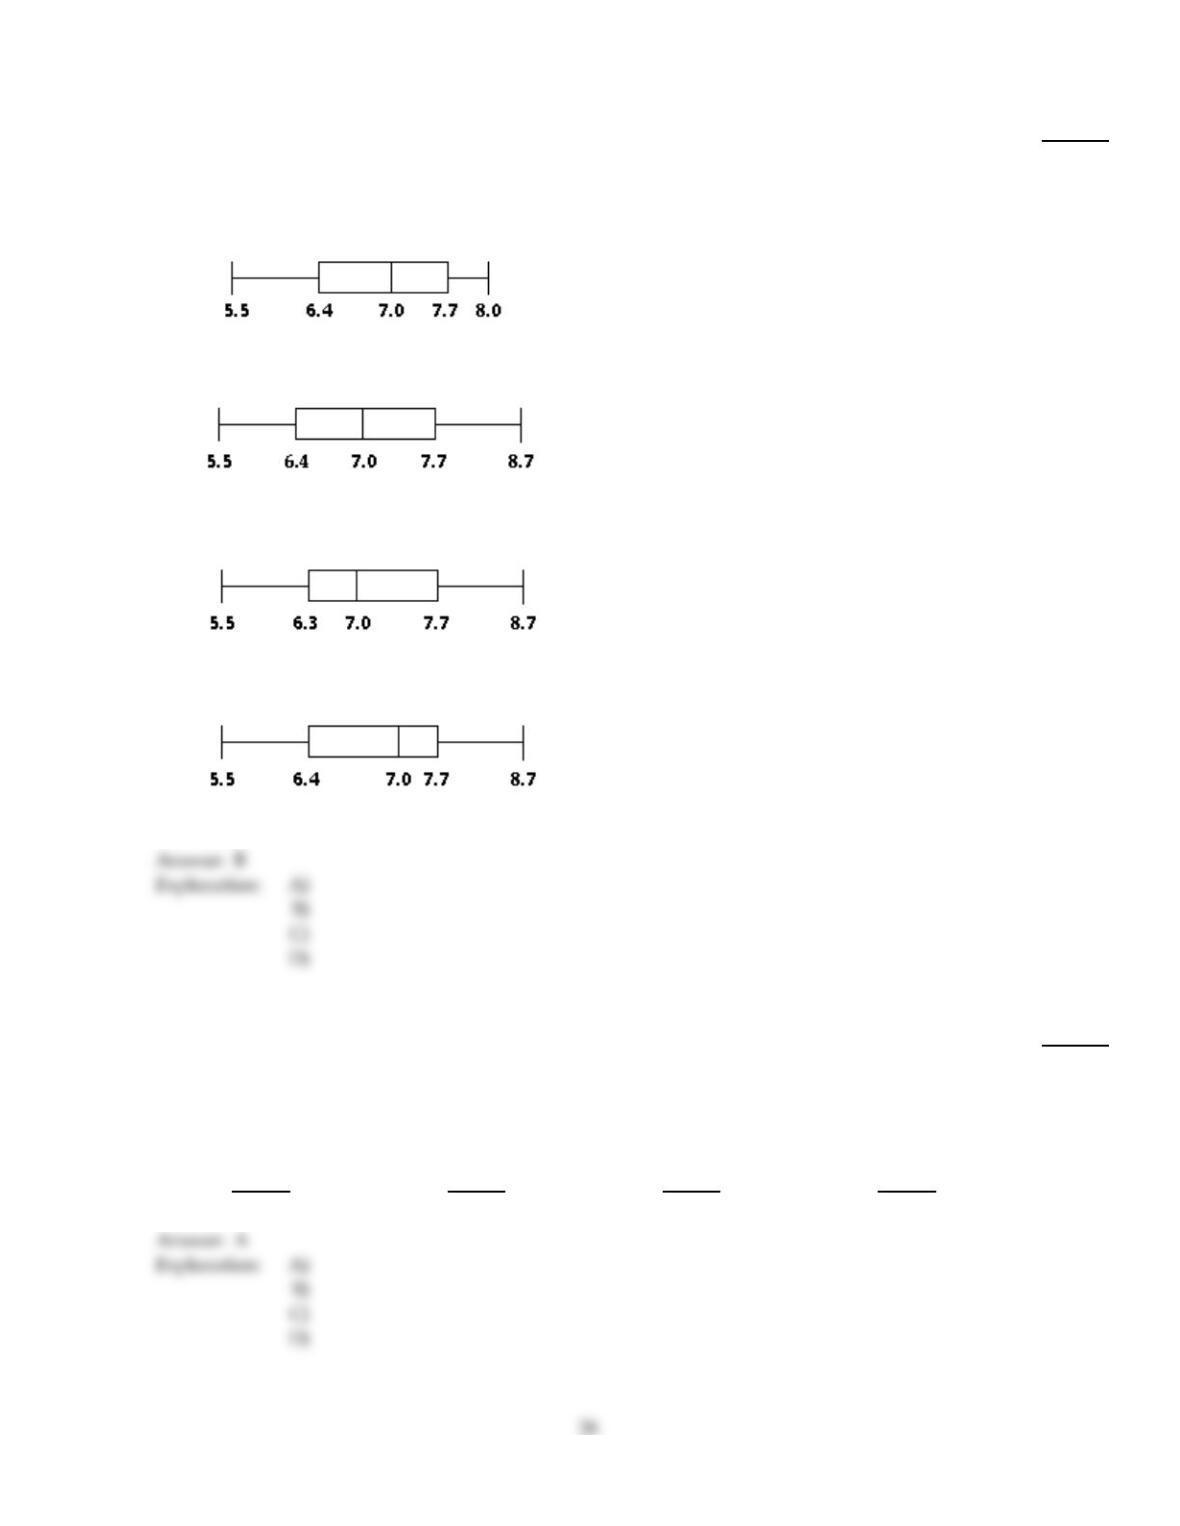
Construct and interpret a boxplot or a modified boxplot as specified.
88)
The weights (in pounds) of 30 newborn babies are listed below. Construct a boxplot for the data.
5.5 5.7 5.8 5.9 6.1 6.1 6.3 6.4 6.5 6.6
6.7 6.7 6.7 6.9 7.0 7.0 7.0 7.1 7.2 7.2
7.4 7.5 7.7 7.7 7.8 8.0 8.1 8.1 8.3 8.7
88)
A)
The data is slightly left–skewed.
B)
The data is highly symmetrical. It is a uniform distribution.
C)
The data is slightly right–skewed.
D)
The data is left–skewed.
Solve the problem.
89)
A variable x has the possible observations shown below.
Possible observations of x: –3 –1 0 1 1 2 4 4 5
Determine the standardized version of x.
Round the values of µ and to one decimal place.
89)
A)
z =x – 1.4
2.5
B)
z =x – 1.4
2.6
C)
x =z – 1.4
2.6
D)
z =x – 2.5
1.4
Find the range and standard deviation for each of the two samples, then compare the two sets of results.
90)
When investigating times required for drive–through service, the following results (in seconds)
were obtained.
Restaurant A 120 123 153 128 124 118 154 110
Restaurant B 115 126 147 156 118 110 145 137
90)
A)
Restaurant A: 46; 16.9
Restaurant B: 44; 16.2
Both measures indicate there is more variation in the data for restaurant A than the data for
restaurant B.
B)
Restaurant A: 44; 16.2
Restaurant B: 46; 16.9
Both measures indicate there is more variation in the data for restaurant B than the data for
restaurant A.
C)
Restaurant A: 46; 16.2
Restaurant B: 44; 16.9
It is inconclusive as to which data set has more variation.
D)
Restaurant A: 44; 16.1
Restaurant B: 46; 16.9
Both measures indicate there is more variation in the data for restaurant B than the data for
restaurant A.
Solve the problem.
91)
The heights of the adults in one town have a mean of 67.5 inches and a standard deviation of 3.5
inches. What can you conclude from Chebyshev‘s rule about the percentage of adults in the town
whose heights are between 60.5 and 74.5 inches?
91)
A)
The percentage is at most 95%
B)
The percentage is at least 75%
C)
The percentage is at most 75%
D)
The percentage is at least 95%
Find the range for the given data set.
92)
The owner of a small manufacturing plant employs six people. As part of their personnel file, she
asked each one to record to the nearest one–tenth of a mile the distance they travel one way from
home to work. The six distances are listed below.
2.7 5.3 1.3 4.5 6.9 3.5
92)
A)
5.6 mi
B)
5.3 mi
C)
0.8 mi
D)
1.3 mi
Solve the problem.
93)
The ages of the members of a gym have a mean of 46 years and a standard deviation of 12 years.
What can you conclude from Chebyshev’s theorem about the percentage of gym members aged
between 18.4 and 73.6?
93)
A)
The percentage is at least 56.5%
B)
The percentage is at least 81.1%
C)
The percentage is at most 81.1%
D)
The percentage is approximately 56.5%
Solve the problem. If necessary, round your answer to one more decimal place than that used for the observations.
94)
Let x1=16, x2=3, x3=9, x4=15, and x5=8. Determine x.
94)
A)
51
B)
10.2
C)
5
D)
12.8
Find the mean for the given sample data. Unless otherwise specified, round your answer to one more decimal place than
that used for the observations.
95)
16, 11, 7, 9, 7, 3, 4
95)
A)
8.1
B)
7.6
C)
9.5
D)
9.6
Obtain the five–number summary for the given data.
96)
1, 3, 5, 7, 10
96)
A)
1, 3.5, 5, 7.5, 10
B)
1, 3, 5, 7, 10
C)
1, 1, 5, 10, 10
D)
1, 2.5, 5, 6.5, 10
Solve the problem. If necessary, round your answer to one more decimal place than that used for the observations.
97)
A sample of non–recyclable waste shipping companies in a certain state yielded the following
amounts, in tons, of waste shipped during 2005. Determine n, xi, and x.
1186 480 891 700
851 1288 574 1118
467 639 734 812
97)
A)
n = 12;
xi=9740;
x=811.7
B)
n = 12;
xi=9740;
x=885.5
C)
n =11;
xi=9740;
x=885.5
D)
n =11;
xi=9740;
x=811.7
Find the median for the given sample data.
98)
The salaries of ten randomly selected doctors are shown below.
$148,000 $129,000 $187,000 $209,000 $245,000
$135,000 $112,000 $781,000 $217,000 $190,000
98)
A)
$187,000
B)
$235,000
C)
$188,500
D)
$261,000
Answer Key
Testname: C3
30
Answer Key
Testname: C3
31
Answer Key
Testname: C3
Answer Key
Testname: C3