
94.
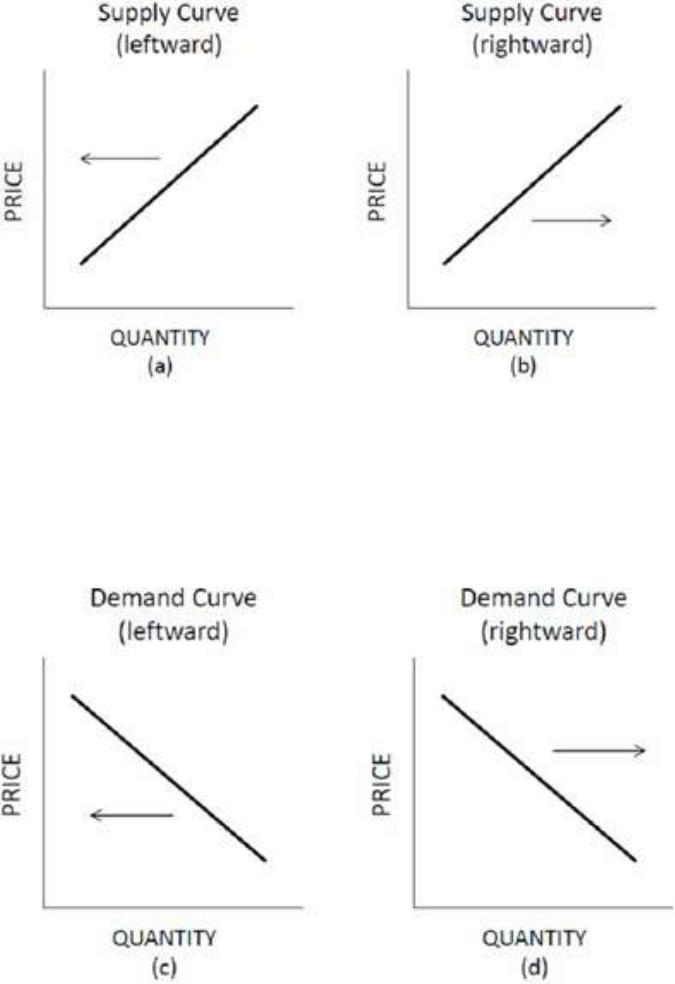
Choose the letter of the diagram in Figure 3.1 that best describes the type of shift that would occur in each
situation for the market listed on the left, ceteris paribus.
Figure 3.1 Shifts of Supply and Demand Steel: the government introduces environmental restrictions on the
dumping of wastes from producing steel.

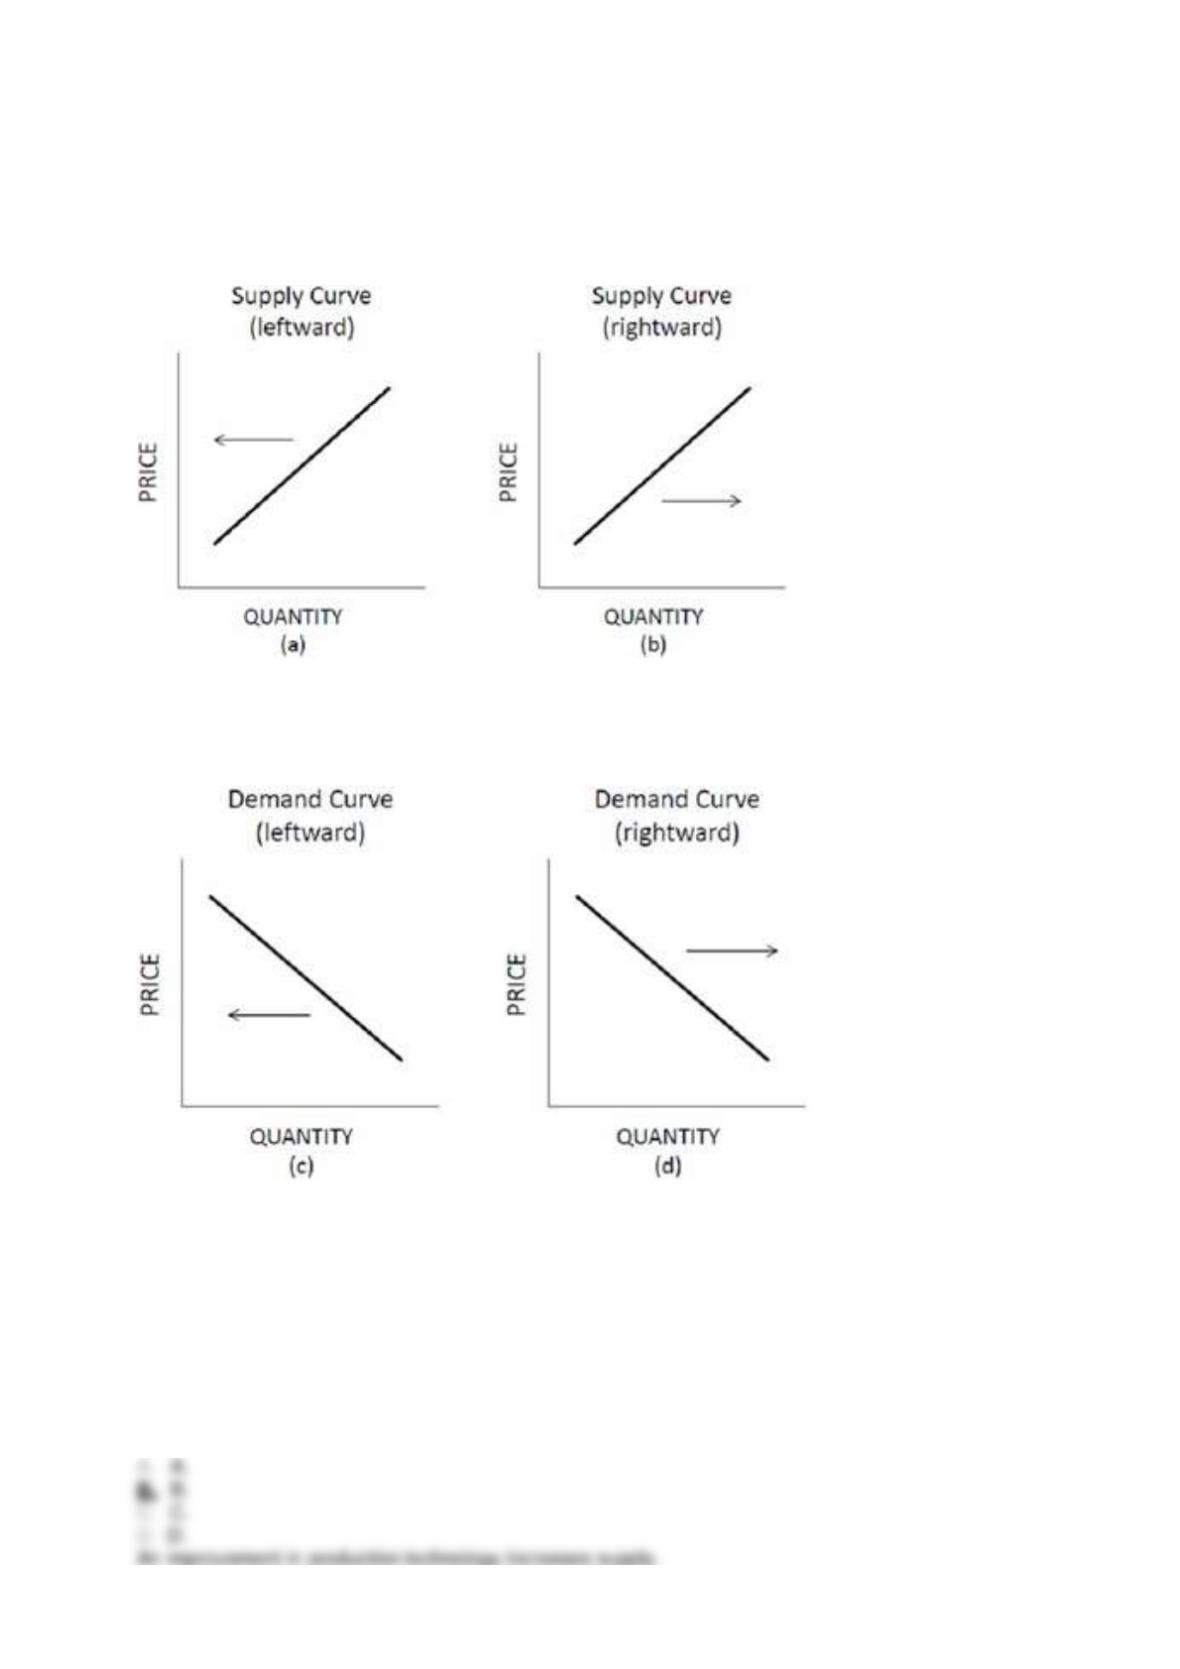
95.
Choose the letter of the diagram in Figure 3.1 that best describes the type of shift that would occur in each
situation for the market listed on the left, ceteris paribus.
Figure 3.1 Shifts of Supply and Demand Flat-screen TVs: the technology required for flat-screen TVs
production becomes cheaper.

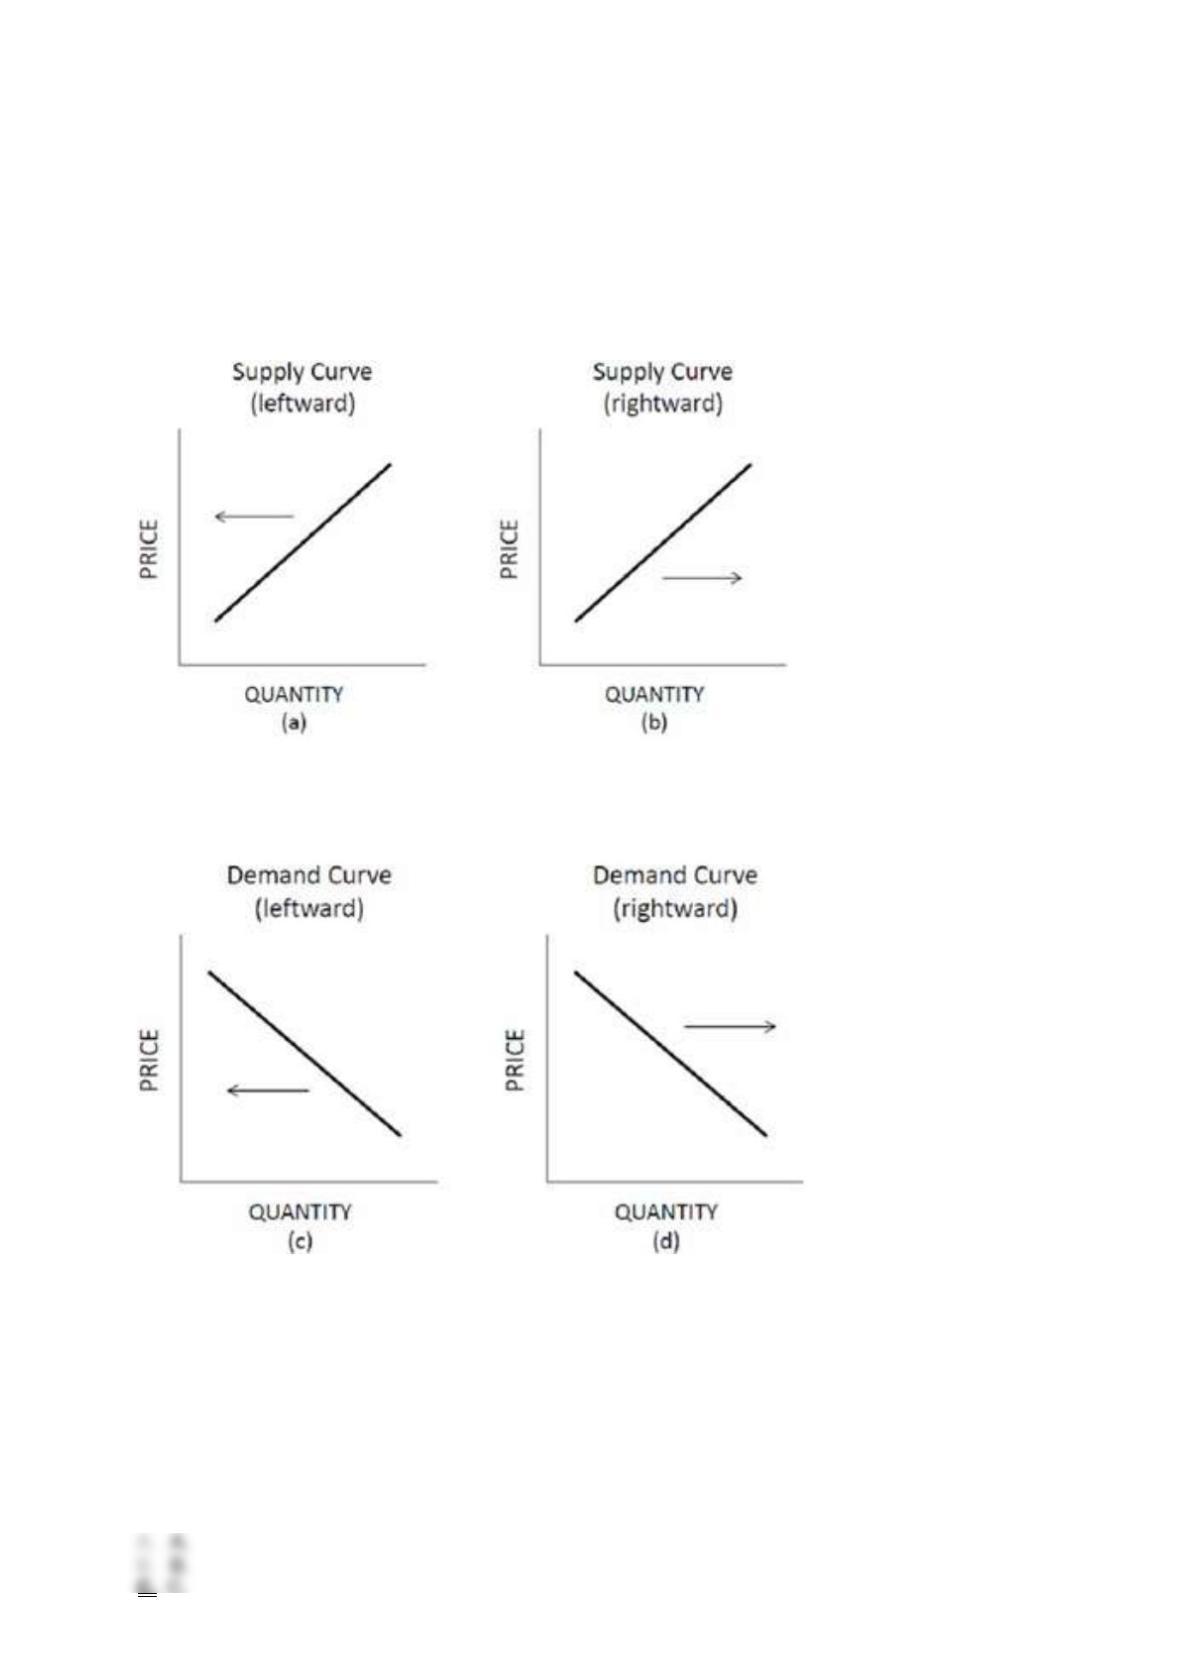
96.
Choose the letter of the diagram in Figure 3.1 that best describes the type of shift that would occur in each
situation for the market listed on the left, ceteris paribus.
Figure 3.1 Shifts of Supply and Demand Candy bars: People become more health–conscious and prefer power
bars instead of candy bars.

97.
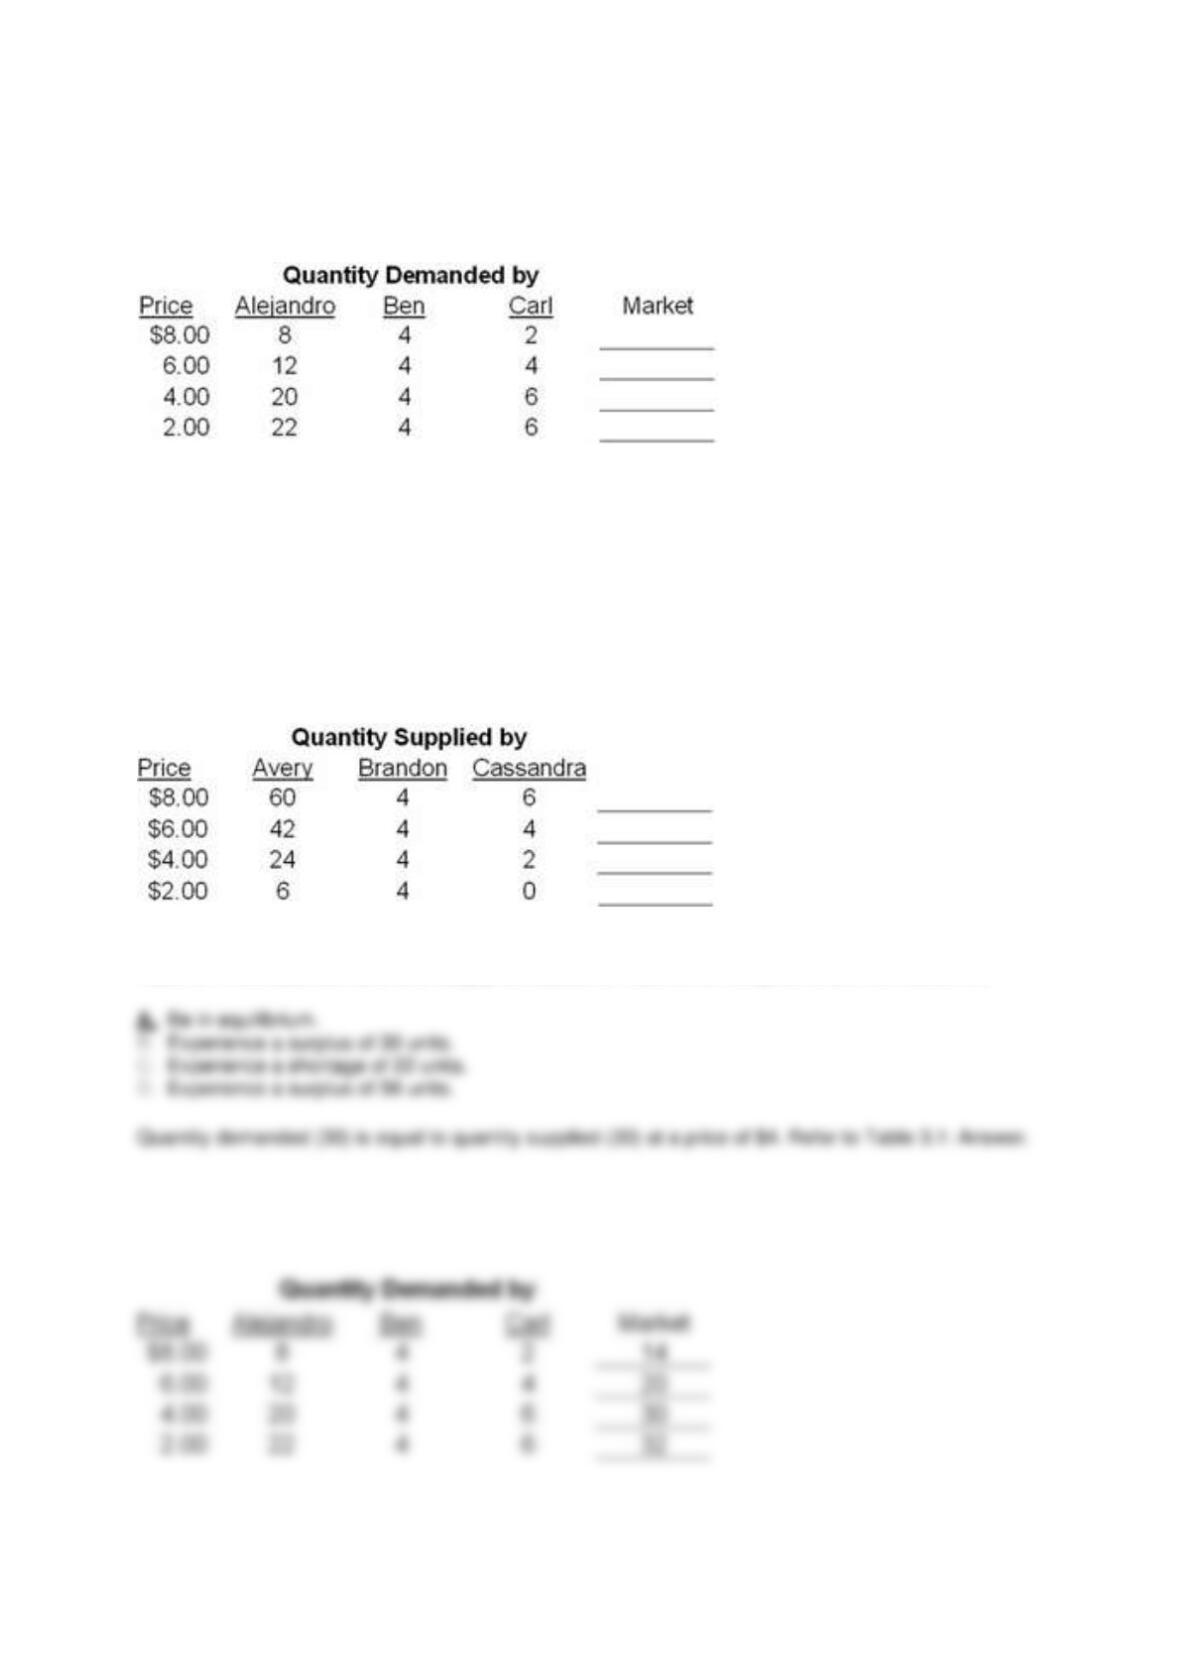
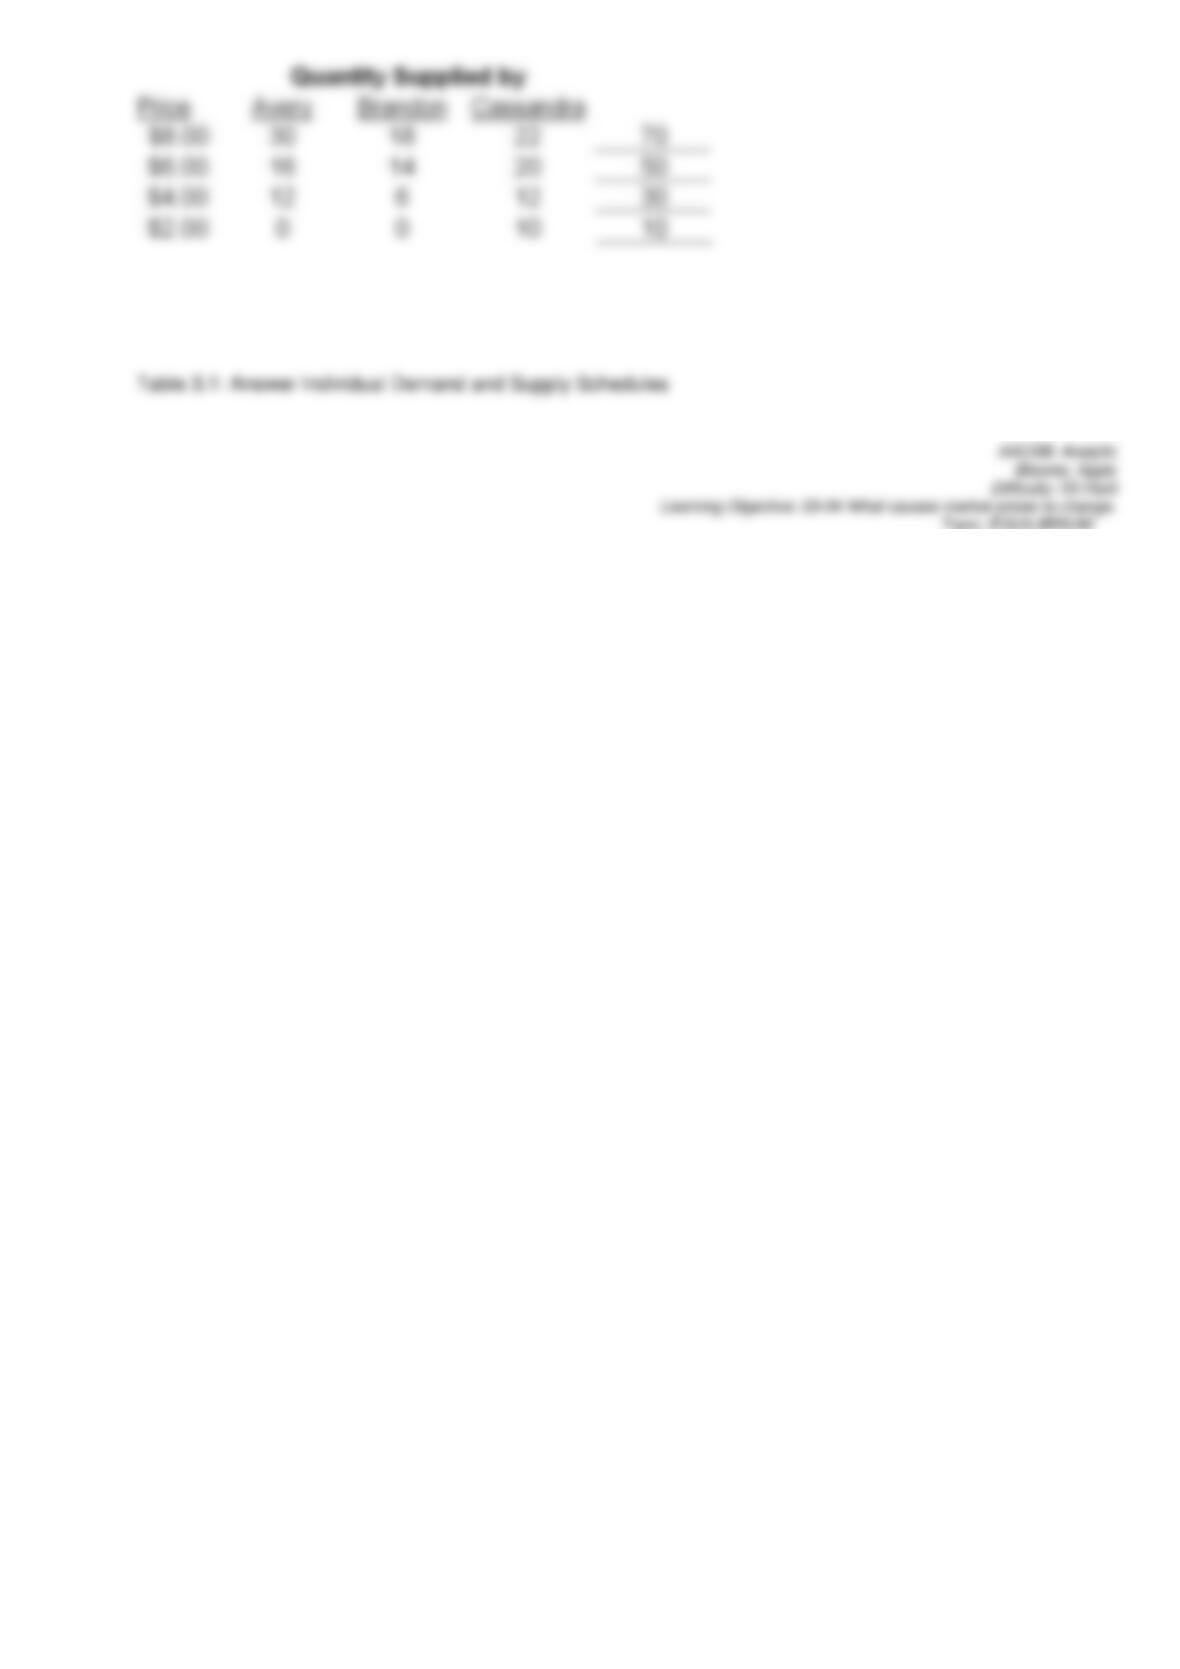
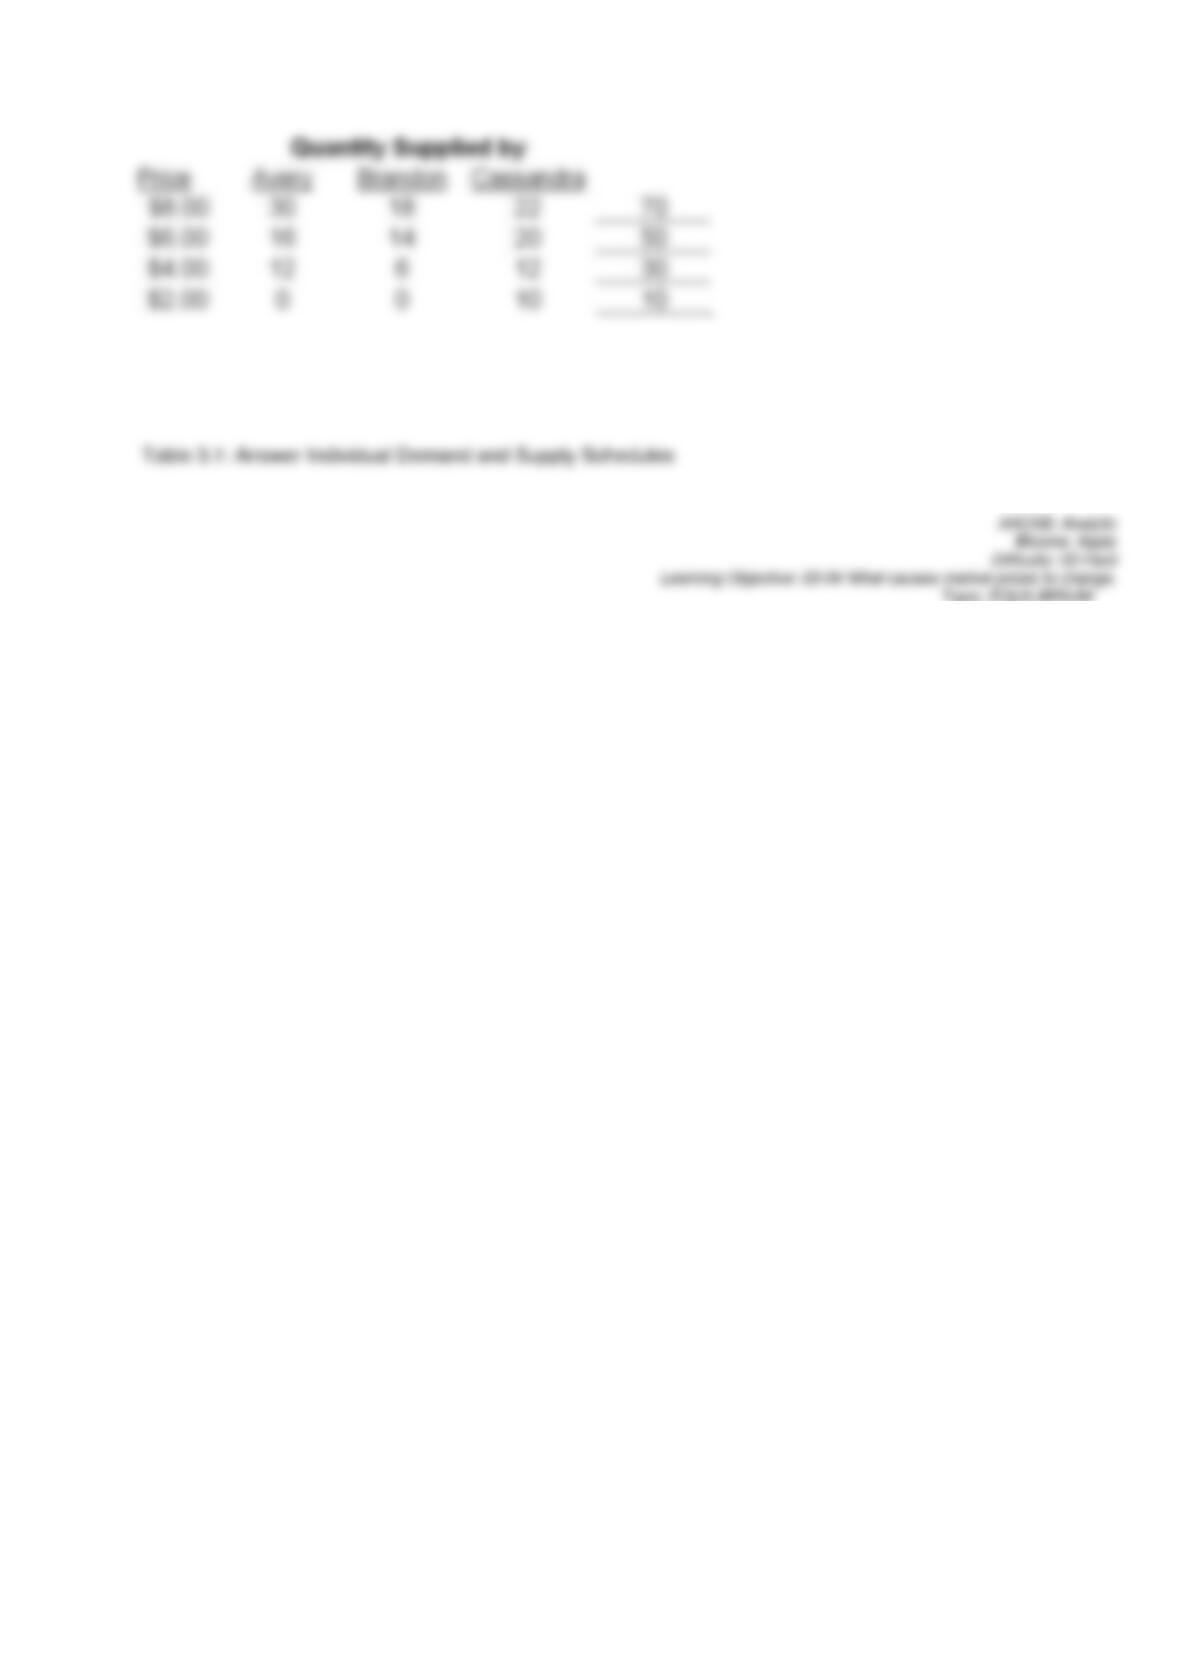
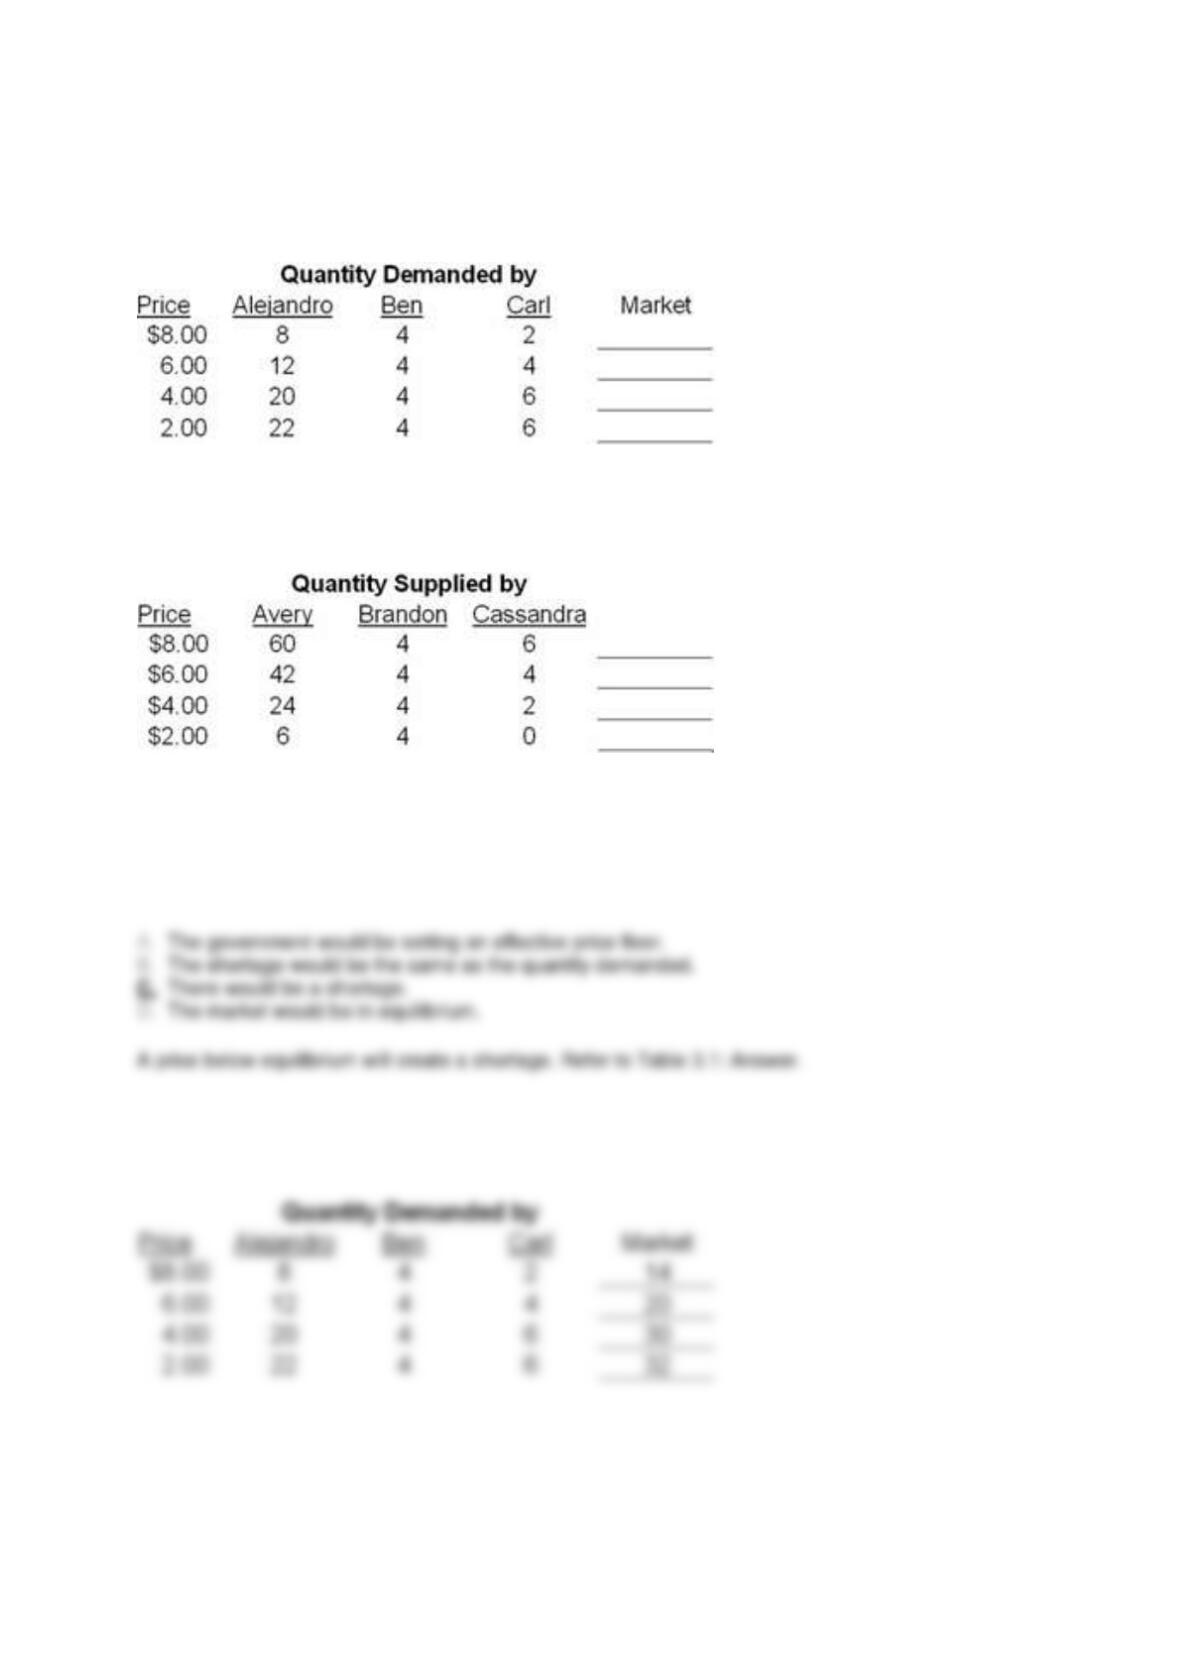
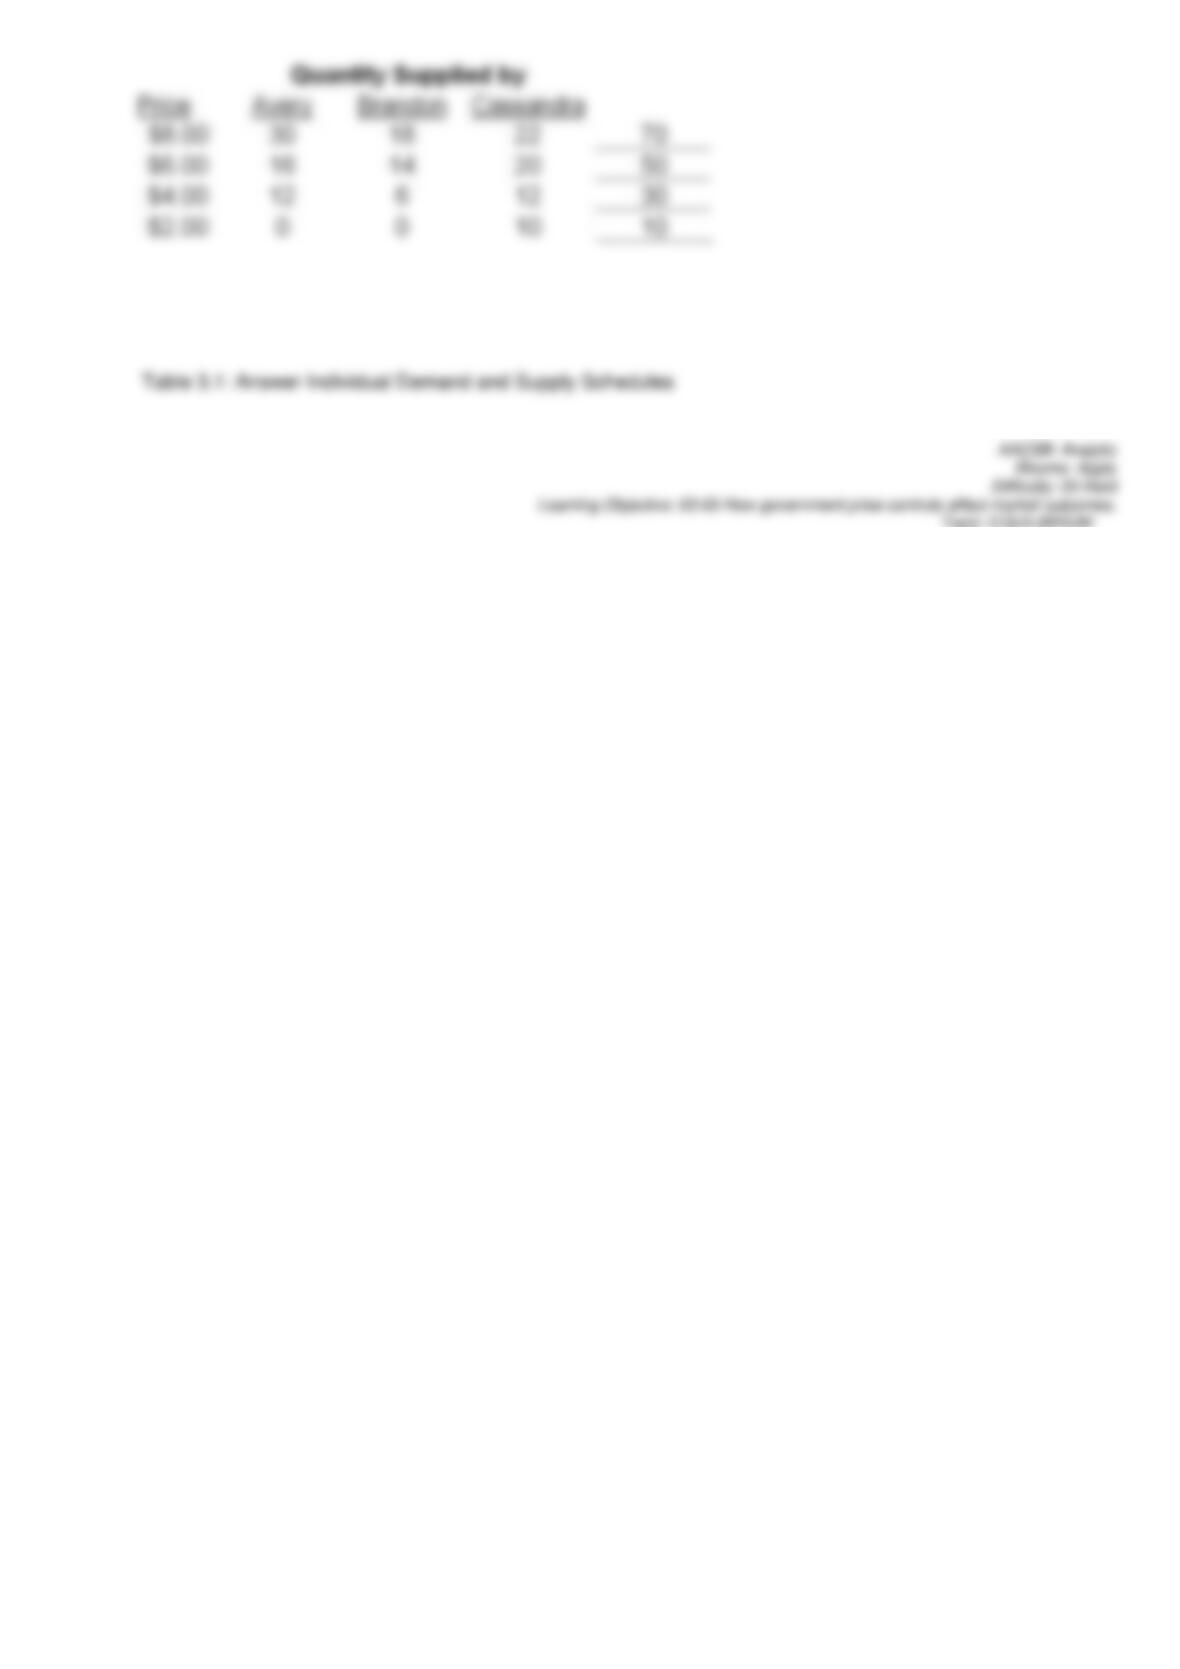
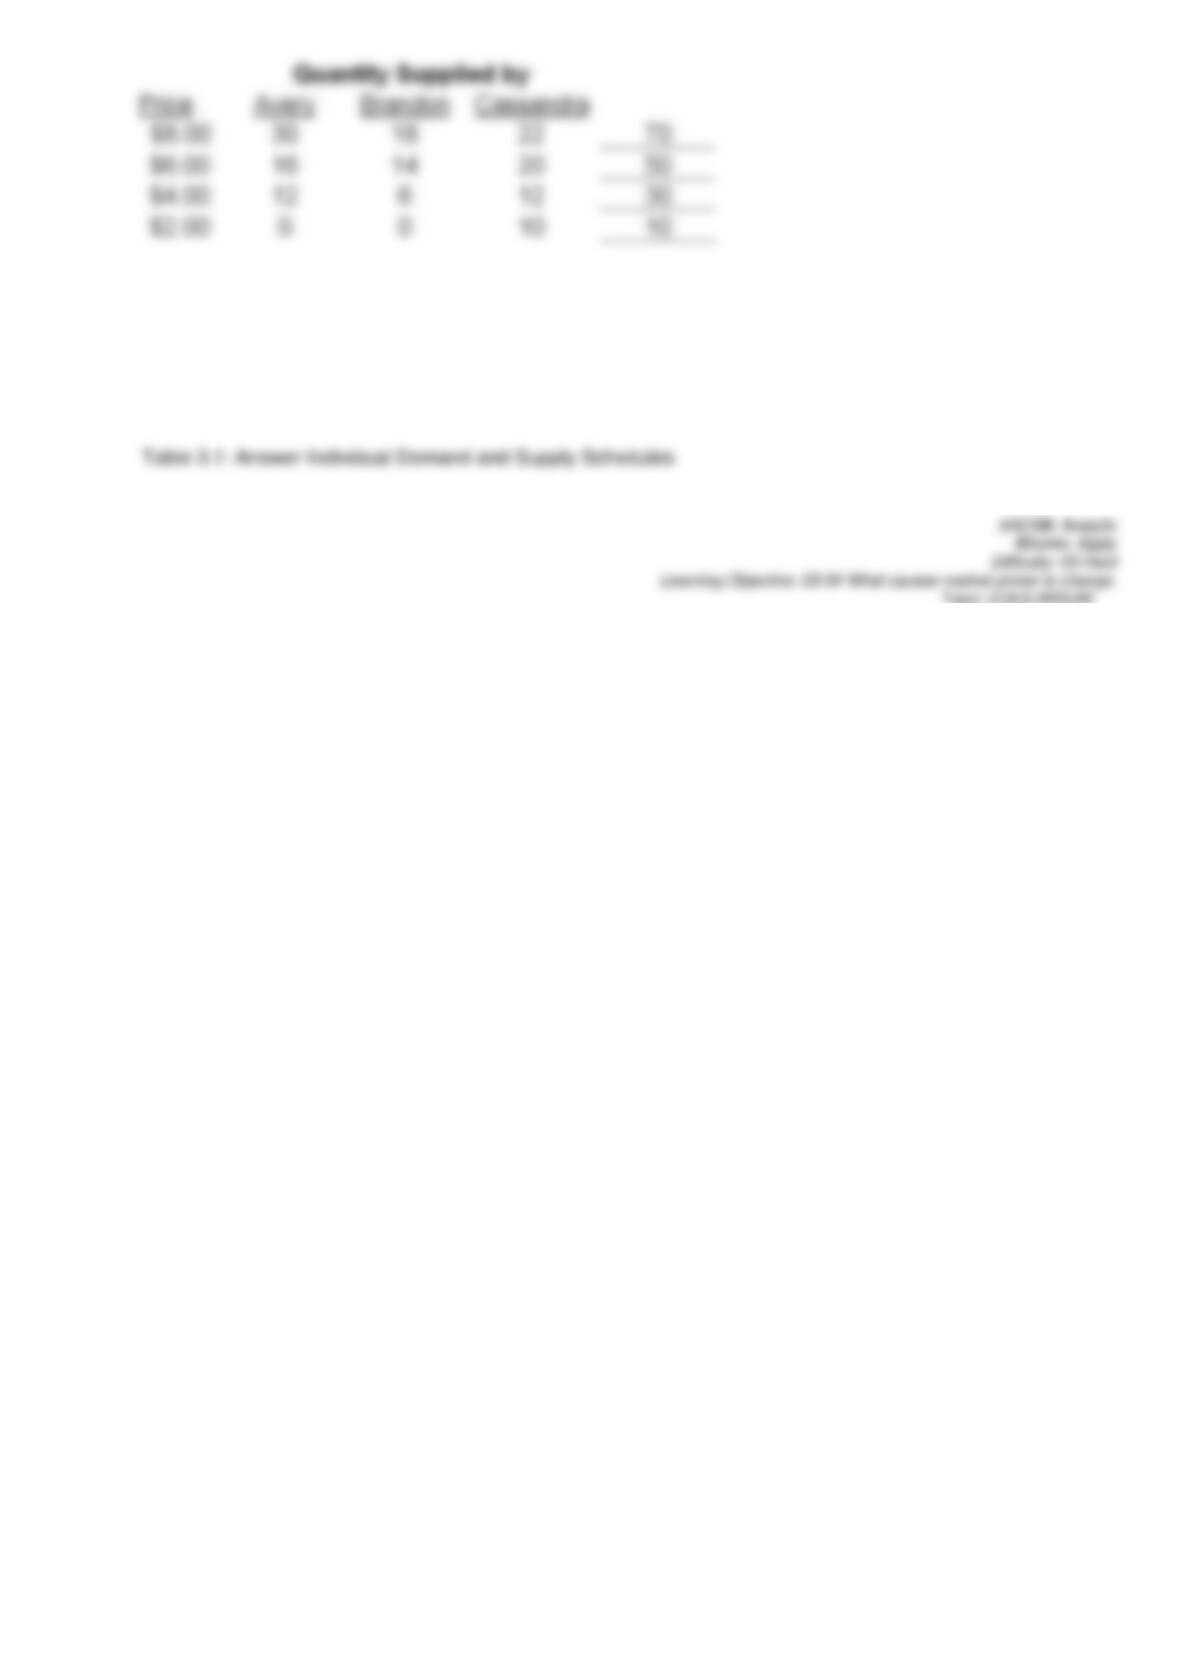
Complete Table 3.1. Then answer the indicated question.
Table 3.1 Individual Demand and Supply Schedules In Table 3.1, if the price is $4, the market will

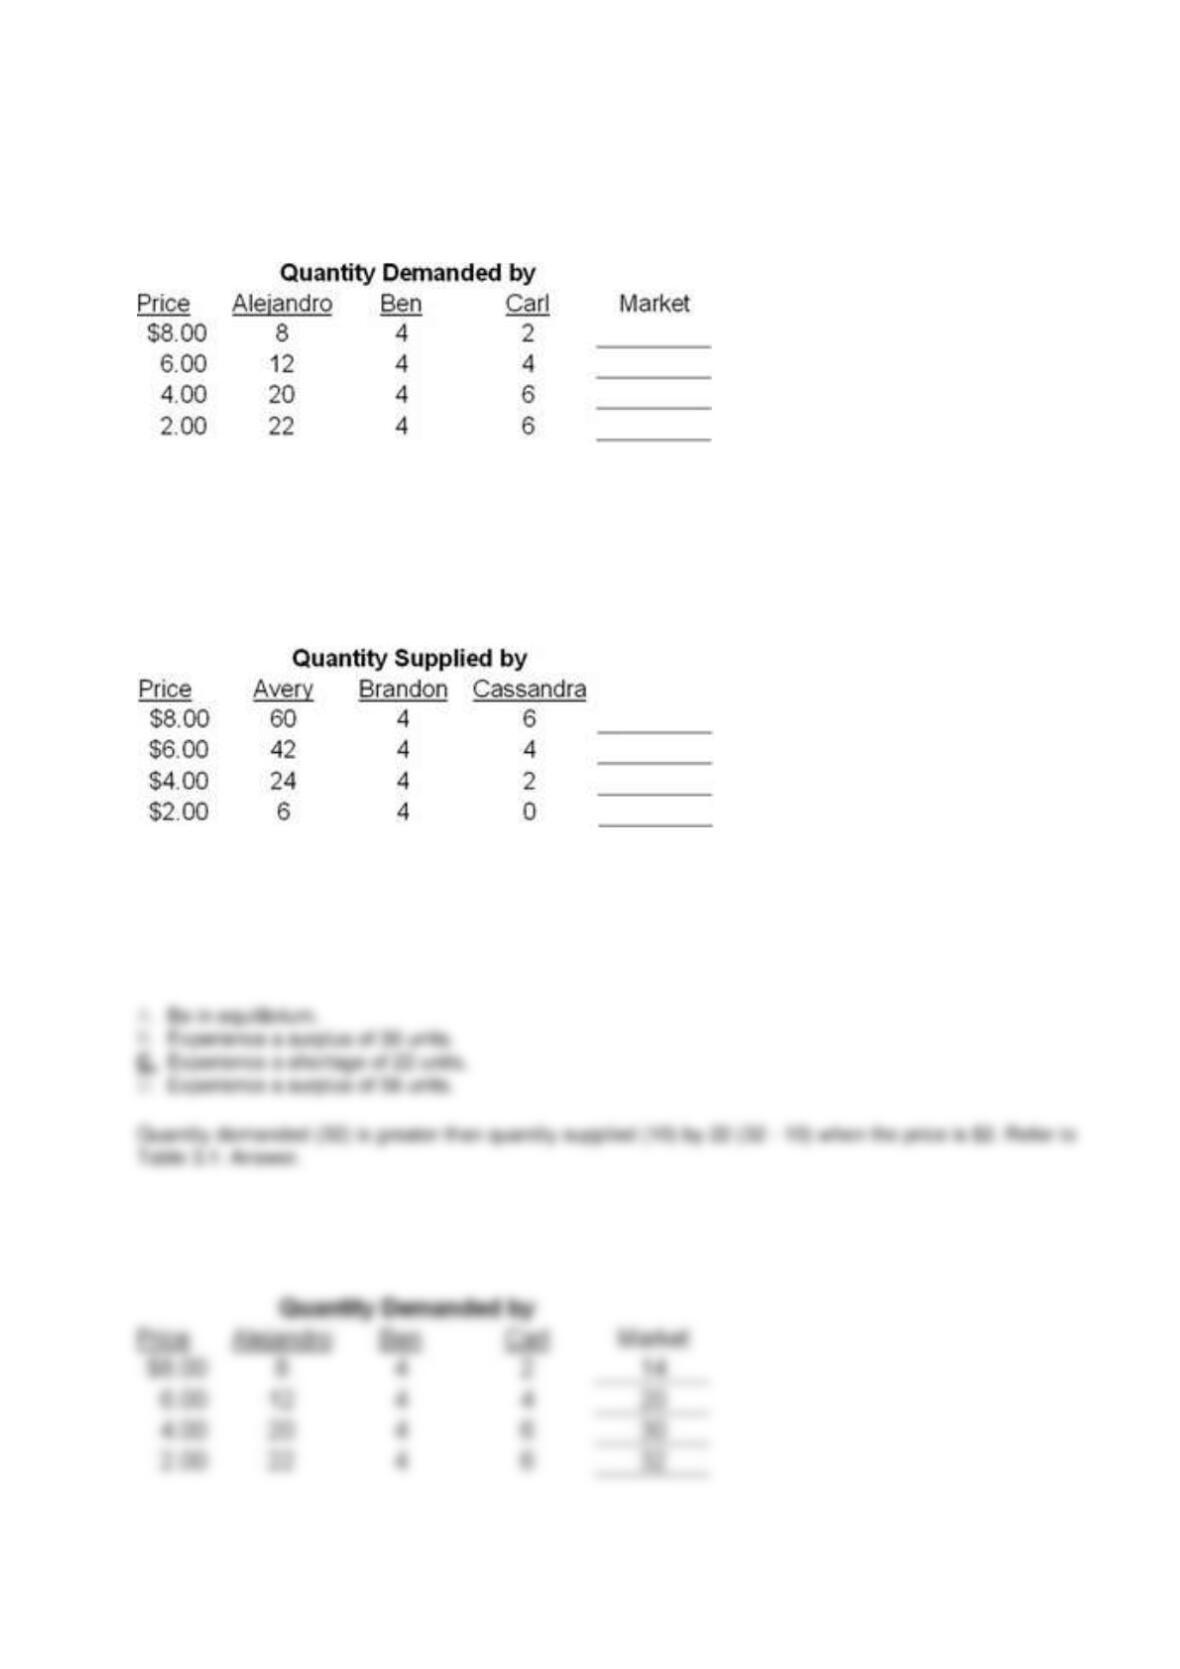
98.
Complete Table 3.1. Then answer the indicated question.
Table 3.1 Individual Demand and Supply Schedules In Table 3.1, if the price is $2, the market will
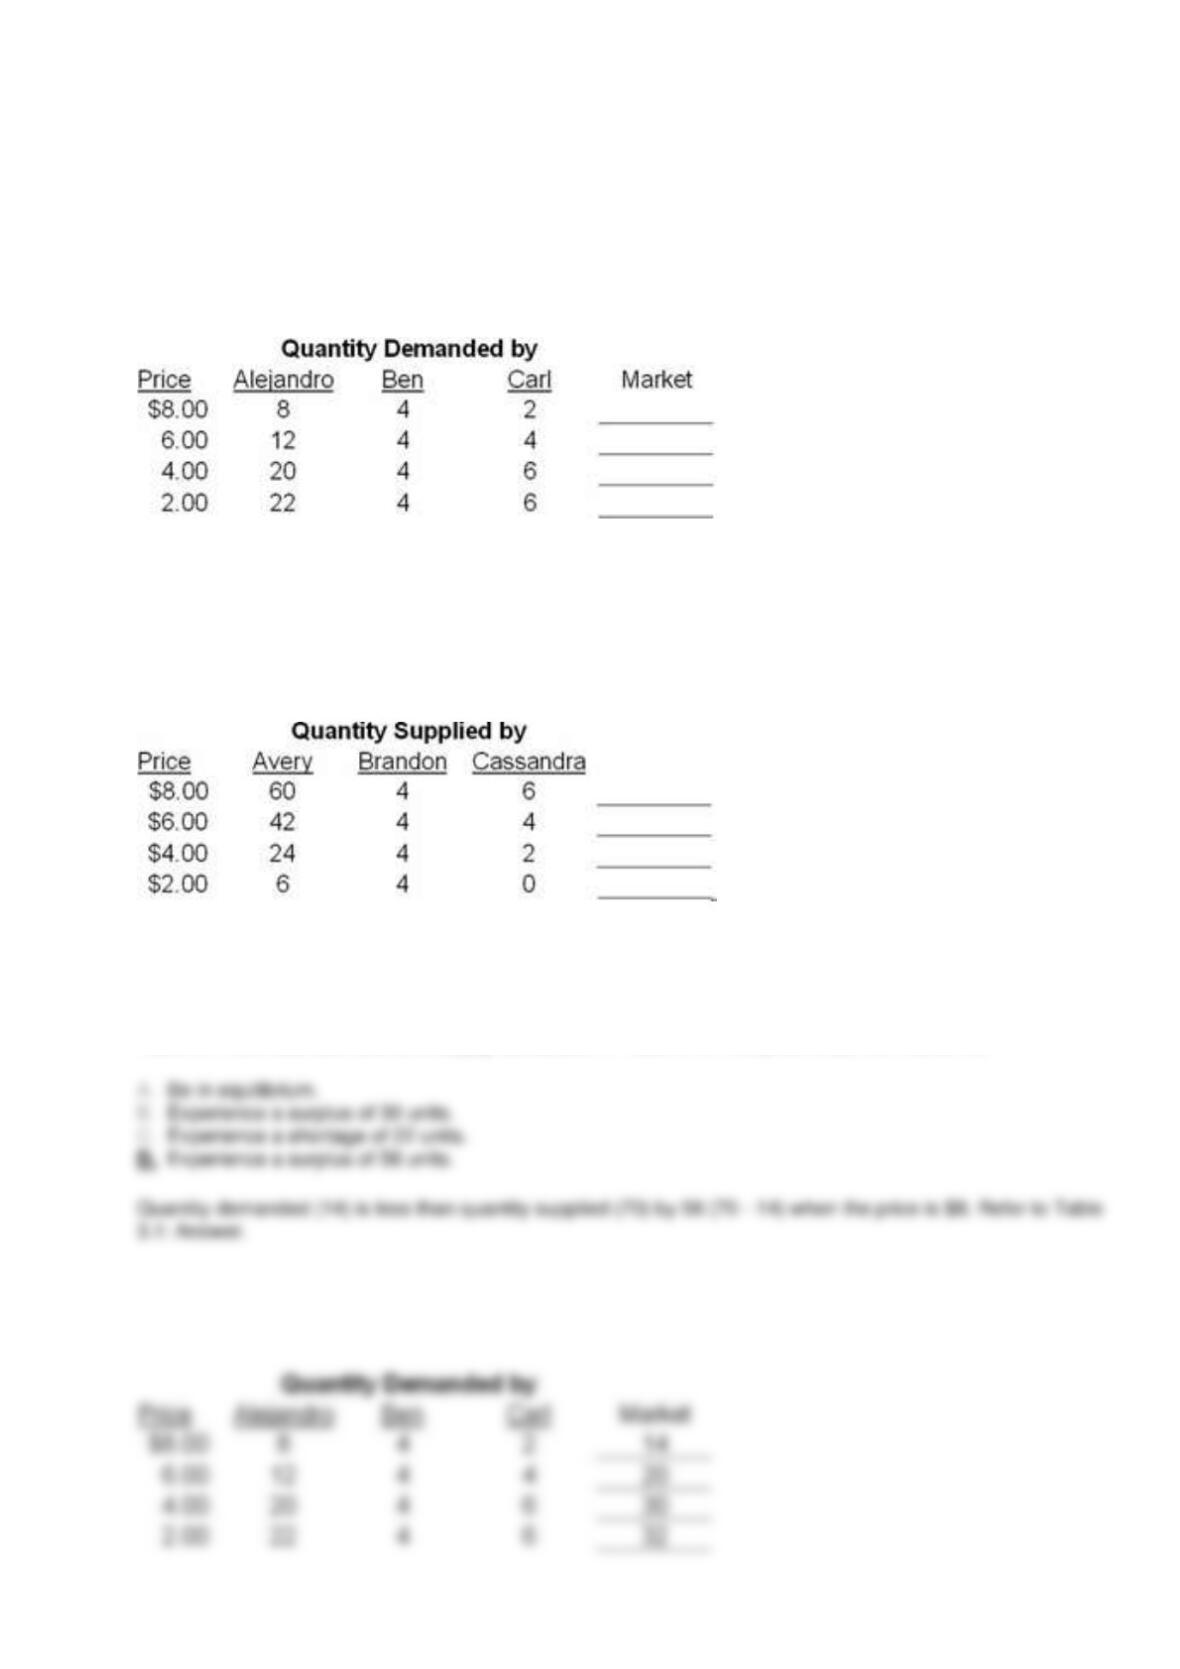
99.
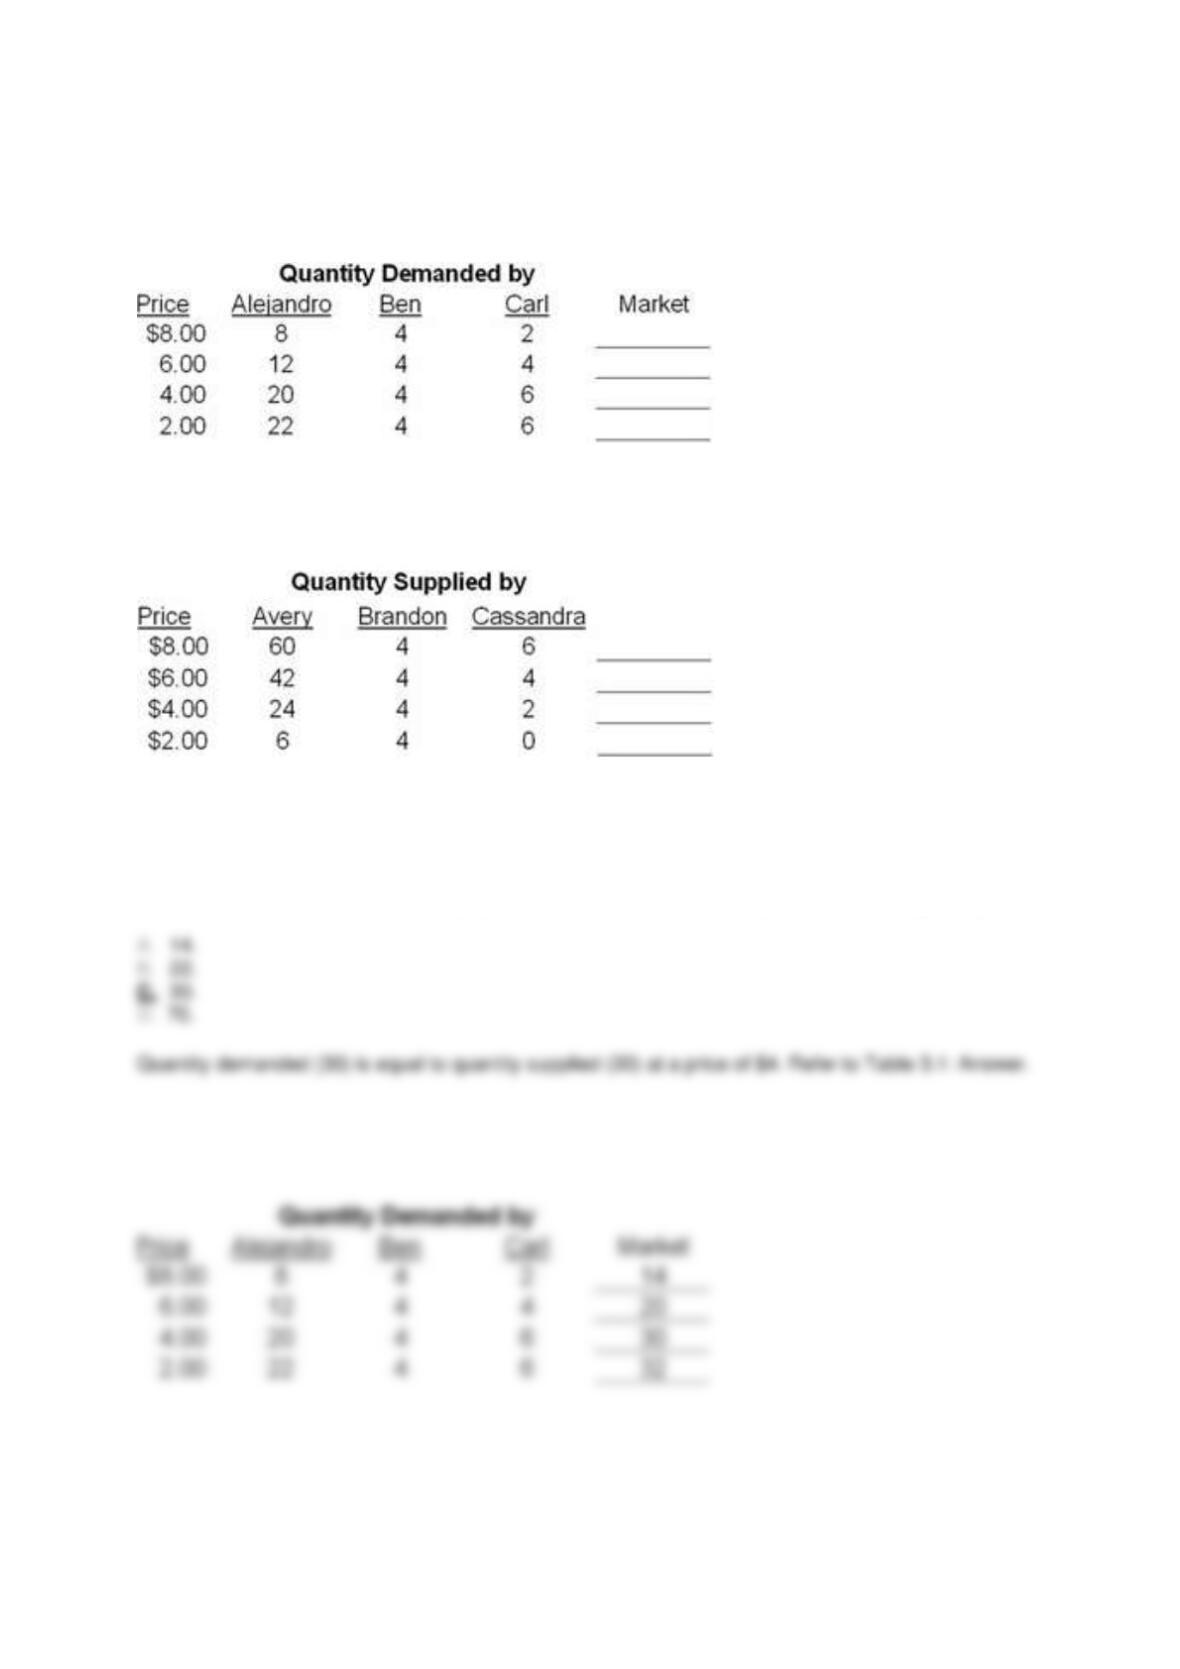
Complete Table 3.1. Then answer the indicated question.
Table 3.1 Individual Demand and Supply Schedules In Table 3.1, if the price is $8, the market will
100.
Complete Table 3.1. Then answer the indicated question.
Table 3.1 Individual Demand and Supply Schedules In Table 3.1, if government held the price at $3,
101.
Complete Table 3.1. Then answer the indicated question.
Table 3.1 Individual Demand and Supply Schedules In Table 3.1, the equilibrium market quantity is
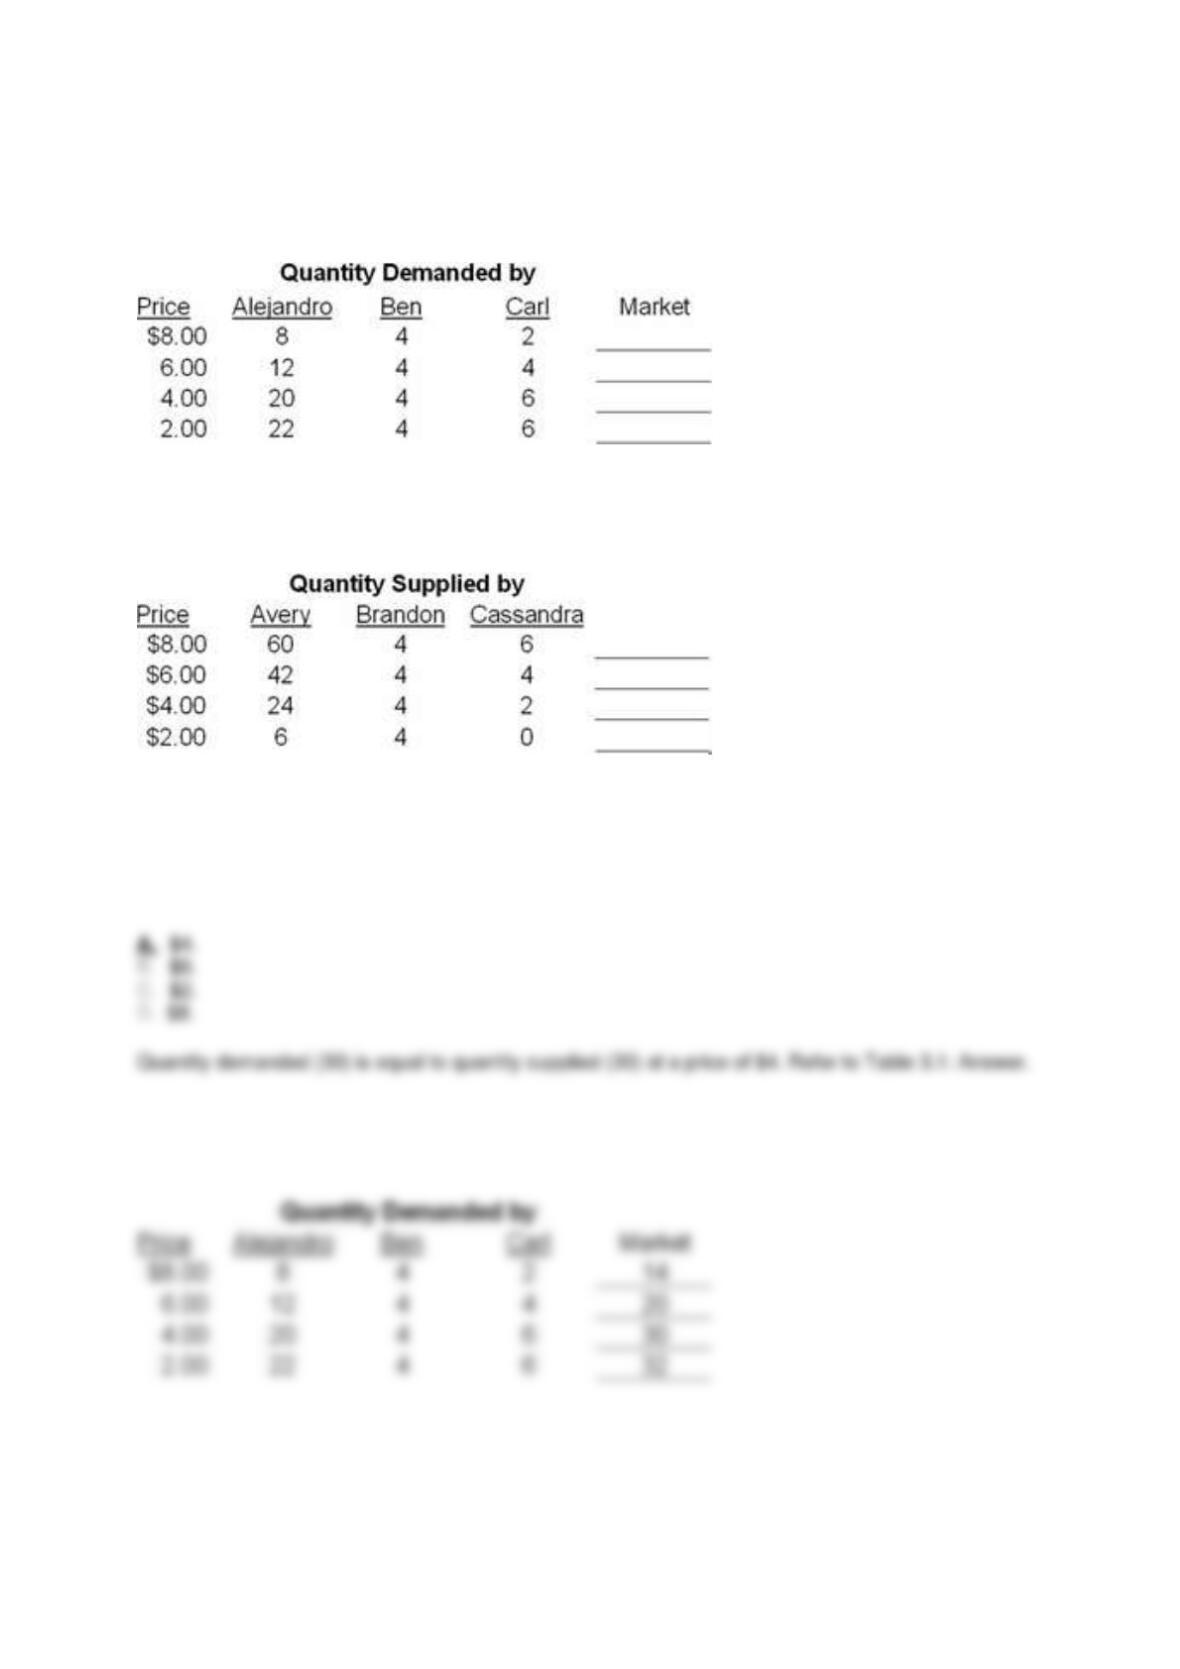
102.
Complete Table 3.1. Then answer the indicated question.
Table 3.1 Individual Demand and Supply Schedules In Table 3.1, the equilibrium market price is

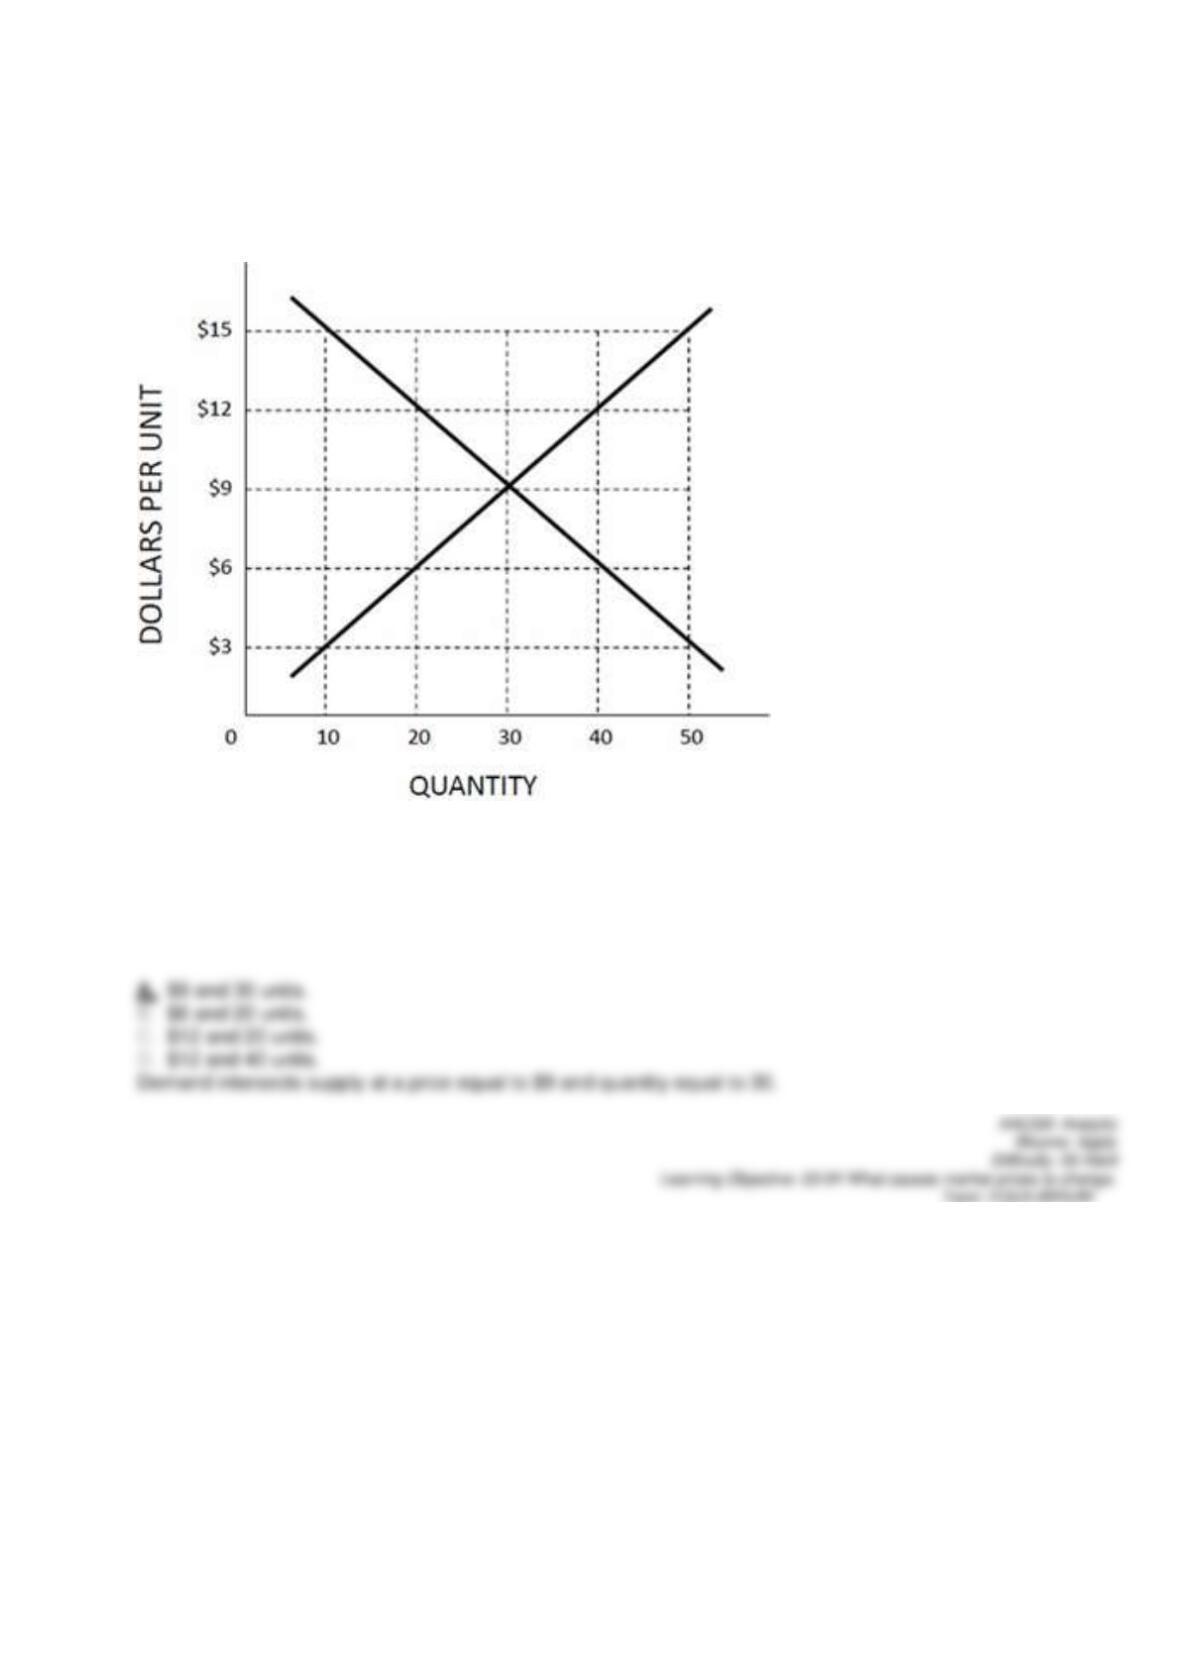
103.
The equilibrium price and quantity in Figure 3.2 are, respectively,
Figure 3.2 Supply and Demand