Find an equation in slope–intercept form of the line satisfying the specified conditions.
191)
Through (3, –10), parallel to 4x + 7y = – 16
191)
A)
y = – 4
7x –58
7
B)
y =4
7x +58
7
C)
y = – 16
7x –16
7
D)
y = – 7
4x –5
2
Graph the linear equation.
192)
7x = y + 5
192)
A)
B)
C)
D)
C)
D)
Write the slope–intercept form of the equation for the line passing through the given pair of points.
193)
(2, 0) and (7, –4)
193)
A)
y = – 2
11 x –58
11
B)
y =2
11 x –58
11
C)
y =4
5x +8
5
D)
y = – 4
5x +8
5
Decide whether or not the ordered pair is a solution to the equation.
194)
x – y =25; (5, 2)
194)
A)
No
B)
Yes
A
Find the slope of the line.
195)
2x + y =7
195)
A)
7
B)
–2
C)
2
D)
–7
B
C)
D)
Graph the linear equation.
196)
–3x – y = 0
196)
102
D
C)
D)
A)
B)
C)
D)
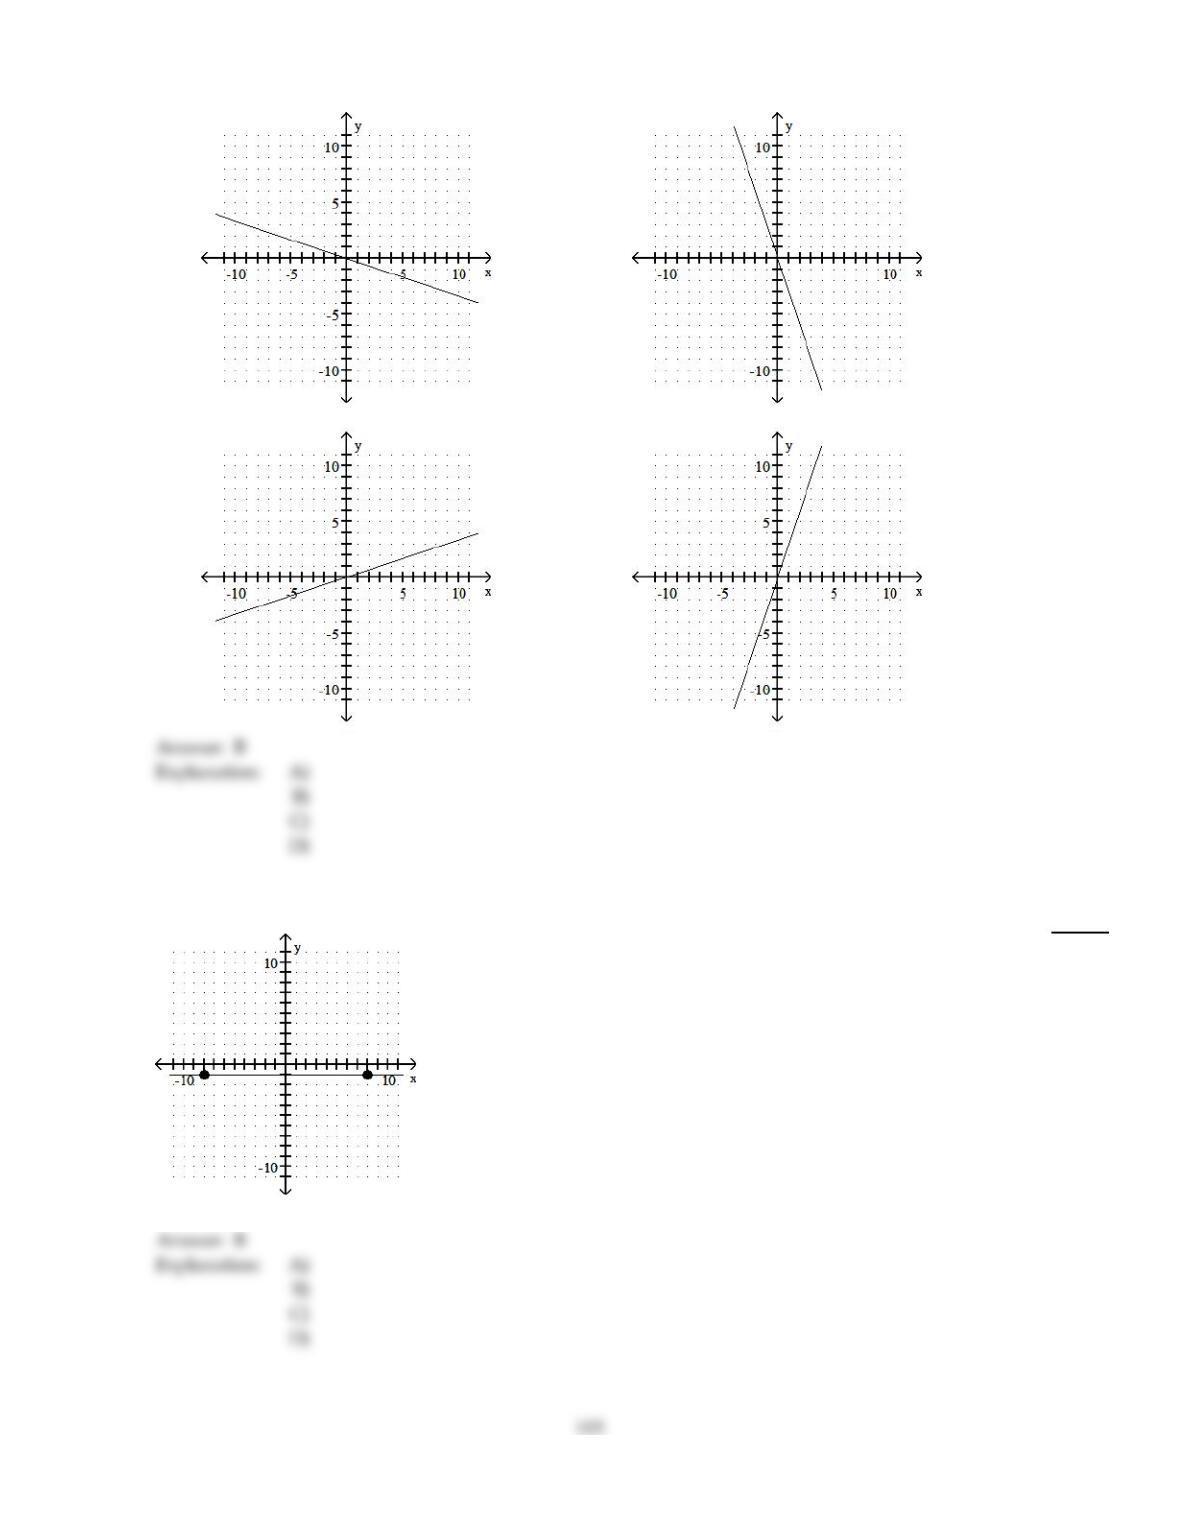
Decide whether the slope is positive, negative, zero, or undefined.
197)
197)
A)
Undefined
B)
Zero
C)
Positive
D)
Negative
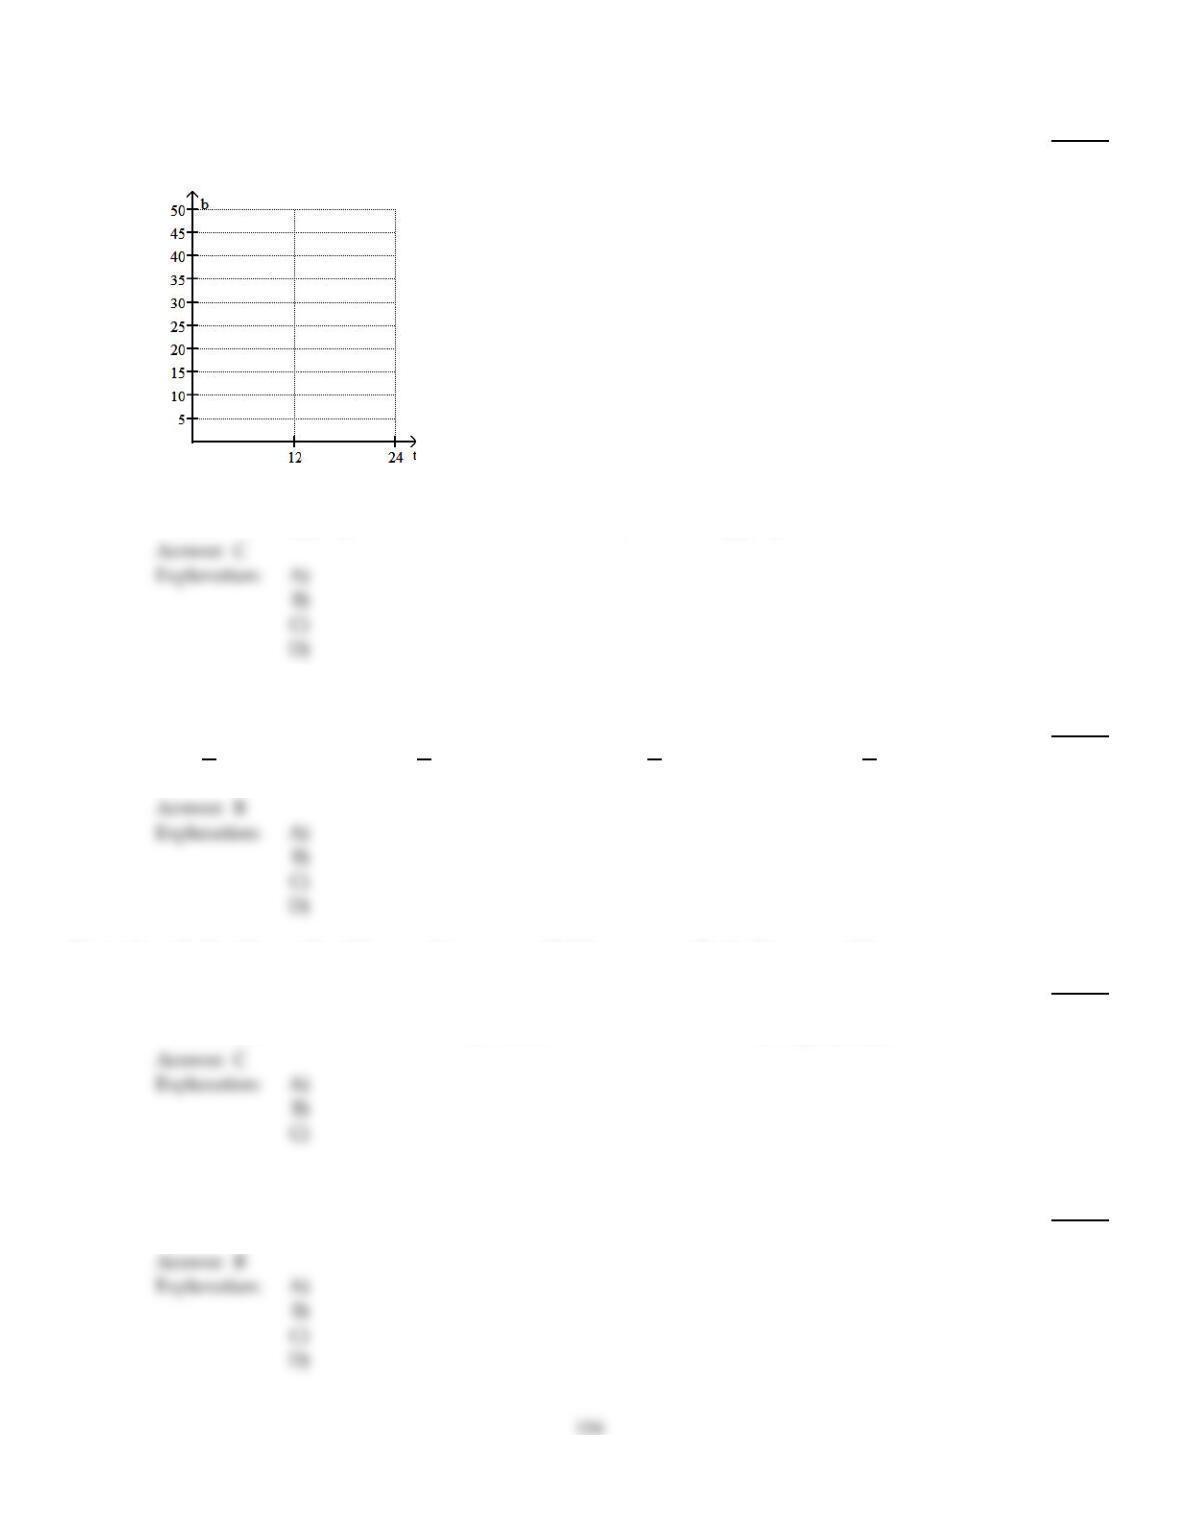
Solve by graphing. Label the axes and show where the solution is located on the graph.
198)
In one U.S. town the annual consumption, b, of beef (in kg per person) can be estimated by
b = – .33t +23, where t is the number of years since 1975. Graph the equation and use the graph to
estimate the beef consumption in the year 1986.
198)
A)
About 27 kg per person
B)
About 16 kg per person
C)
About 19 kg per person
D)
About 13 kg per person
Find the slope of the line.
199)
–2y = – 6– 5x
199)
A)
2
5
B)
5
2
C)
–6
5
D)
–5
2
B
Determine whether the graphs of the equations are parallel lines, perpendicular lines, or neither.
200)
3x – 4y = 5
8x + 6y = 5
200)
A)
Neither
B)
Parallel
C)
Perpendicular
C
Write the slope–intercept form of the equation for the line passing through the given pair of points.
201)
(–1, –2) and (6, –2)
201)
A)
6x – 1y = 0
B)
y = – 2
C)
–1x + 6y = 0
D)
x = – 1
B
C
Find the slope of the line going through the given pair of points.
202)
(3.7, 4.2) and (3.2, 2.7)
202)
A)
1
3
B)
–3
C)
3
D)
–1
3
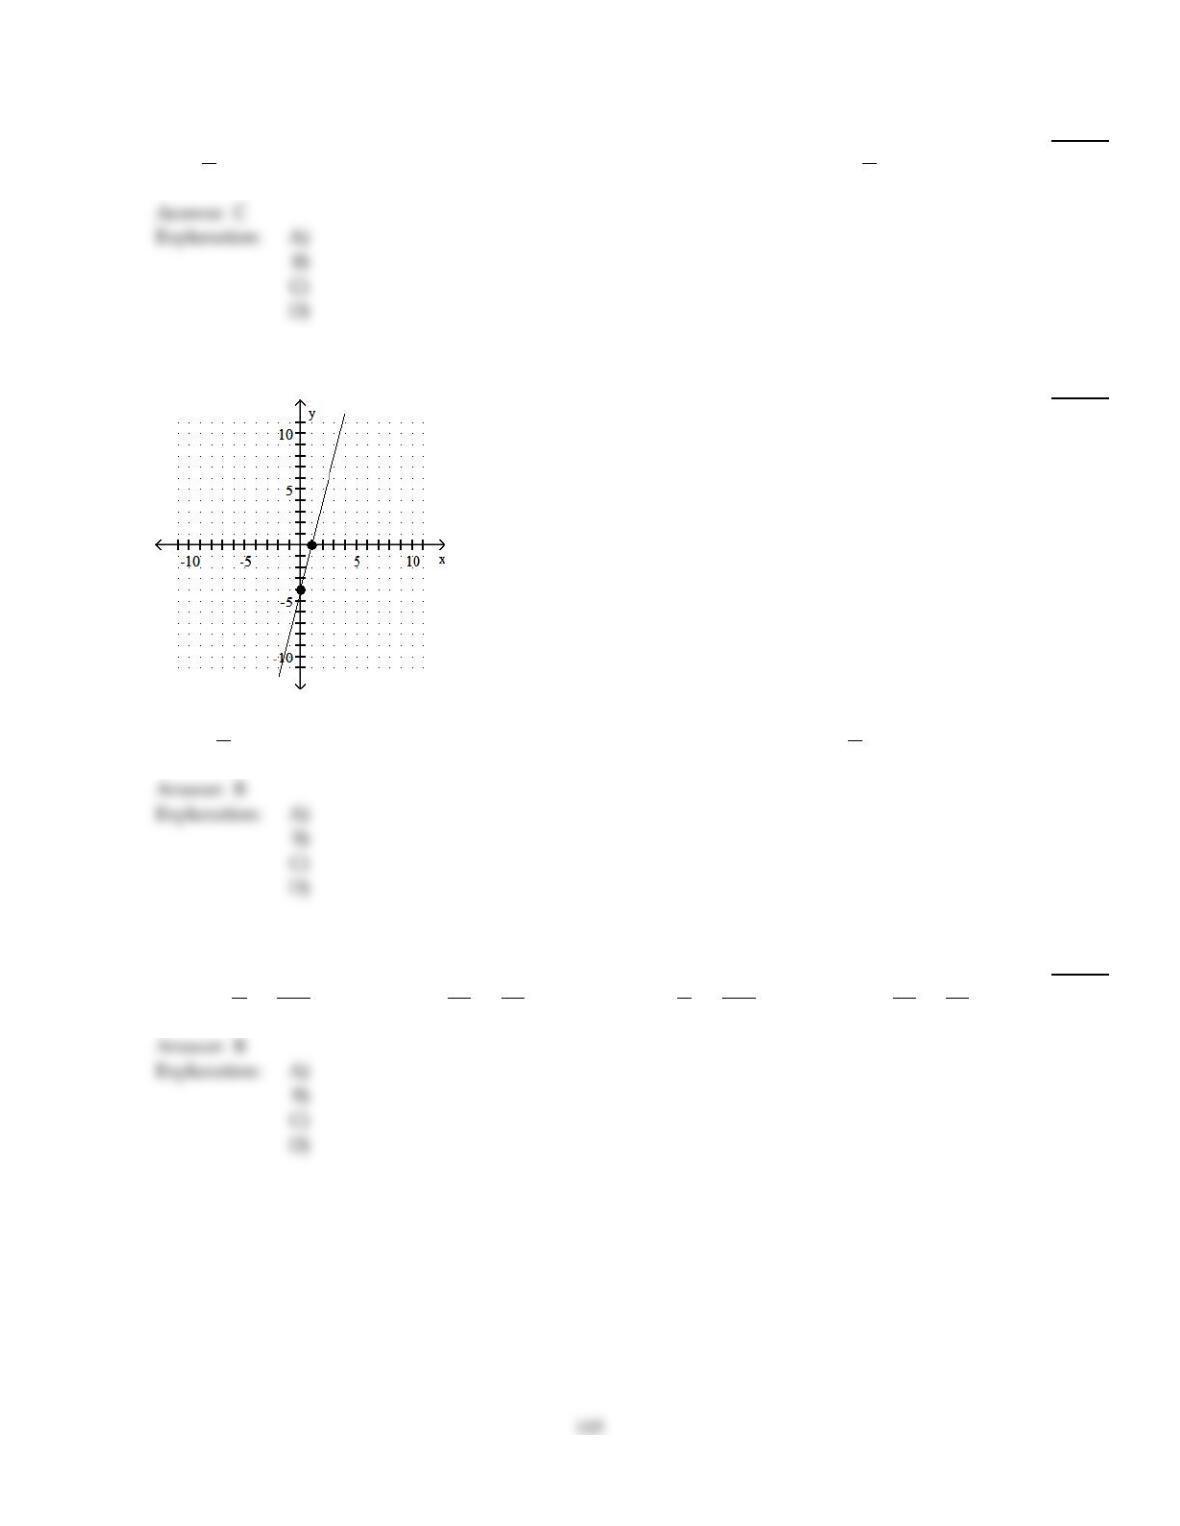
Use the coordinates of the indicated points to find the slope of the line.
203)
203)
A)
–1
4
B)
4
C)
–4
D)
1
4
B
Write the slope–intercept form of the equation for the line passing through the given pair of points.
204)
(–8, 1) and (9, 5)
204)
A)
y =9
4x +101
4
B)
y =4
17 x +49
17
C)
y = – 9
4x +101
4
D)
y = – 4
17 x +49
17
B
C
Write an equation of the line through the given point with the given slope. Write the equation in slope–intercept form.
205)
(0, 5); m = – 8
9
205)
A)
y = – 9
8x + 5
B)
y = – 8
9x + 5
C)
y = – 8
9x – 5
D)
y = – 8
9x +1
5
Find the intercepts for the graph of the equation.
206)
2x + y = – 8
206)
A)
(–8, 4) (–6, –8)
B)
(–6, 0) (4, 0)
C)
(0, –6) (0, 4)
D)
(–4, 0) (0, –8)
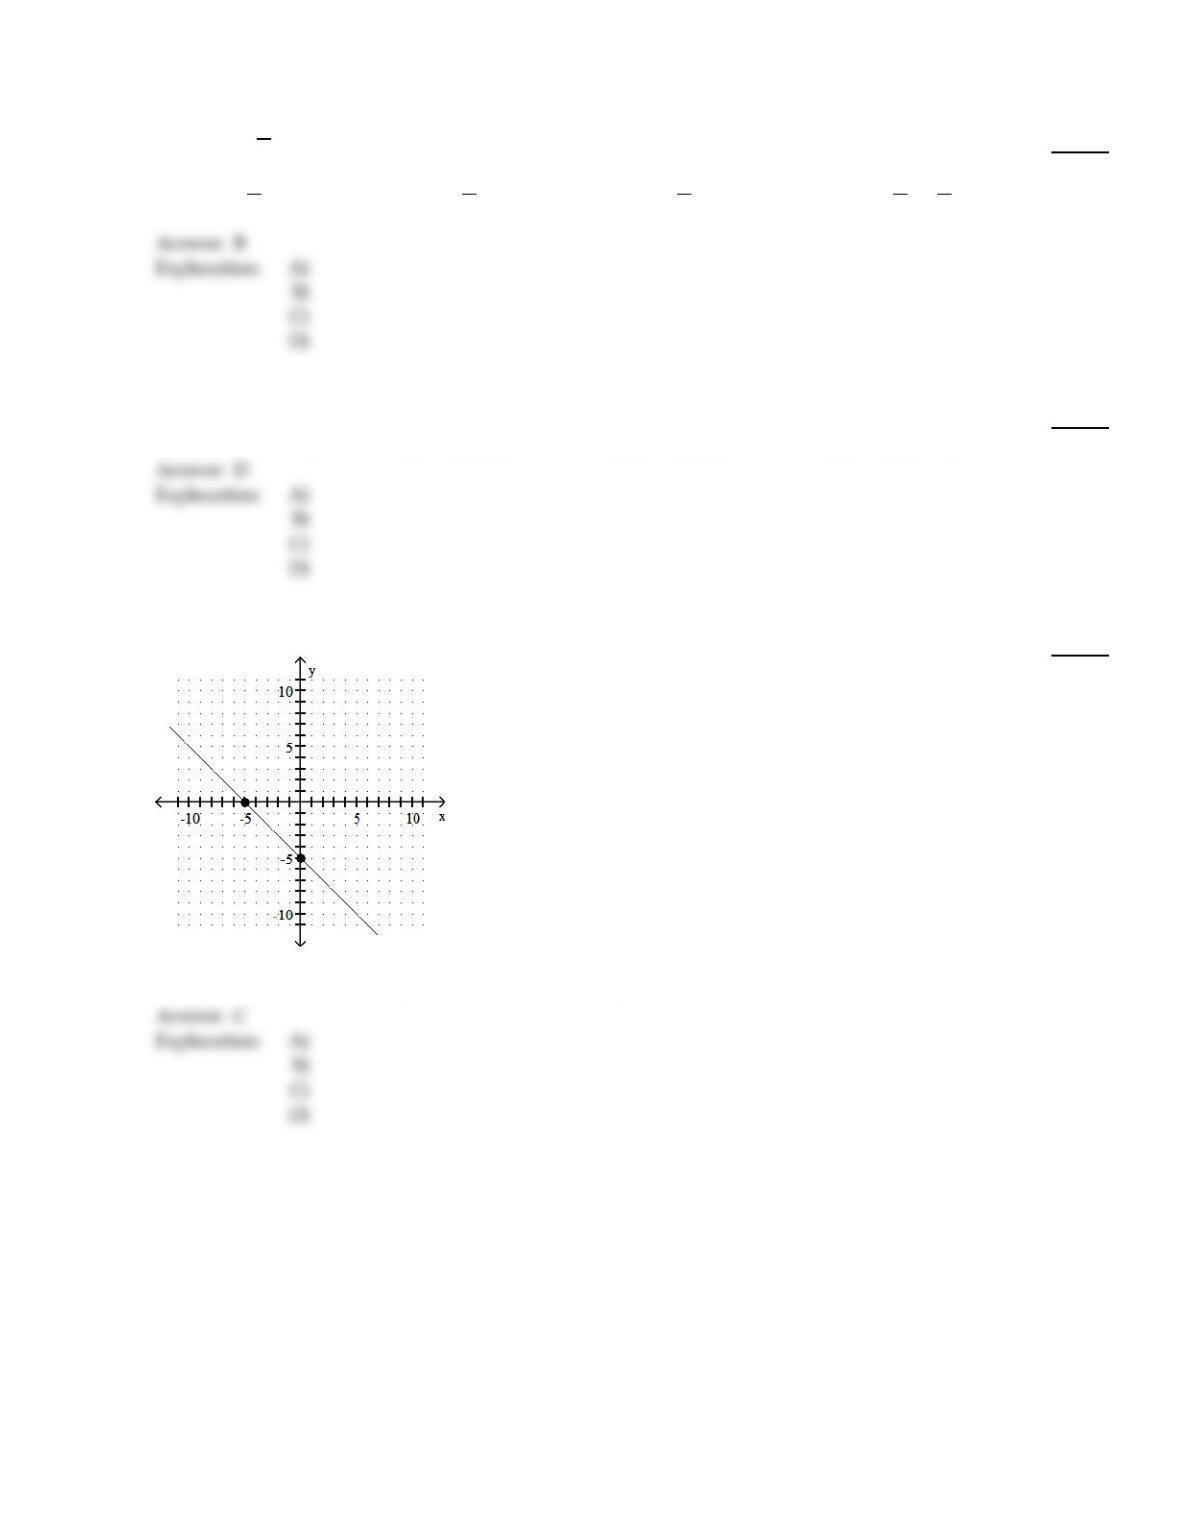
Use the coordinates of the indicated points to find the slope of the line.
207)
207)
A)
5
B)
–5
C)
–1
D)
1
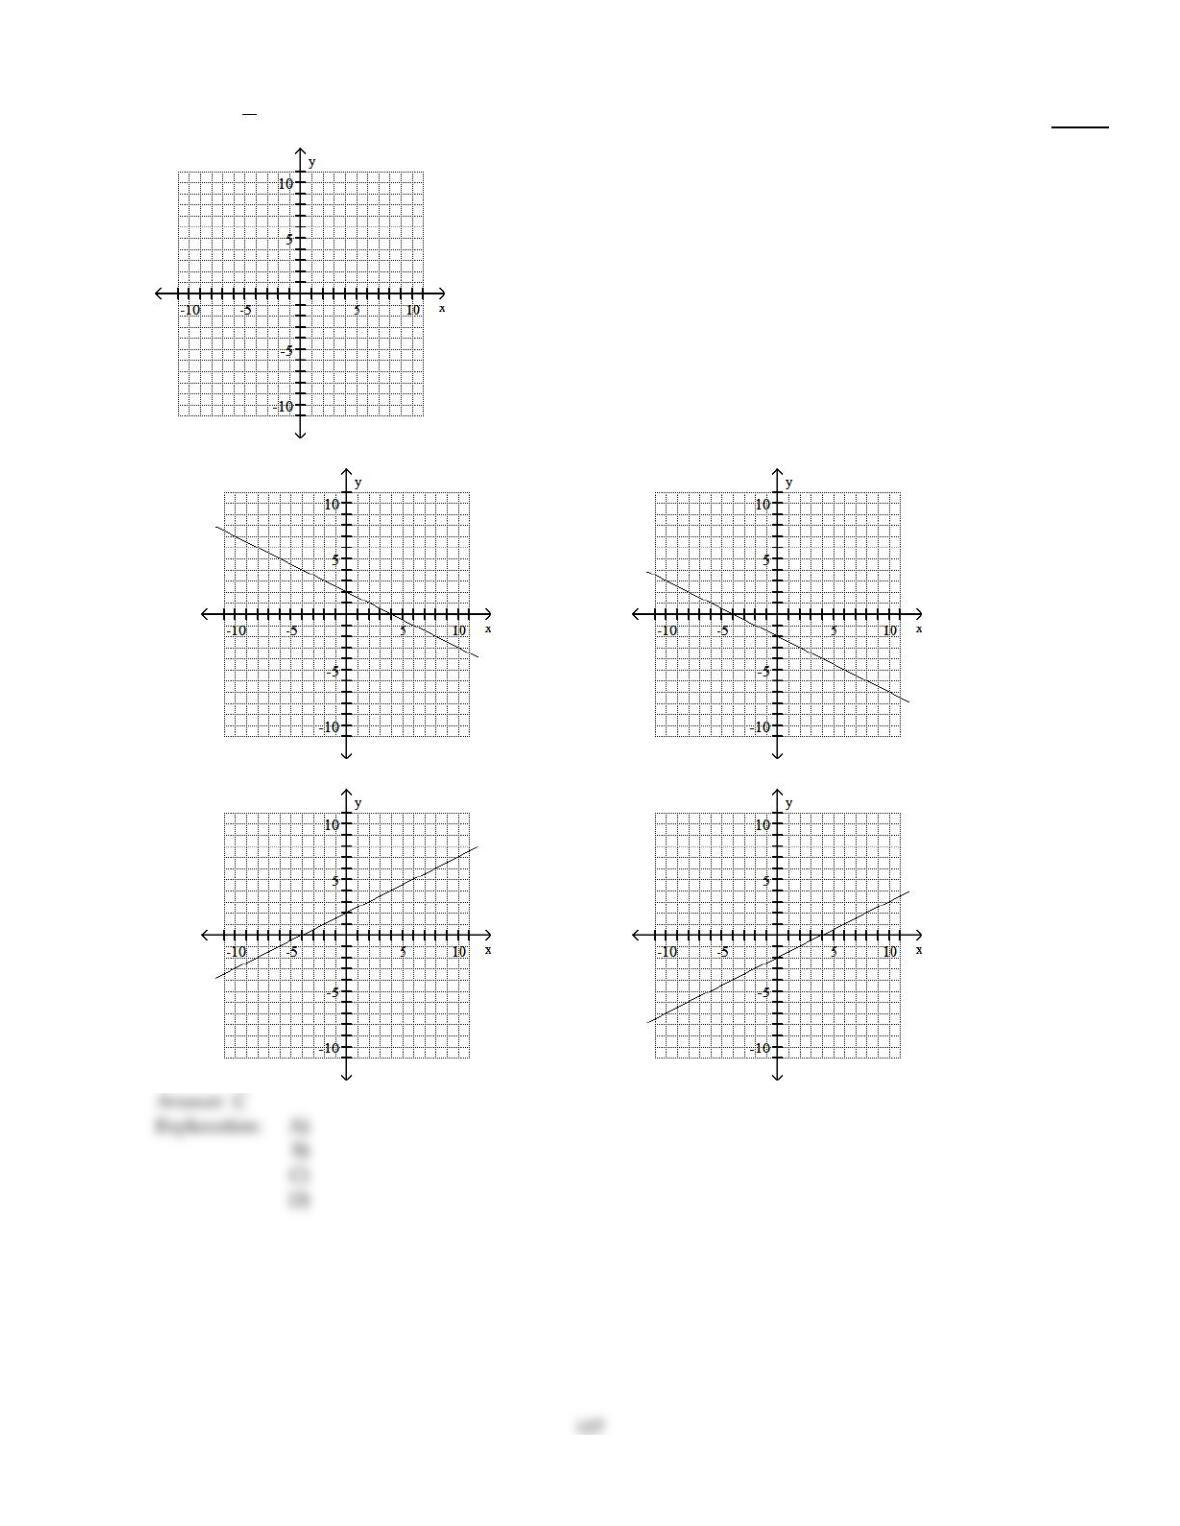
Graph the line through the given point with the given slope.
106
208)
(0, 2), m =1
2
208)
A)
B)
C)
D)
Write an equation for the line passing through the given pair of points. Give your final answer in standard form.
209)
(2, 4) and (4, 6)
209)
A)
x + 2y =2
B)
x – y =2
C)
x + y = – 2
D)
x – y = – 2
Complete the table of values for the given equation.
210)
y = – x + 3 x
y 4 0 3
210)
A)
–1; –3; 0
B)
–1; 3; 0
C)
–1; 3; 4
D)
–1; 4; 3
B
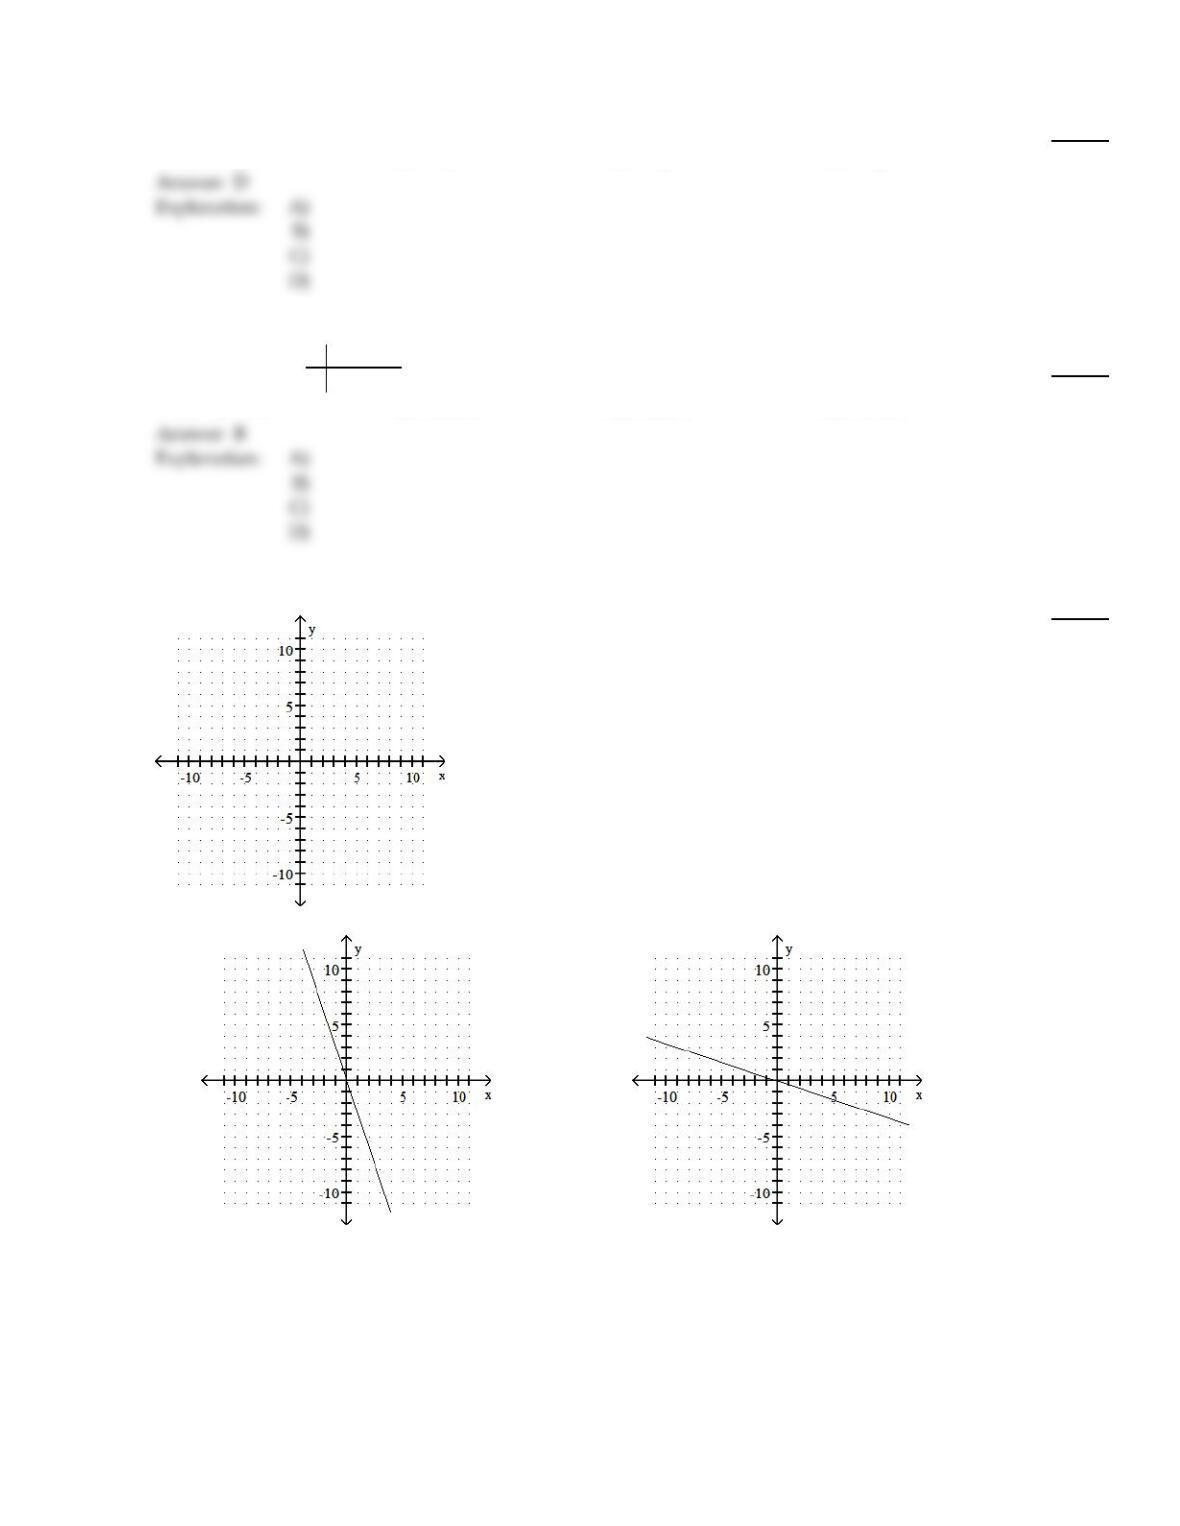
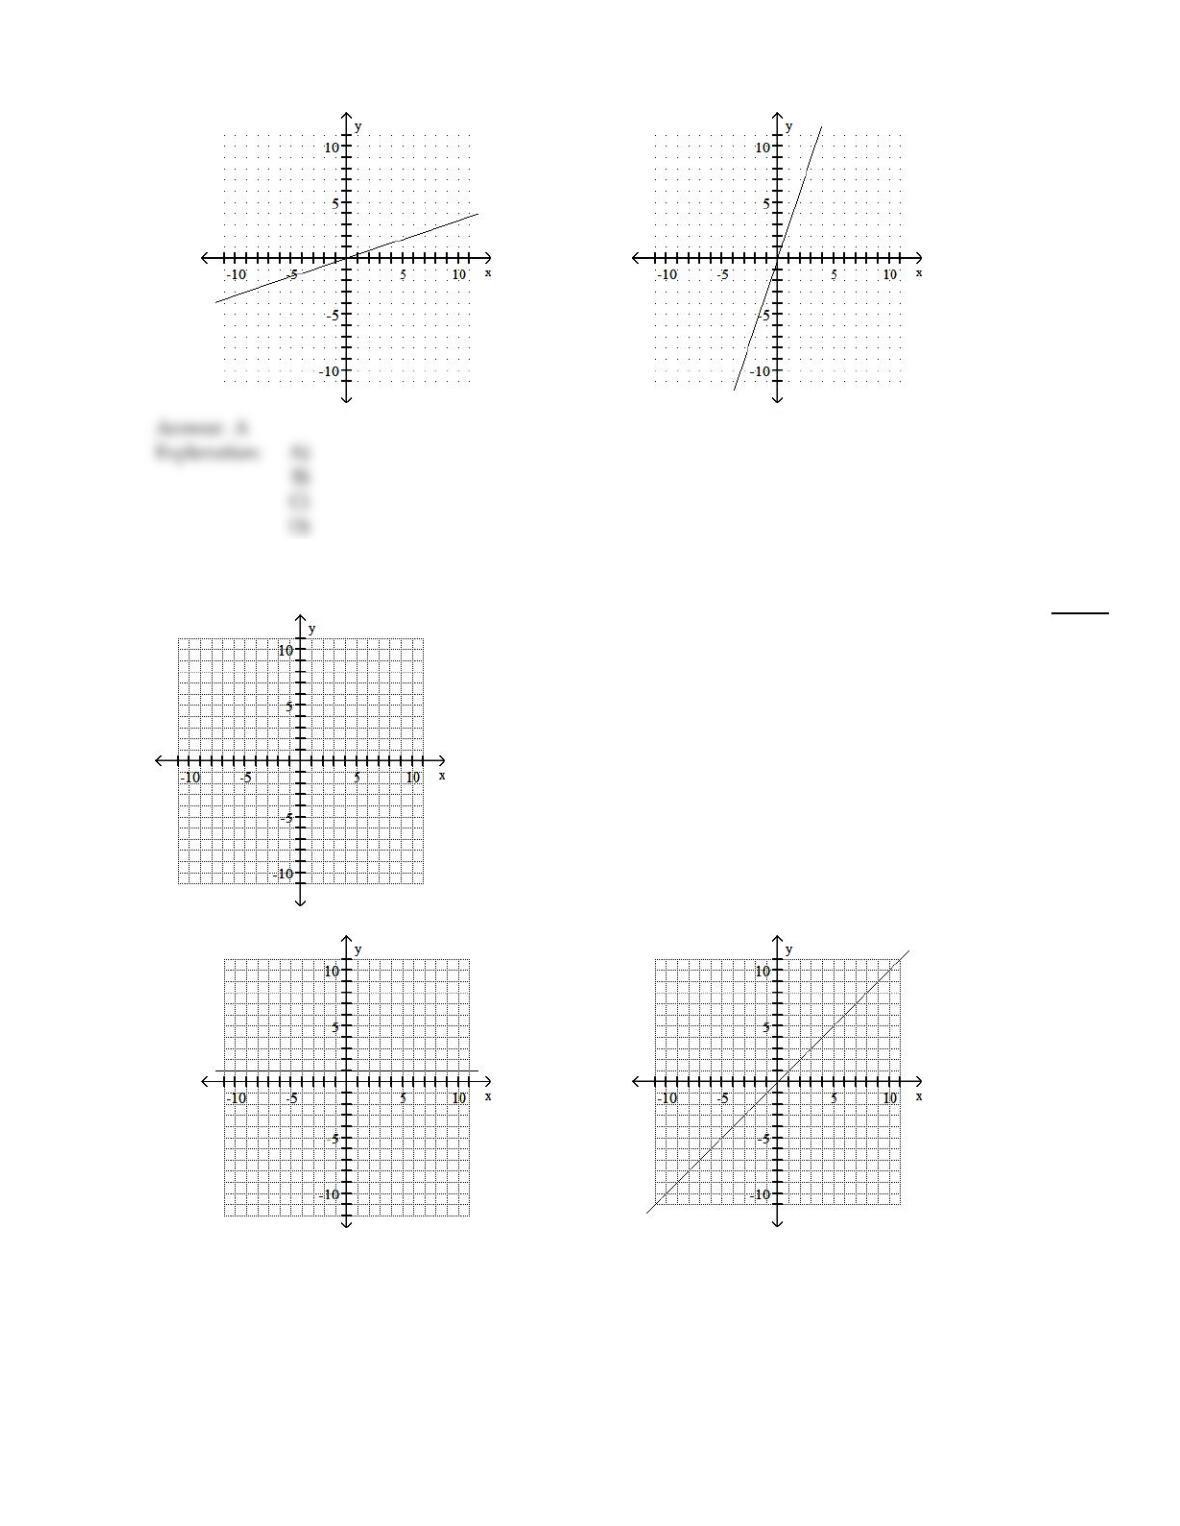
Graph the linear equation.
211)
3x + y = 0
211)
A)
B)
108
D
C)
D)
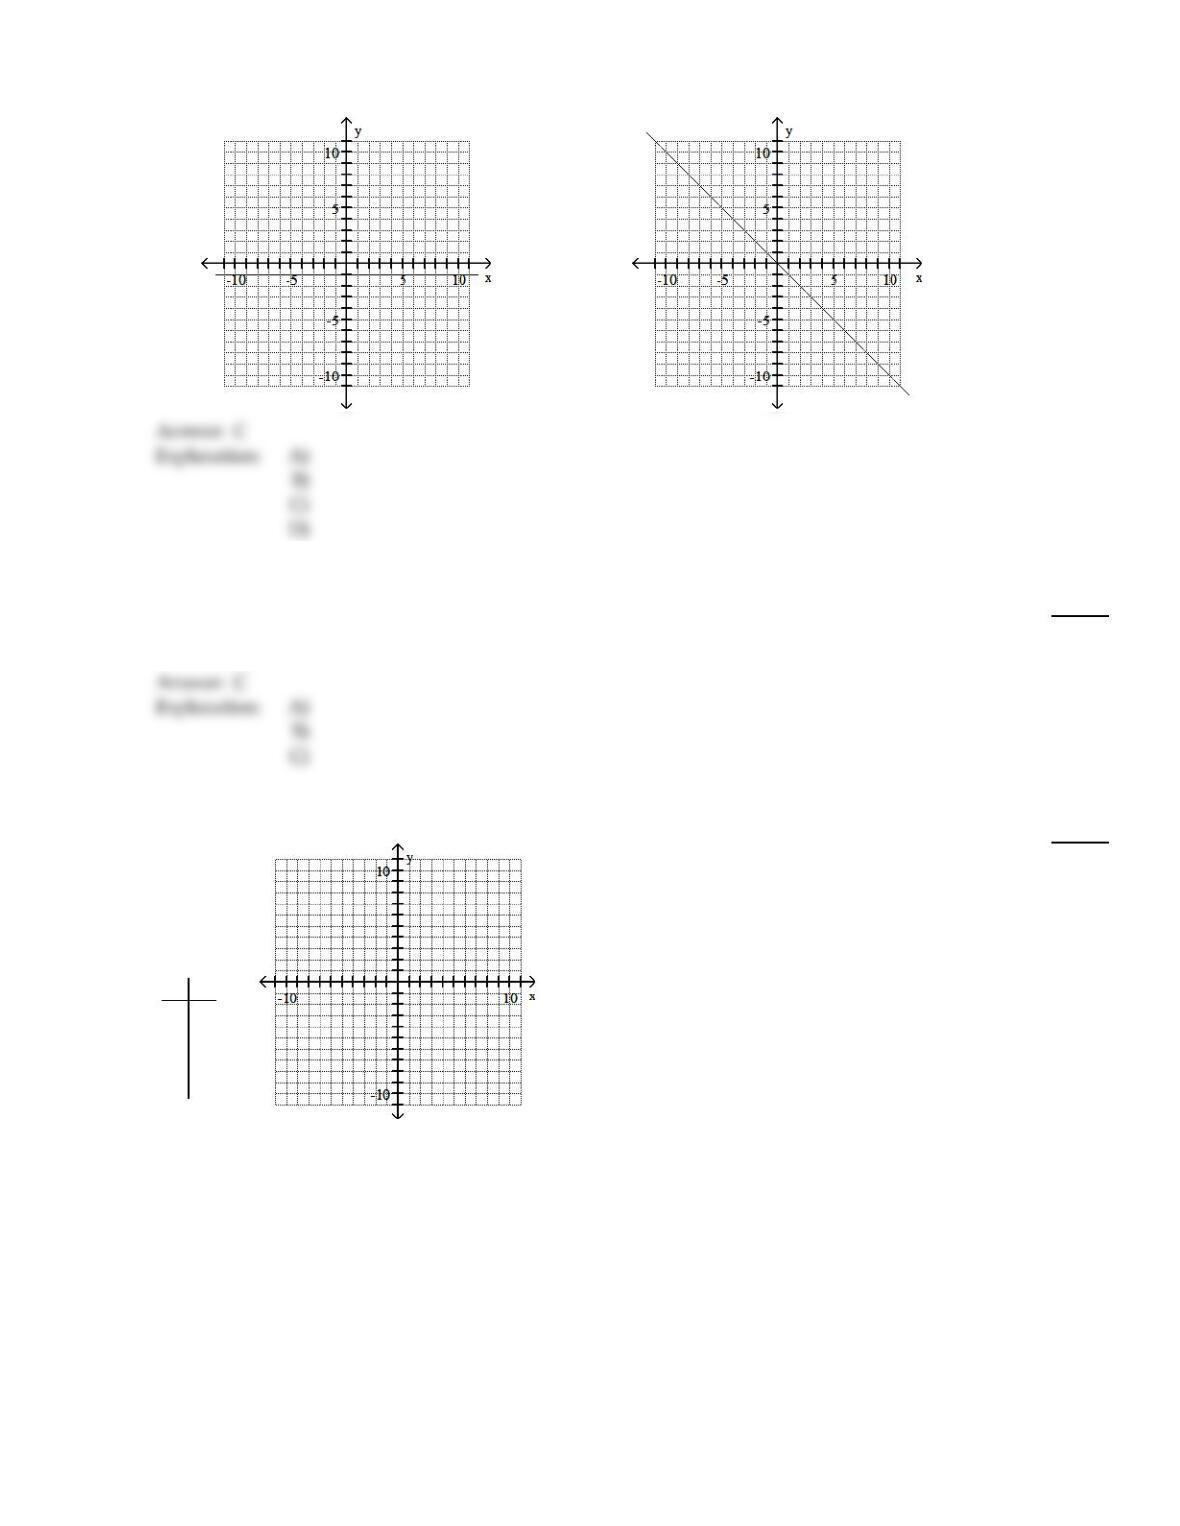
Graph the line through the given point with the given slope.
212)
(–3, –1), m = 0
212)
A)
B)
109
C)
D)
Determine whether the graphs of the equations are parallel lines, perpendicular lines, or neither.
213)
y =3x –5
12x +4y =8
213)
A)
Perpendicular
B)
Parallel
C)
Neither
For the given equation, complete the table of values and plot the resulting ordered pairs.
214)
y – 4 = 0
x y
0
2
–2
4
214)
110
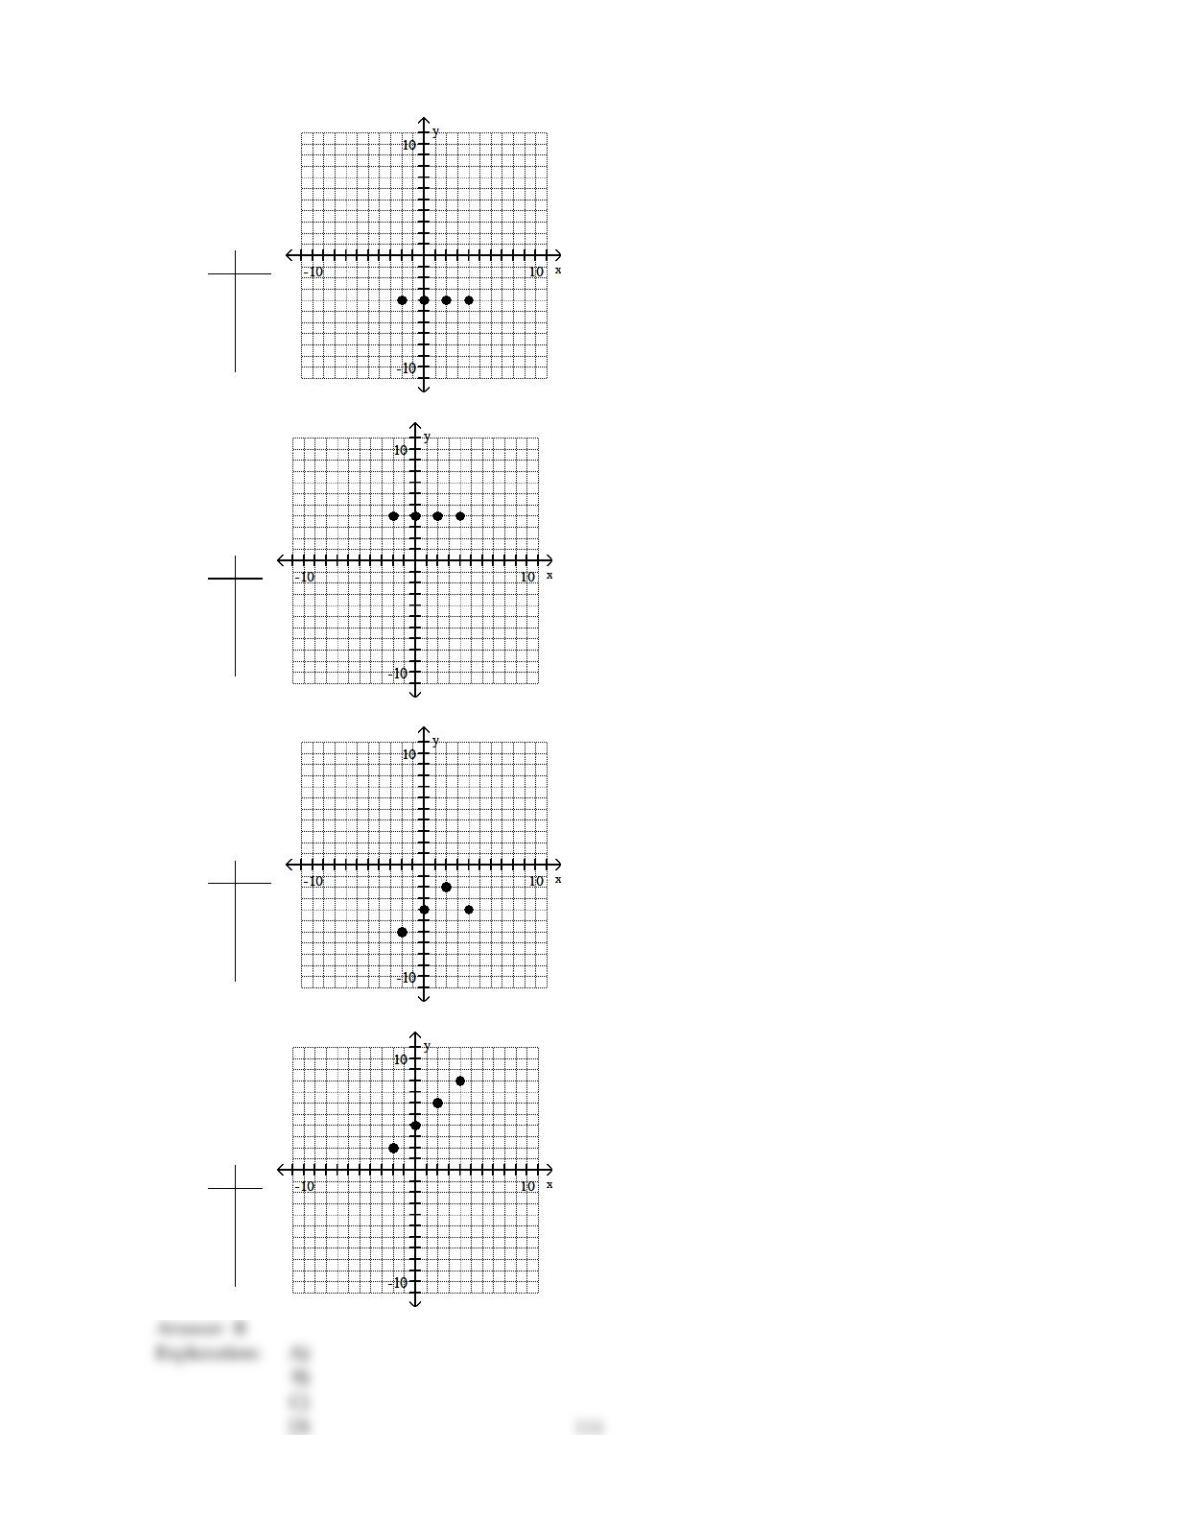
A)
x y
0 –4
2–4
–2–4
4–4
B)
x y
0 4
2 4
–2 4
4 4
C)
x y
0 –4
2 –2
–2–6
4–4
D)
x y
0 4
2 6
–2 2
4 8