Solve the problem.
143)
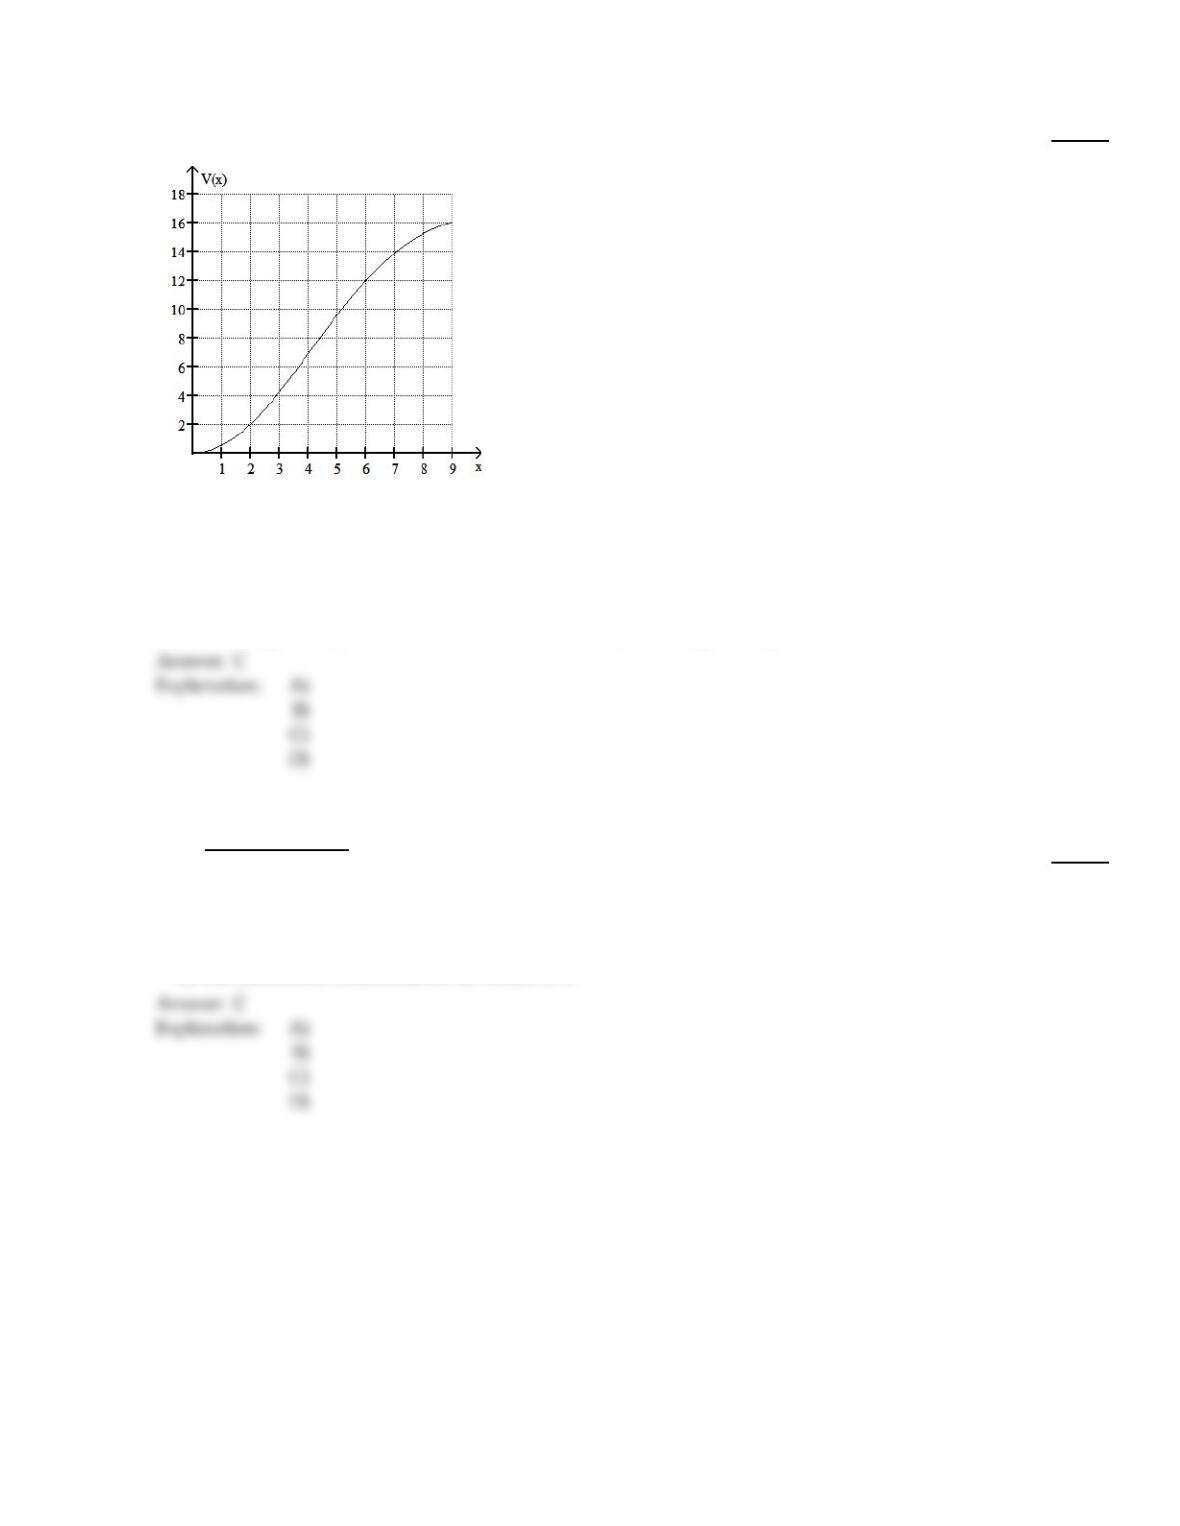
The graph shows the amount of potential energy V(x) (in arbitrary energy units) stored in a large
rubber band that is stretched a distance of x inches beyond its relaxed length.
The magnitude of the force required to hold the rubber band at the position x = a is the derivative
of the potential energy with respect to x, evaluated at the point x = a. Estimate the force required to
hold the band at a stretched position x =8. (Hint: the force in this problem has units of “energy
units per inch”.)
143)
A)
–1.1 energy units per inch
B)
2.2 energy units per inch
C)
1.1 energy units per inch
D)
2.9 energy units per inch
Use a graphing utility to find the discontinuities of the given rational function.
144)
f(x) =x2+4x +4
x3+2x2+x –18
144)
A)
4
B)
–2
C)
2
D)
The function is continuous for all values of x.
C
52
C
Complete the table and use the result to find the indicated limit.
145)
If f(x) = x2+ 8x – 2, find lim
x
2 f(x).
x 1.9 1.99 1.999 2.001 2.01 2.1
f(x)
145)
A)
x 1.9 1.99 1.999 2.001 2.01 2.1
f(x) 5.043 5.364 5.396 5.404 5.436 5.763 ; limit =
B)
x 1.9 1.99 1.999 2.001 2.01 2.1
f(x) 16.810 17.880 17.988 18.012 18.120 19.210 ; limit = 18.0
C)
x 1.9 1.99 1.999 2.001 2.01 2.1
f(x) 5.043 5.364 5.396 5.404 5.436 5.763 ; limit = 5.40
D)
x 1.9 1.99 1.999 2.001 2.01 2.1
f(x) 16.692 17.592 17.689 17.710 17.808 18.789 ; limit = 17.70
Use the properties of limits to help decide whether the limit exists. If the limit exists, find its value.
146)
lim
x
5x + 1
11x2– 7
146)
A)
B)
5
11
C)
0
D)
–1
7
Use a graphing utility to find the limit, if it exists.
147)
lim
x
8
x2–64
x –8
147)
A)
Does not exist
B)
8
C)
16
D)
1
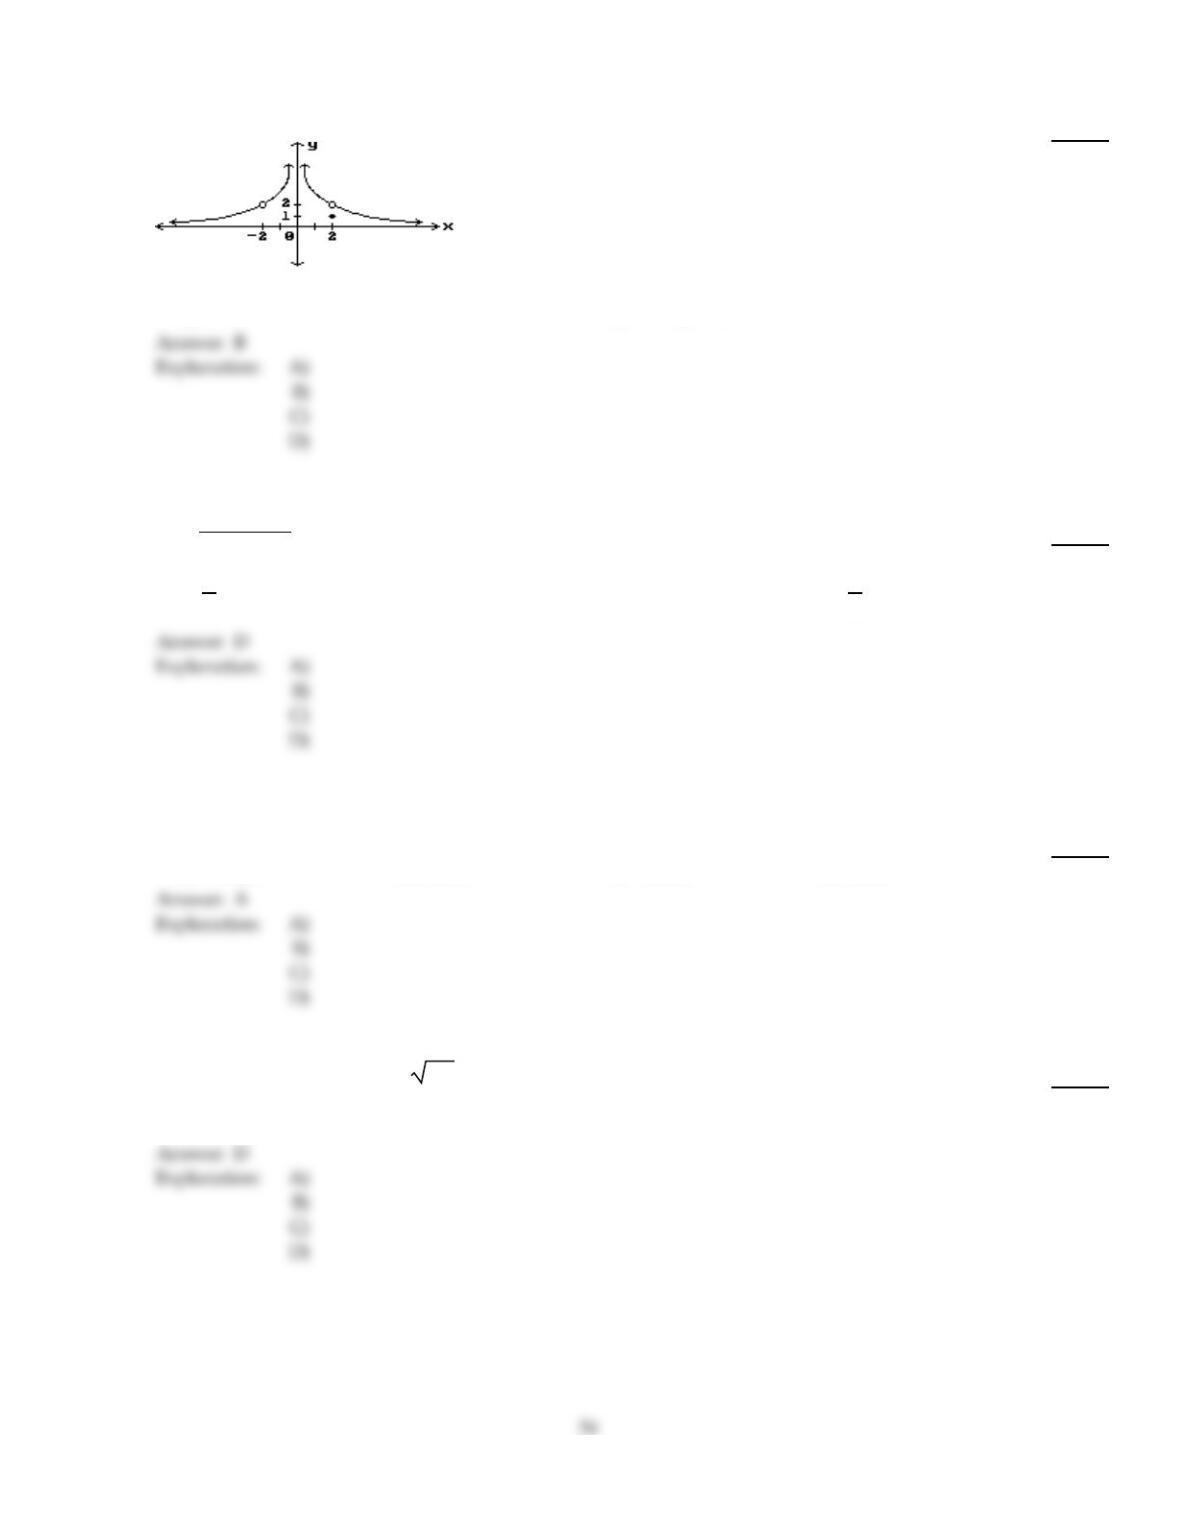
Find all points where the function is discontinuous.
148)
148)
A)
x = 0, x = 2
B)
x = – 2, x = 0, x = 2
C)
x = 2
D)
x = – 2, x = 0
Use the properties of limits to help decide whether the limit exists. If the limit exists, find its value.
149)
lim
x
4
x2–16
x2–5x +4
149)
A)
4
3
B)
0
C)
Does not exist
D)
8
3
Use the formula for instantaneous rate of change, approximating the limit by using smaller and smaller values of h, to
find the instantaneous rate of change for the function at the given value.
150)
Use a graphing utility to approximate the instantaneous rate of change of f(x) =x–ln x at x =2.
150)
A)
–0.4287
B)
0.6185
C)
–0.6548
D)
.2158
Give an appropriate answer.
151)
Let lim
x
2f(x) =225. Find lim
x
2f(x).
151)
A)
3.8730
B)
2
C)
225
D)
15
Find the instantaneous rate of change for the function at the given value.
152)
F(x) =x2+9x at x = – 1
152)
A)
–8
B)
8
C)
7
D)
–2
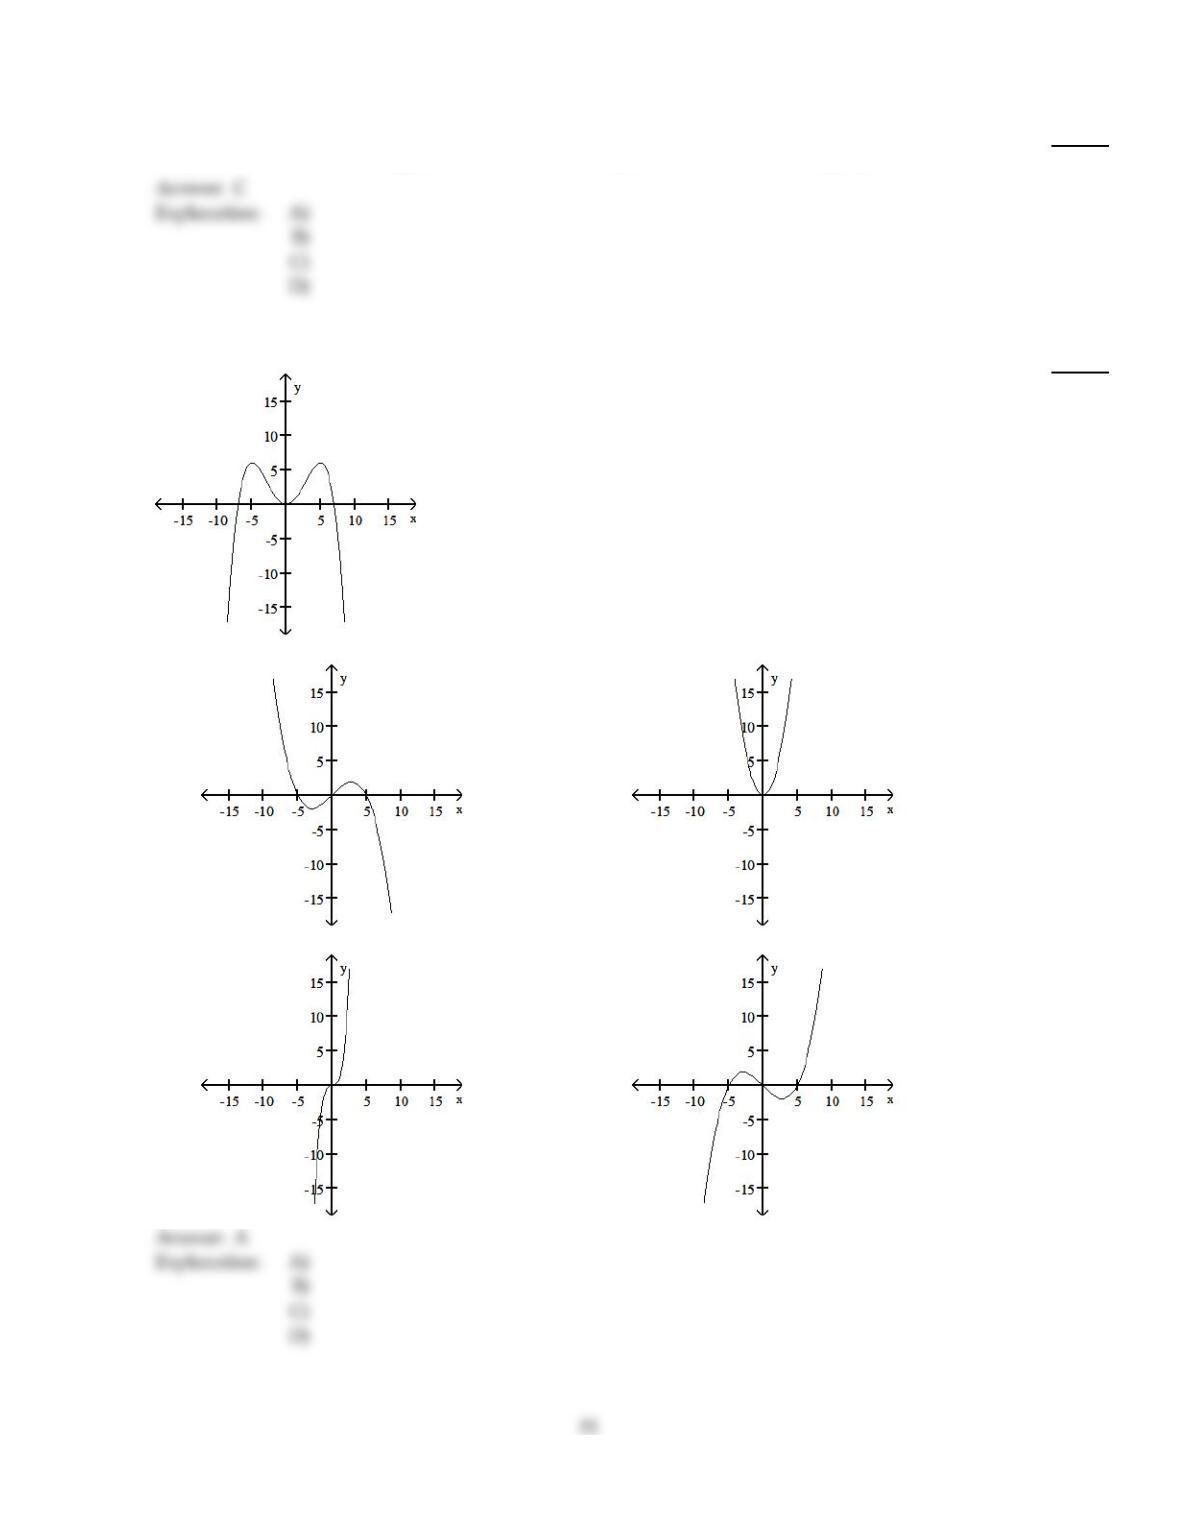
Sketch the derivative of the graph.
153)
153)
A)
B)
C)
D)
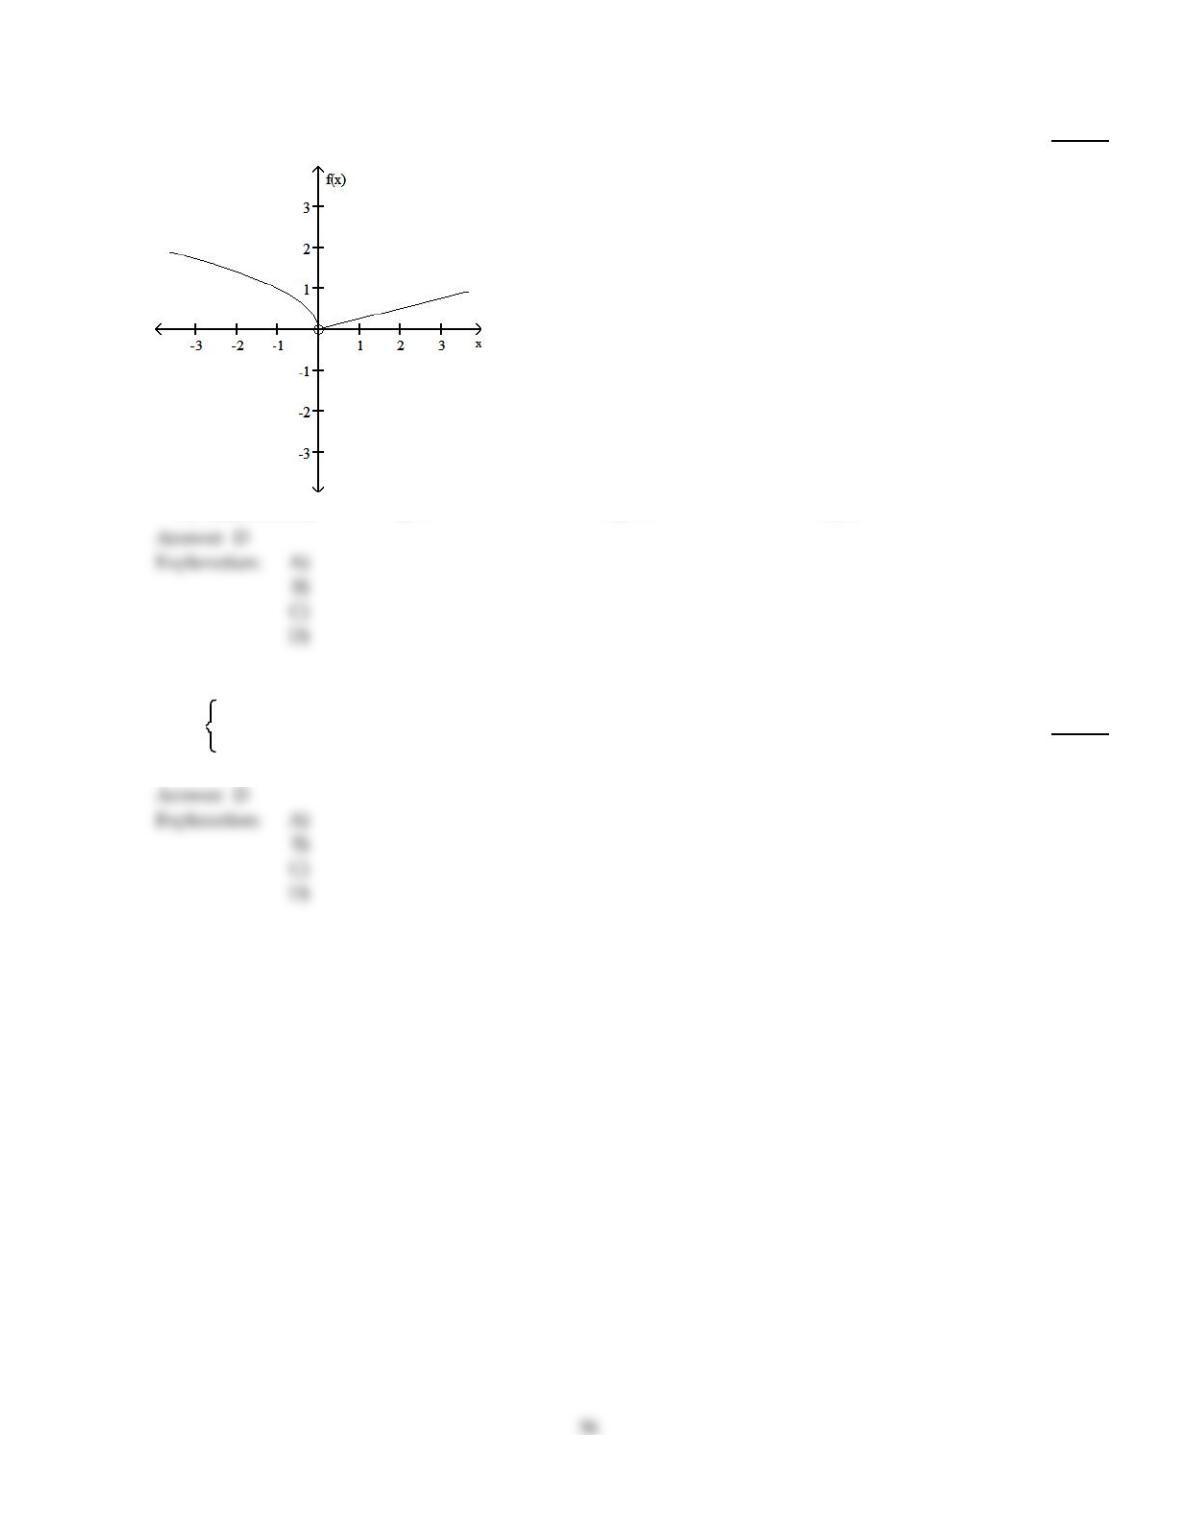
Decide whether the limit exists. If it exists, find its value.
154)
lim
x
0 f(x)
154)
A)
Does not exist
B)
1
C)
–1
D)
0
Find all values x = a where the function is discontinuous.
155)
f(x) =3x –8 if x < 0
x2+2x –8 if x 0
155)
A)
a = 0
B)
a = – 8
C)
a =2
D)
Nowhere
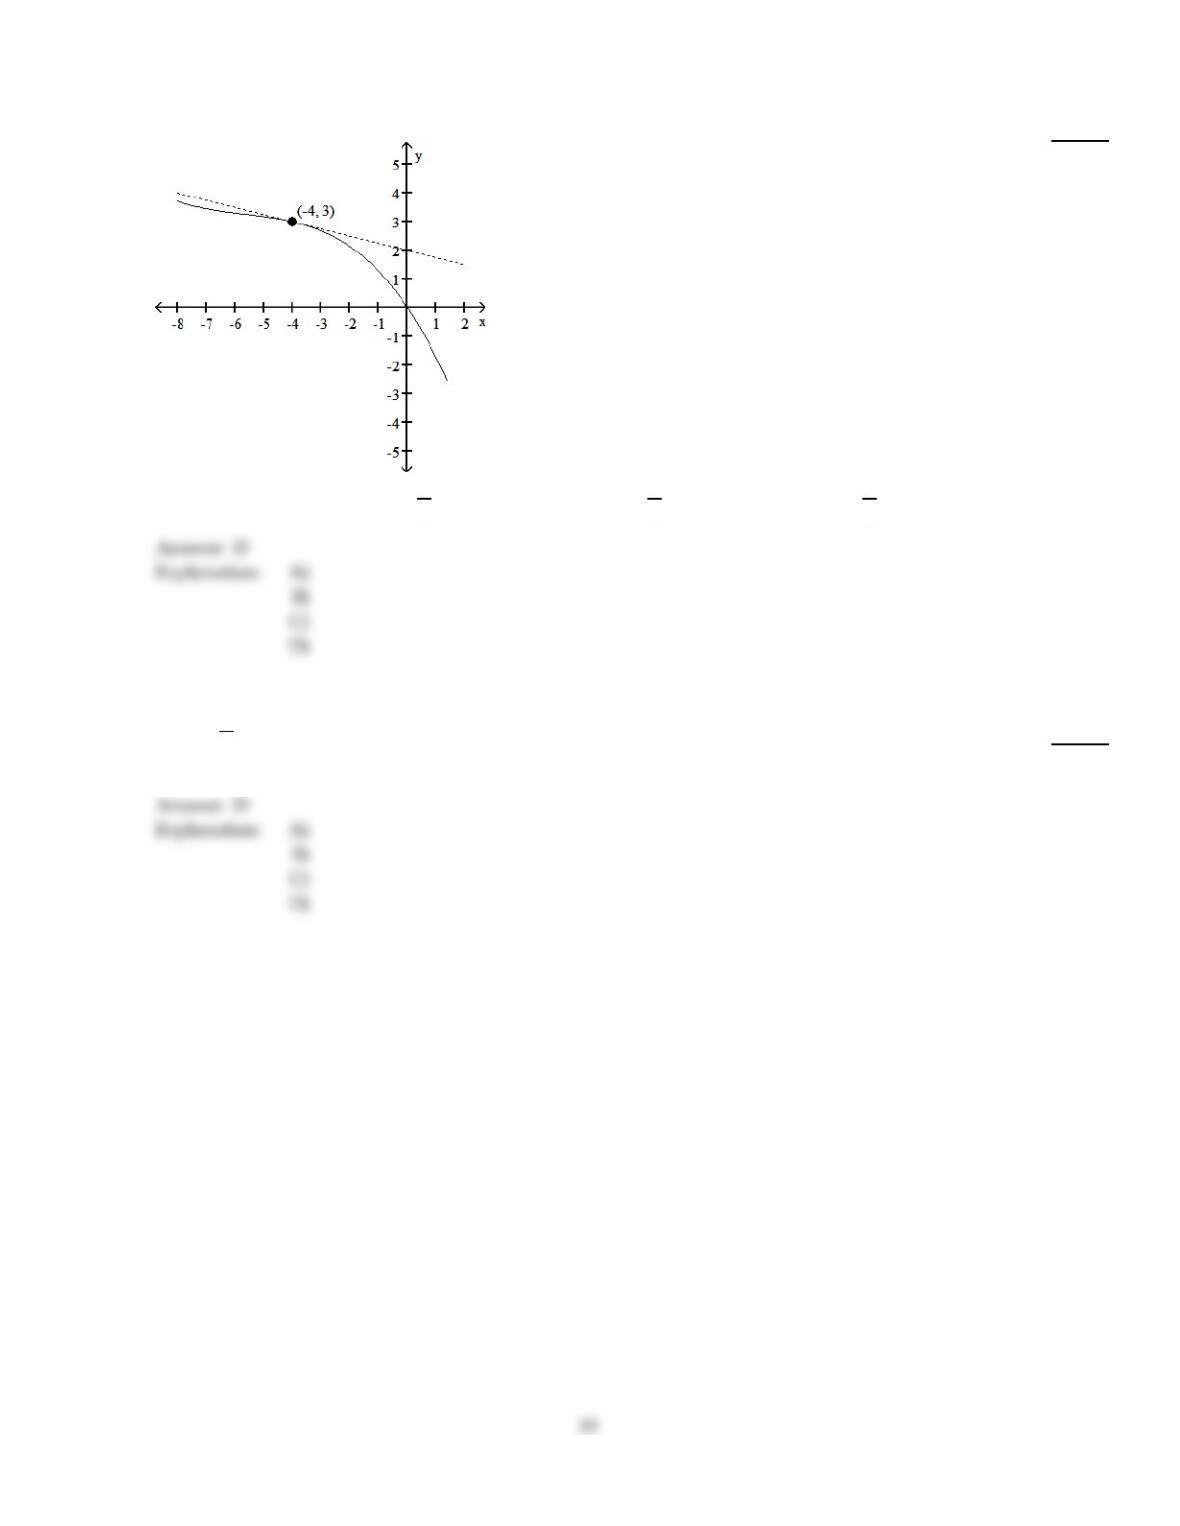
Estimate the slope of the tangent line to the curve at the given point.
156)
156)
A)
–4
B)
1
4
C)
–1
2
D)
–1
4
Use a graphing calculator to find f'(x) when x has the given value.
157)
f(x) = – 5
x; x =7
157)
A)
–0.7143
B)
9.8
C)
245
D)
0.102
Solve the problem.
158)
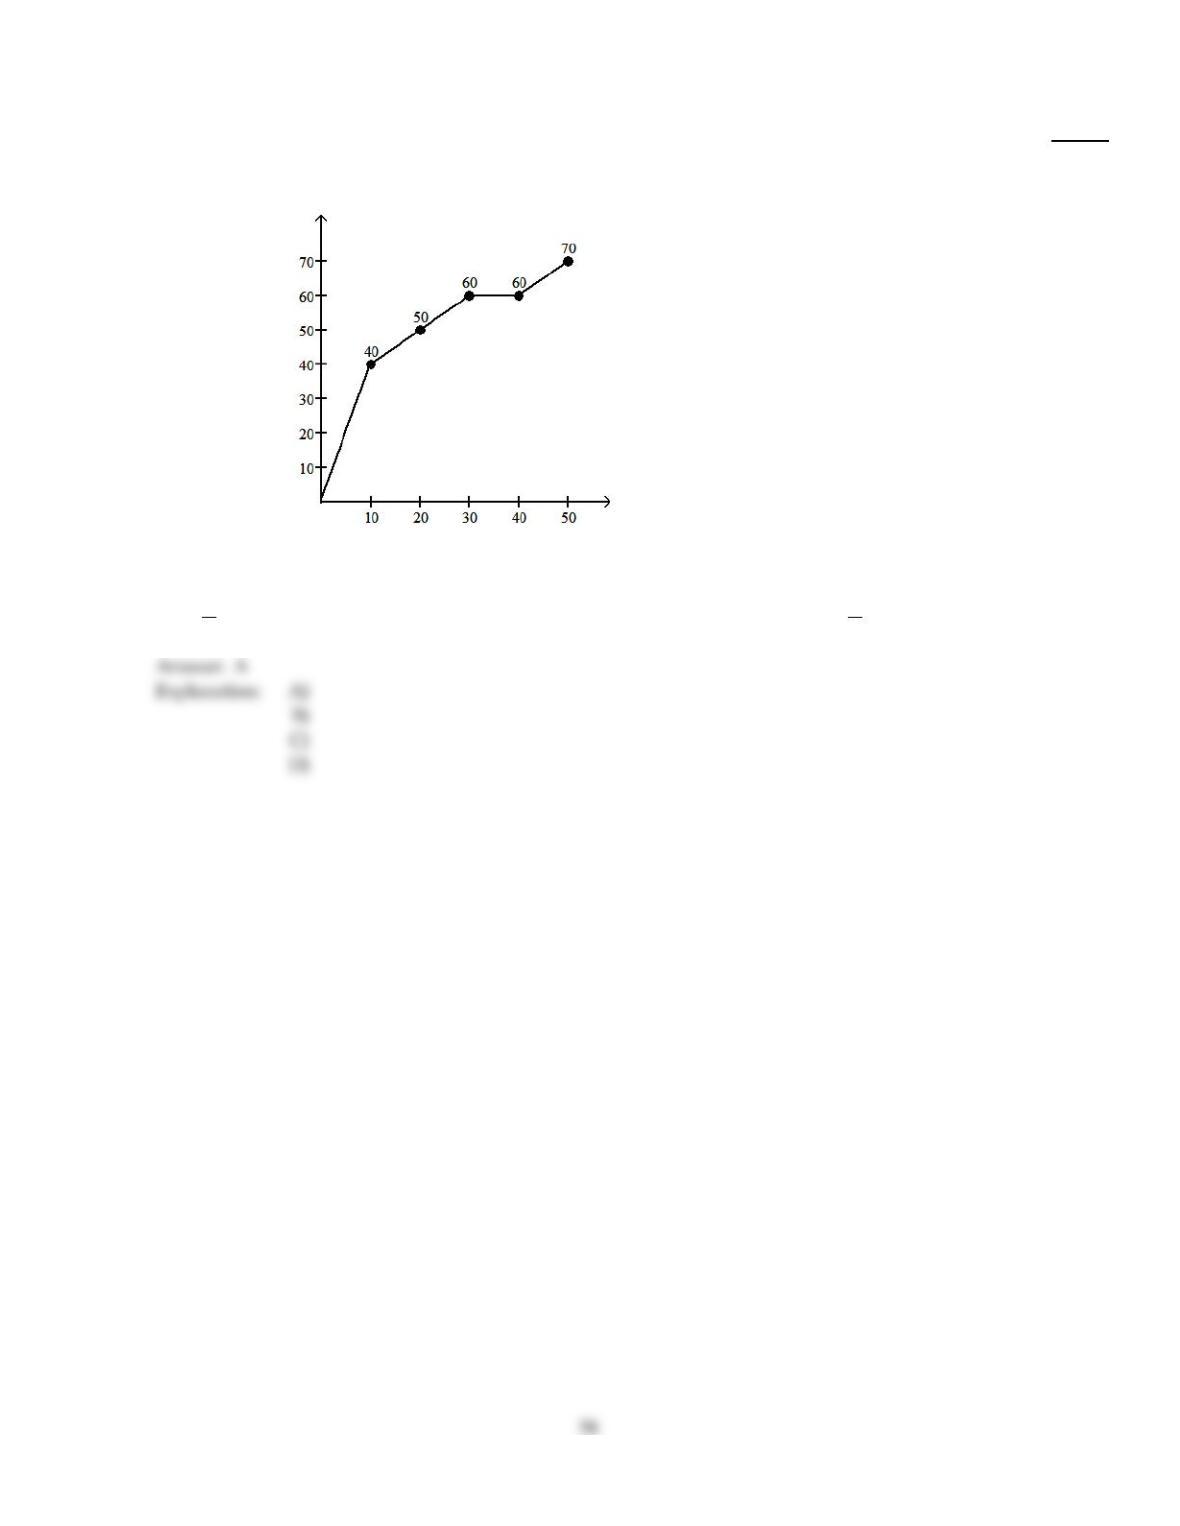
The graph shows the total sales in thousands of dollars from the distribution of x thousand
catalogs. Find the average rate of change of sales with respect to the number of catalogs distributed
from 10 to 50.
Sales
(in thousands)
Number (in thousands)
158)
A)
3
4
B)
1
C)
2
D)
1
4
Answer Key
Testname: C3
59
Answer Key
Testname: C3
Answer Key
Testname: C3
Answer Key
Testname: C3