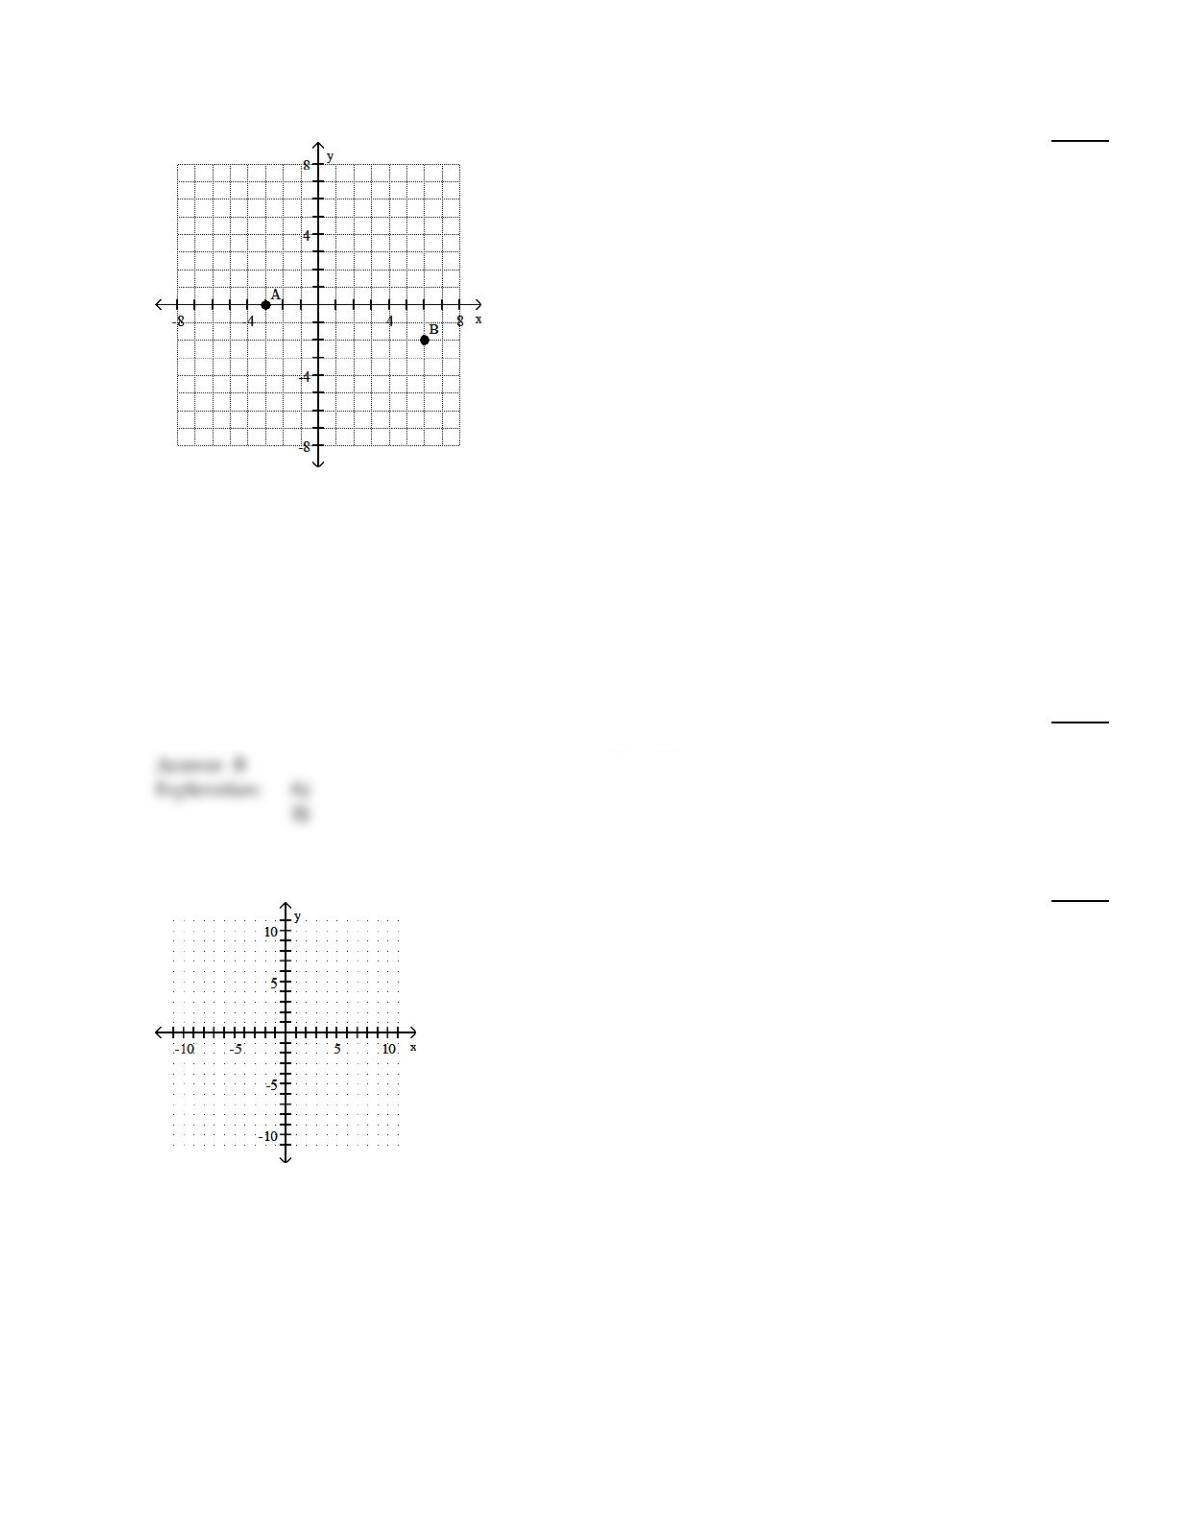
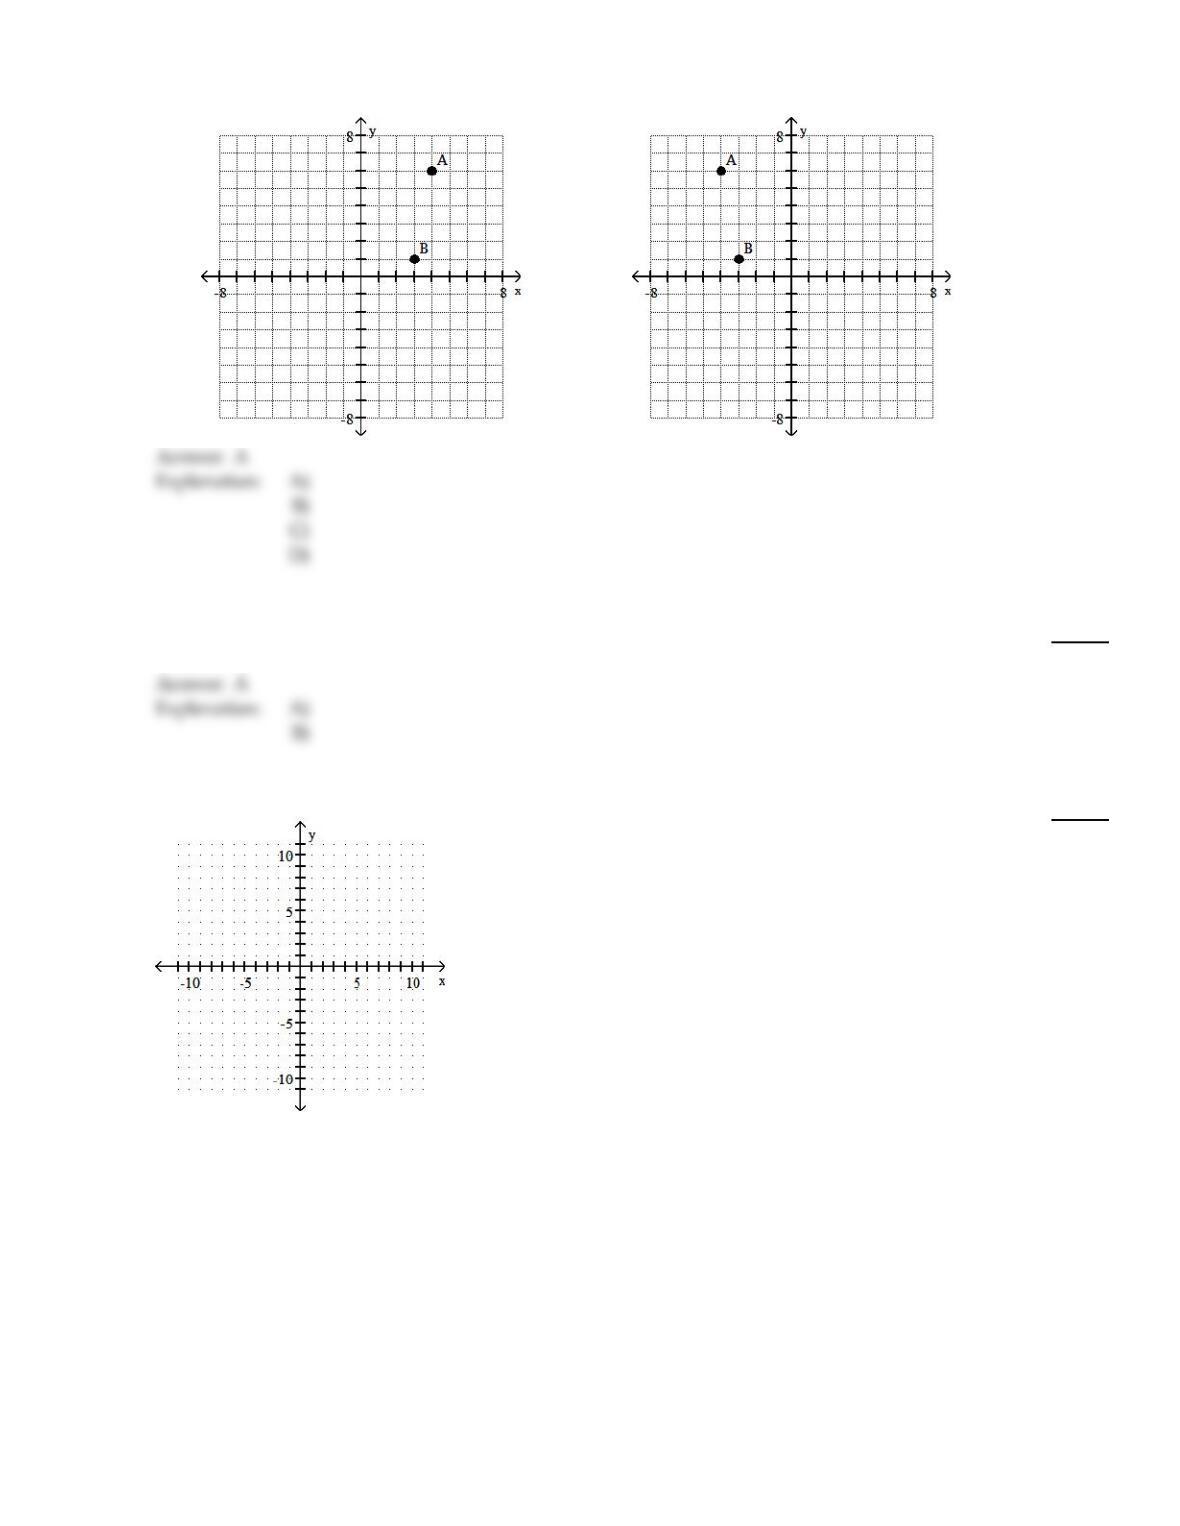
Give the ordered pairs for the points labeled on the graph.
112)
112)
A)
A(–3, 3); B(6, –2)
B)
A(–3, 0); B(–6, –2)
C)
A(–3, 0); B(6, –2)
D)
A(3, 0); B(6, –2)
Answer:
C
Explanation:
A)
B)
C)
D)
Answer the question.
113)
True or False: The graph of the equation y = – 7 goes through the origin.
113)
A)
True
B)
False
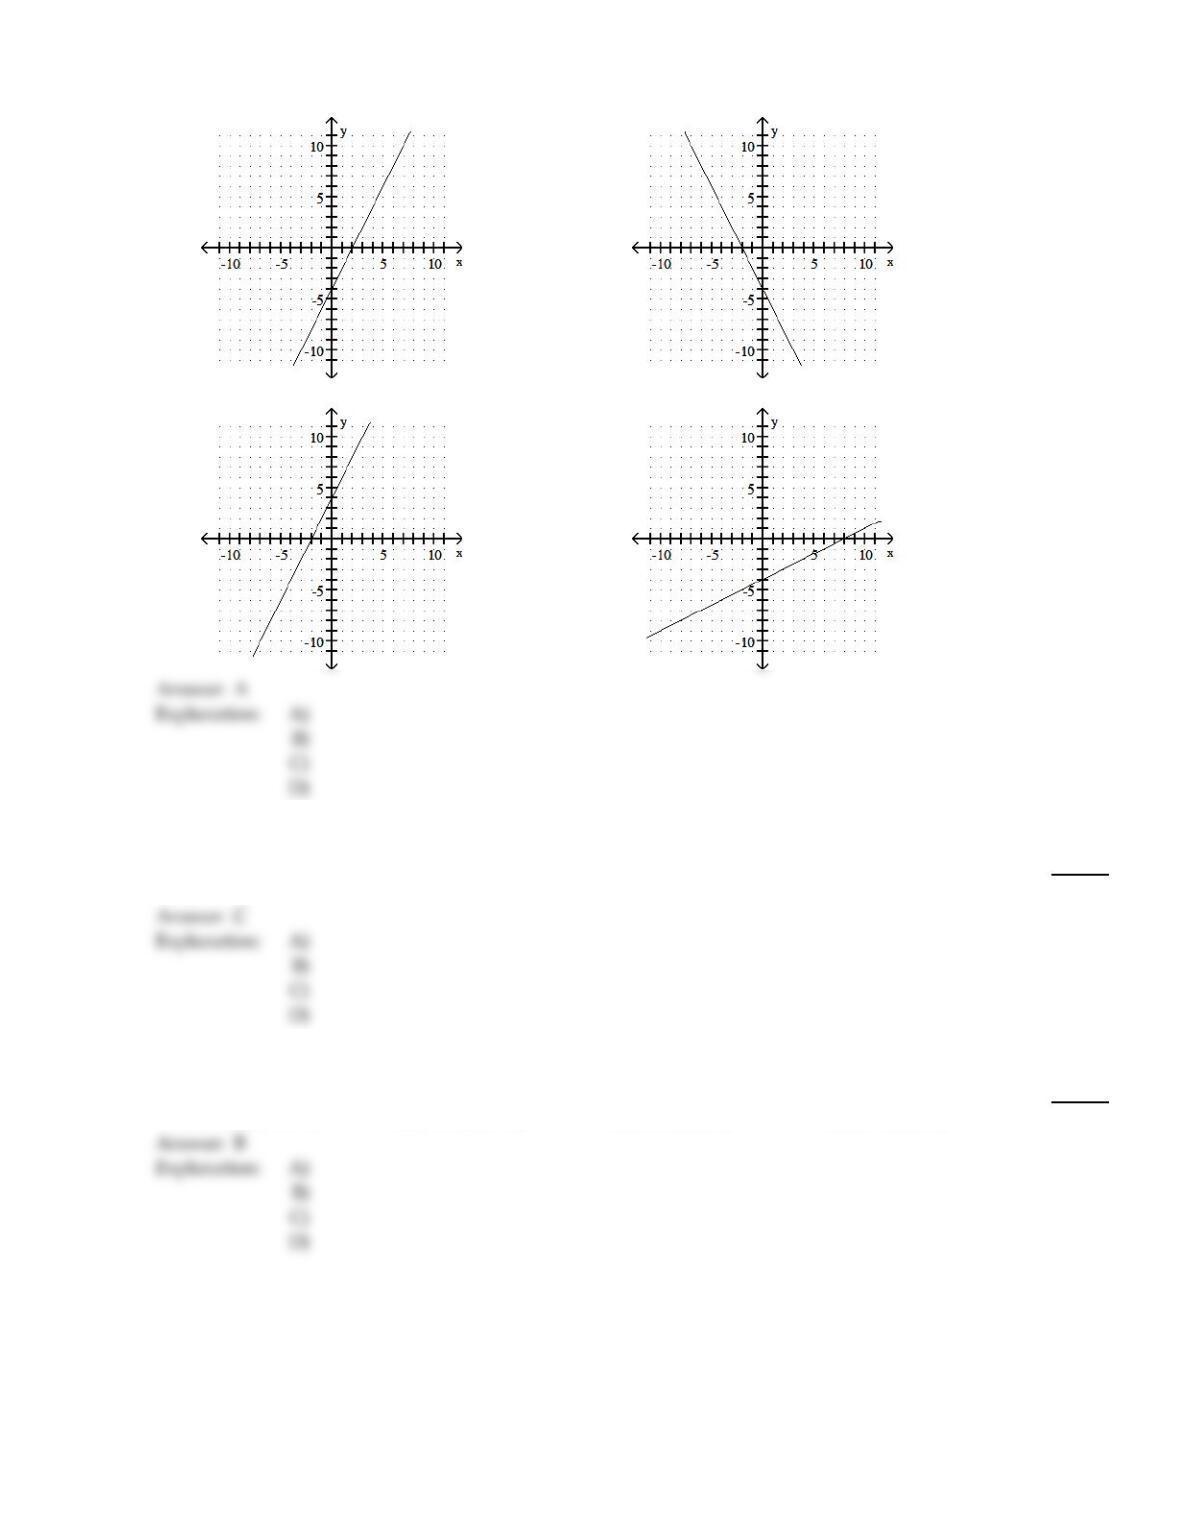
Complete the ordered pairs. Then graph the equation by plotting the points and drawing a line through them.
114)
y =2x – 4 (0, ), ( , 0), (4, )
114)
61
Answer:
B
Explanation:
A)
B)
A)
(0, –4), (2, 0), (4, 4)
B)
(0, –4), (–2, 0), (4, –12)
C)
(0, 4), (–2, 0), (4, 12)
D)
(0, –4), (–8, 0), (4, –2)
Find the slope of the line going through the given pair of points.
115)
(–2, 1) and (2, 1)
115)
A)
1
B)
3
C)
0
D)
7
C
Find the intercepts for the graph of the equation.
116)
x + y = – 1
116)
A)
(–1, 4) (–5, –1)
B)
(–1, 0) (0, –1)
C)
(–5, 0) (4, 0)
D)
(0, –5) (0, 4)
B
62
A
The table of values gives two points that lie on a line. Use the points to find the slope and y–intercept of the line. Then
use these values to write an equation of the line in slope–intercept form.
117)
x y
2–1
–3–5
117)
A)
y = – 3
2x –1
2
B)
y = – 4
5x –13
5
C)
y =3
2x –1
2
D)
y =4
5x –13
5
Complete the ordered pair for the given equation.
118)
y = – 4x – 24 (–8, )
118)
A)
(–8, –8)
B)
(–8, 3)
C)
(–8, 8)
D)
(–8, –24)
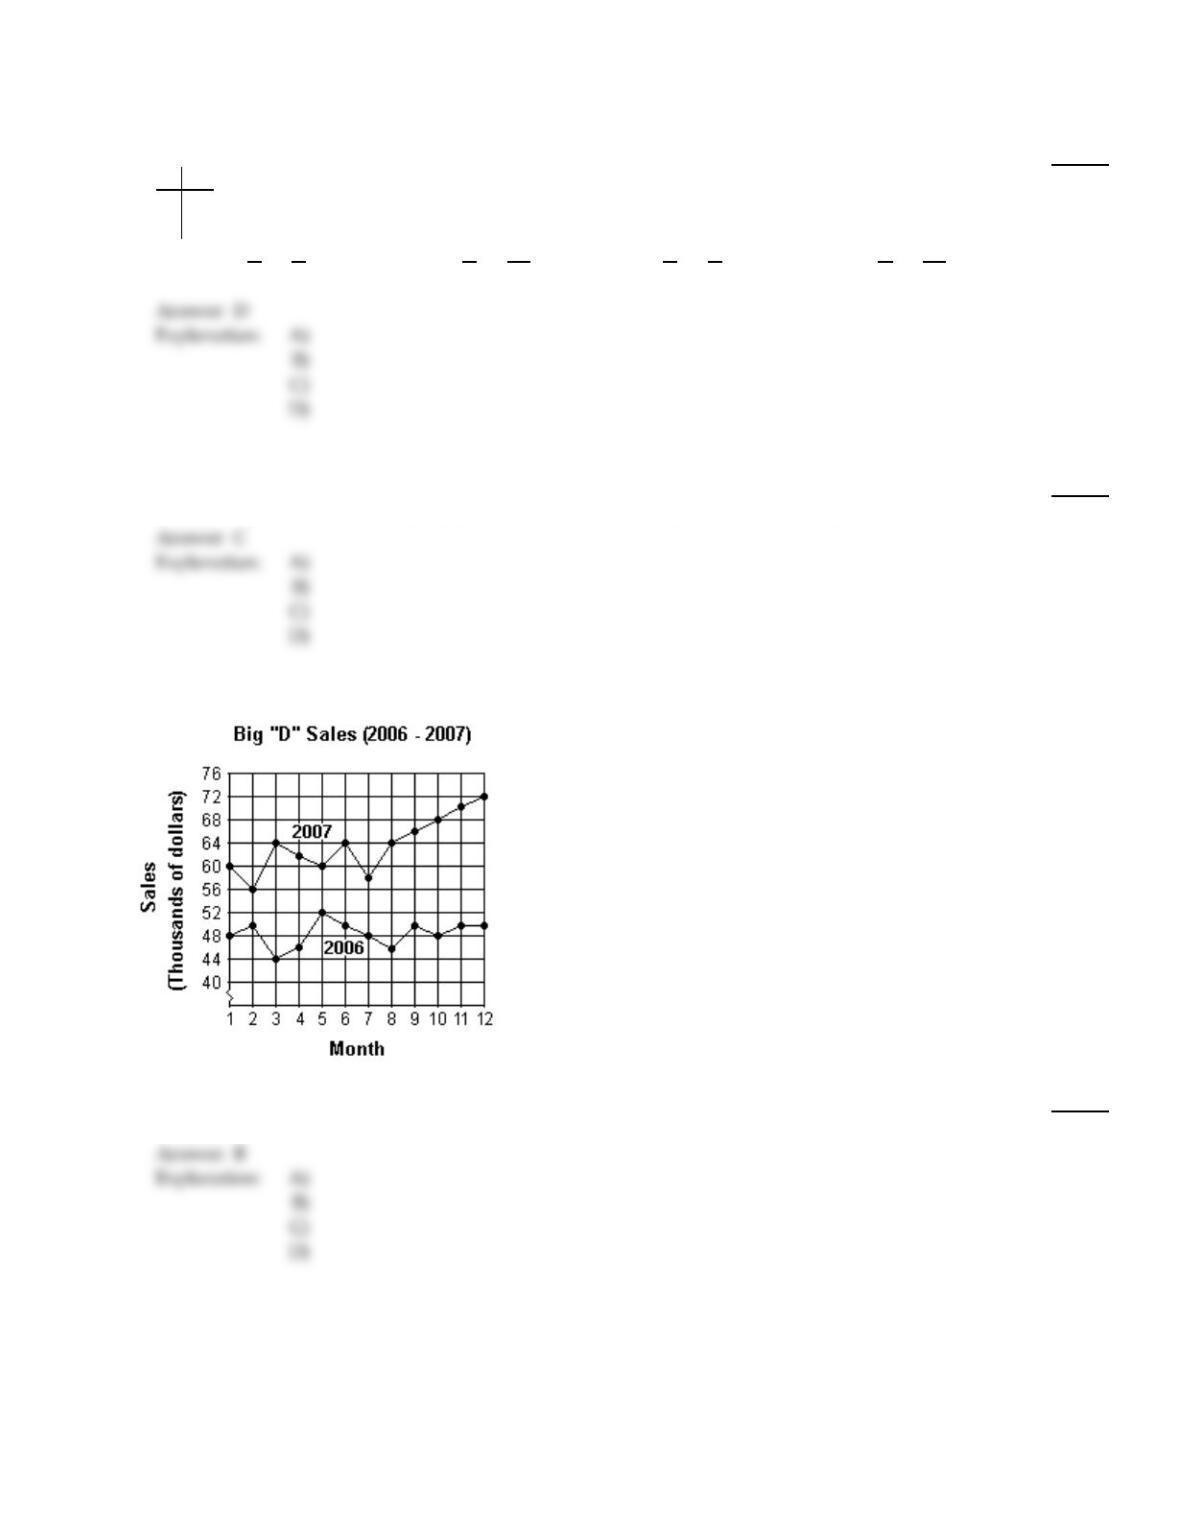
Use the graph to answer the question.
119)
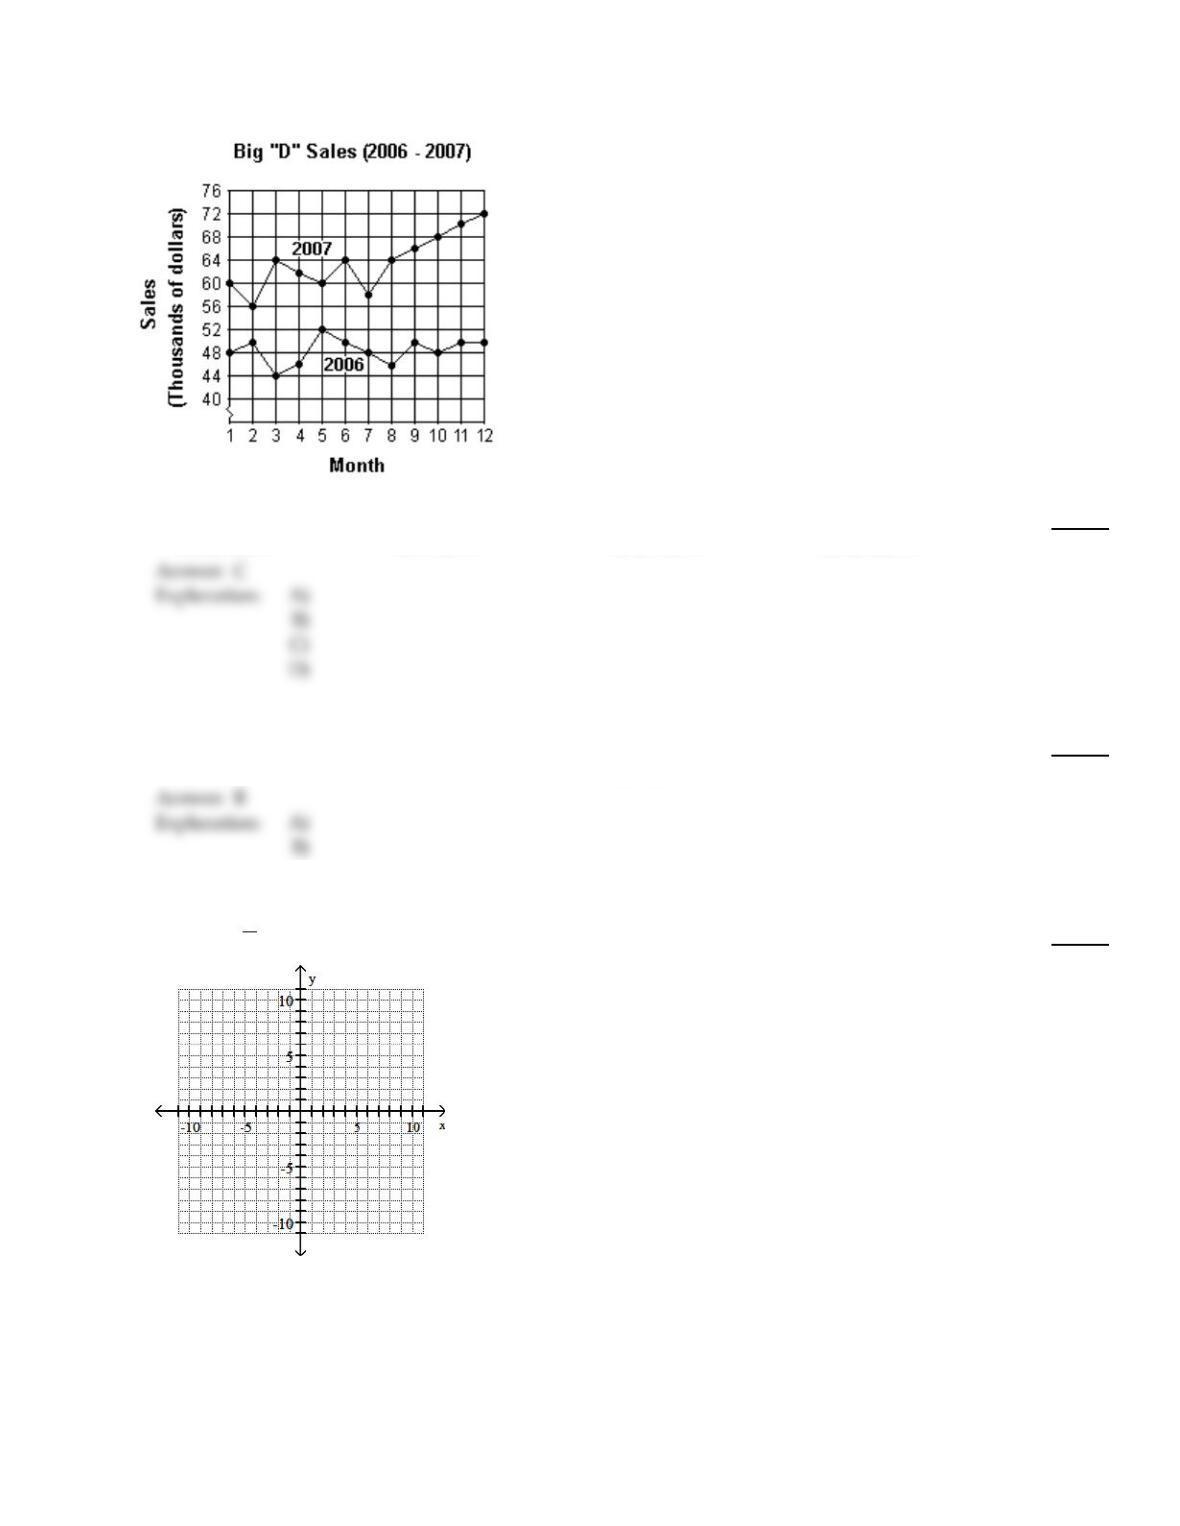
What was the increase in sales between month 5 and month 6 of 2007?
119)
A)
$800
B)
$4000
C)
$8000
D)
$4
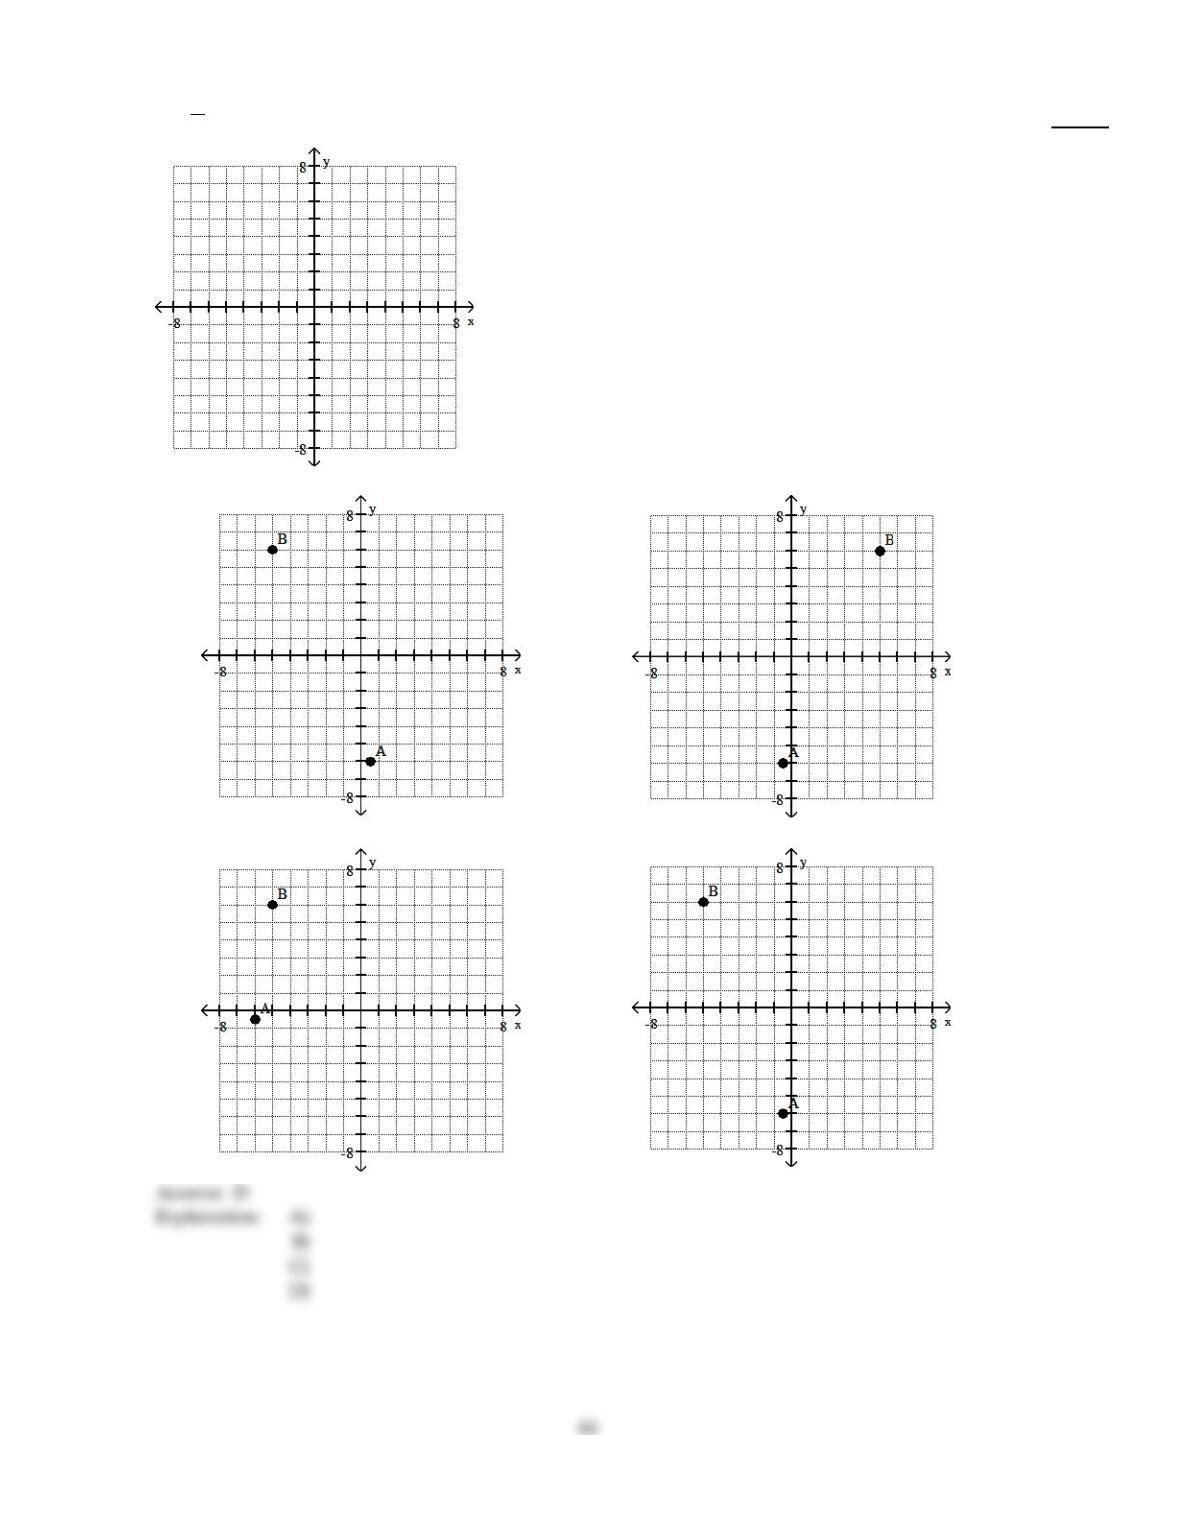
Plot the ordered pairs on the rectangular coordinate system provided.
63
120)
A(–1
2, –6), B(–5, 6)
120)
A)
B)
C)
D)
Use the graph to answer the question.
121)
What were the total sales for the first 6 months of 2007?
121)
A)
$286,000
B)
$64,000
C)
$366,000
D)
$302,000
Answer the question.
122)
True or False? In quadrant IV, the y–coordinate is always positive.
122)
A)
True
B)
False
Graph the line through the given point with the given slope.
123)
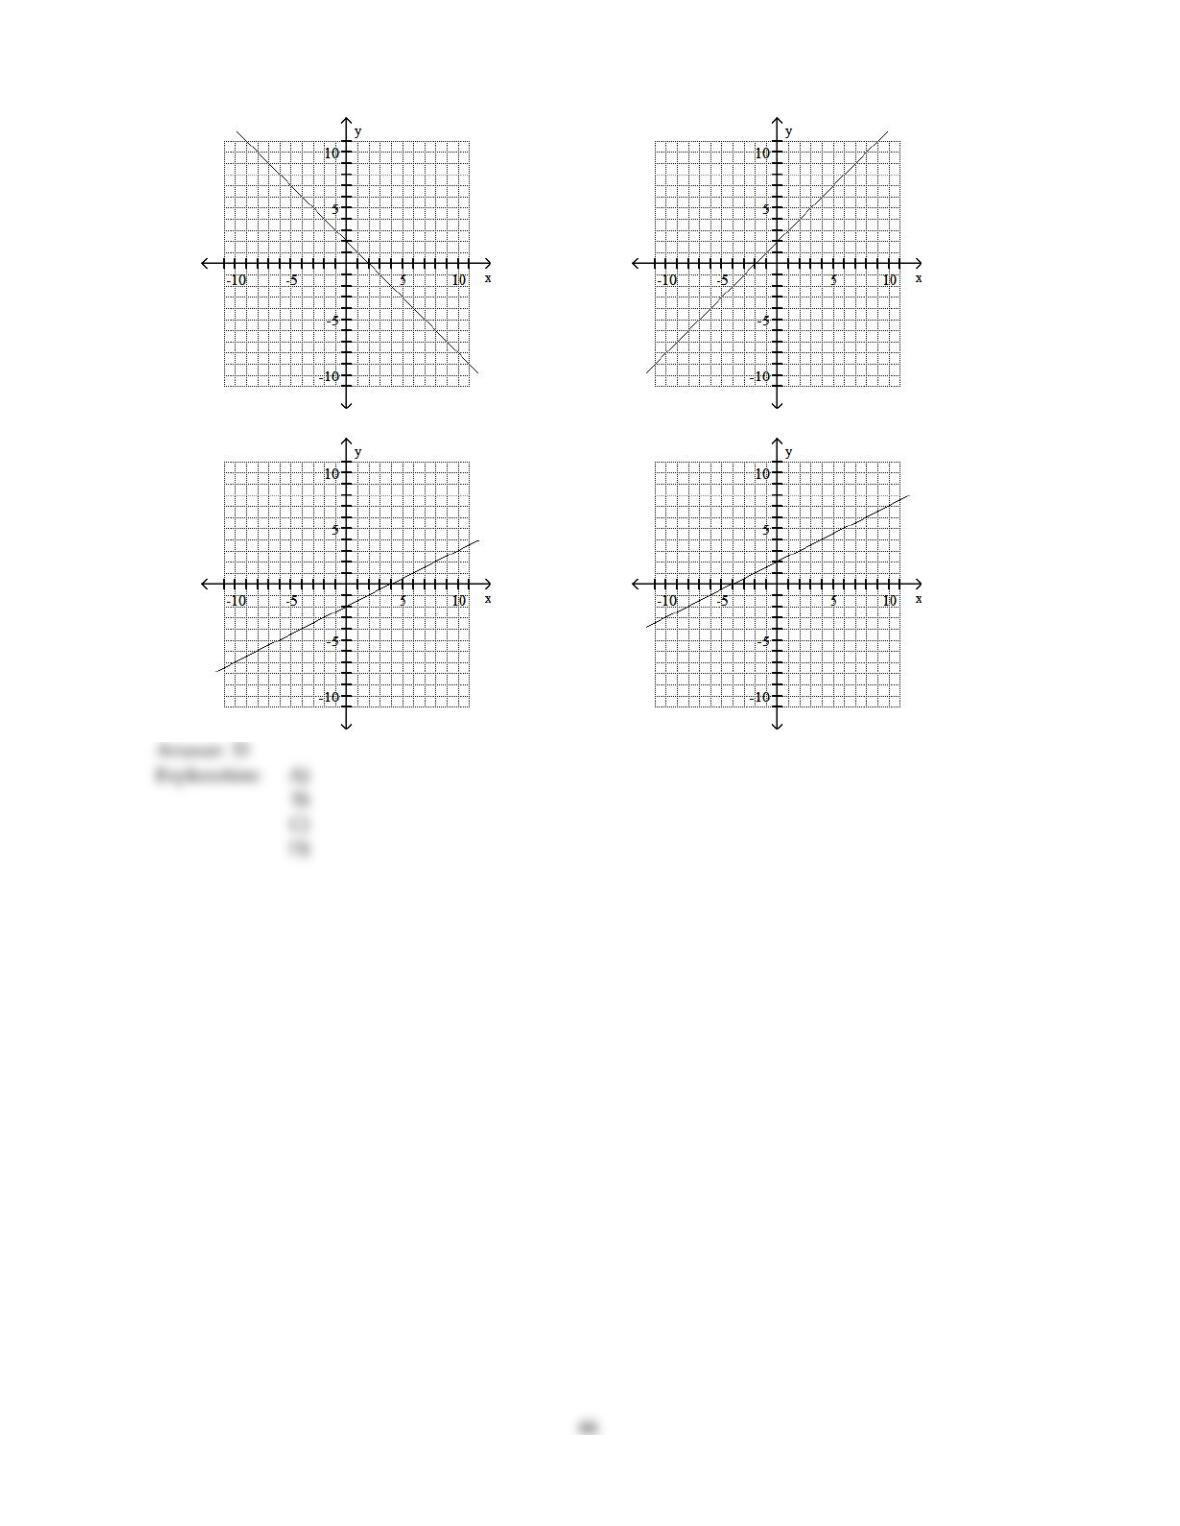
(4, 4), m =1
2
123)
65
A)
B)
C)
D)
Solve the problem.
124)
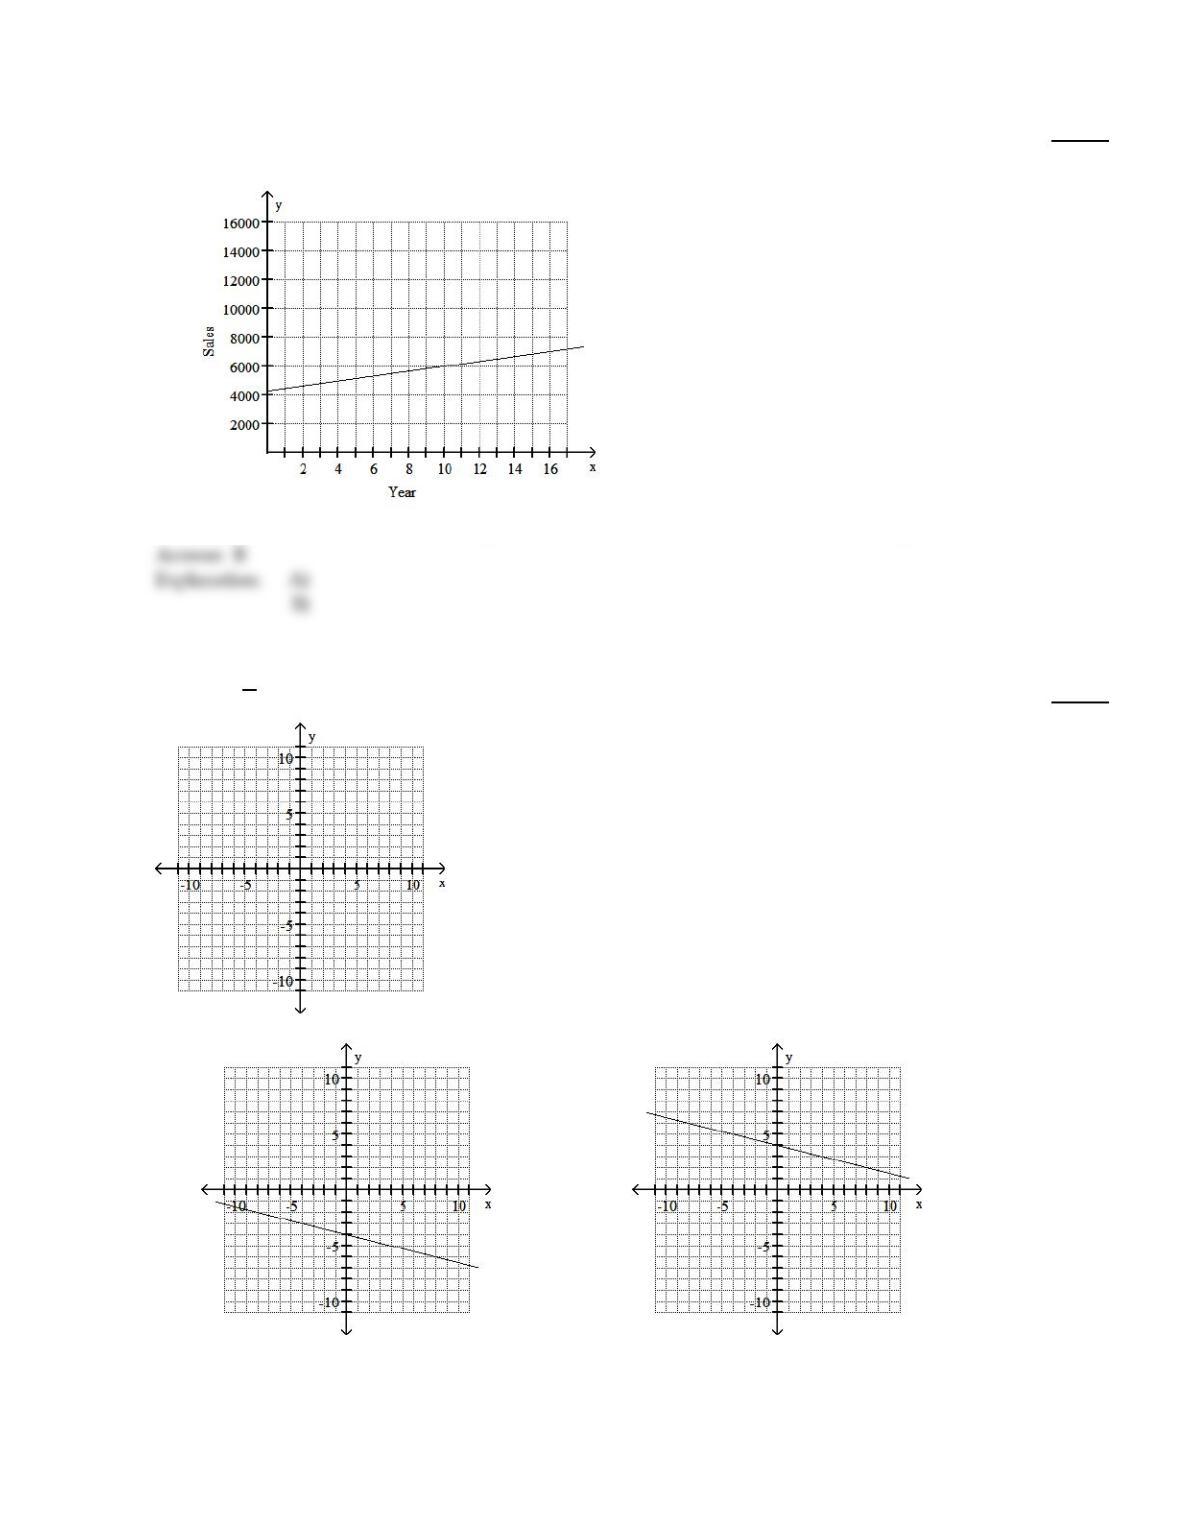
The graph shows the sales of a particular brand of appliance from 1992 to 2010, where 1992
corresponds to x = 0. Is the slope of the line in the graph positive or negative? Explain.
124)
A)
Negative; The sales are decreasing.
B)
Positive; The sales are increasing.
Graph the line through the given point with the given slope.
125)
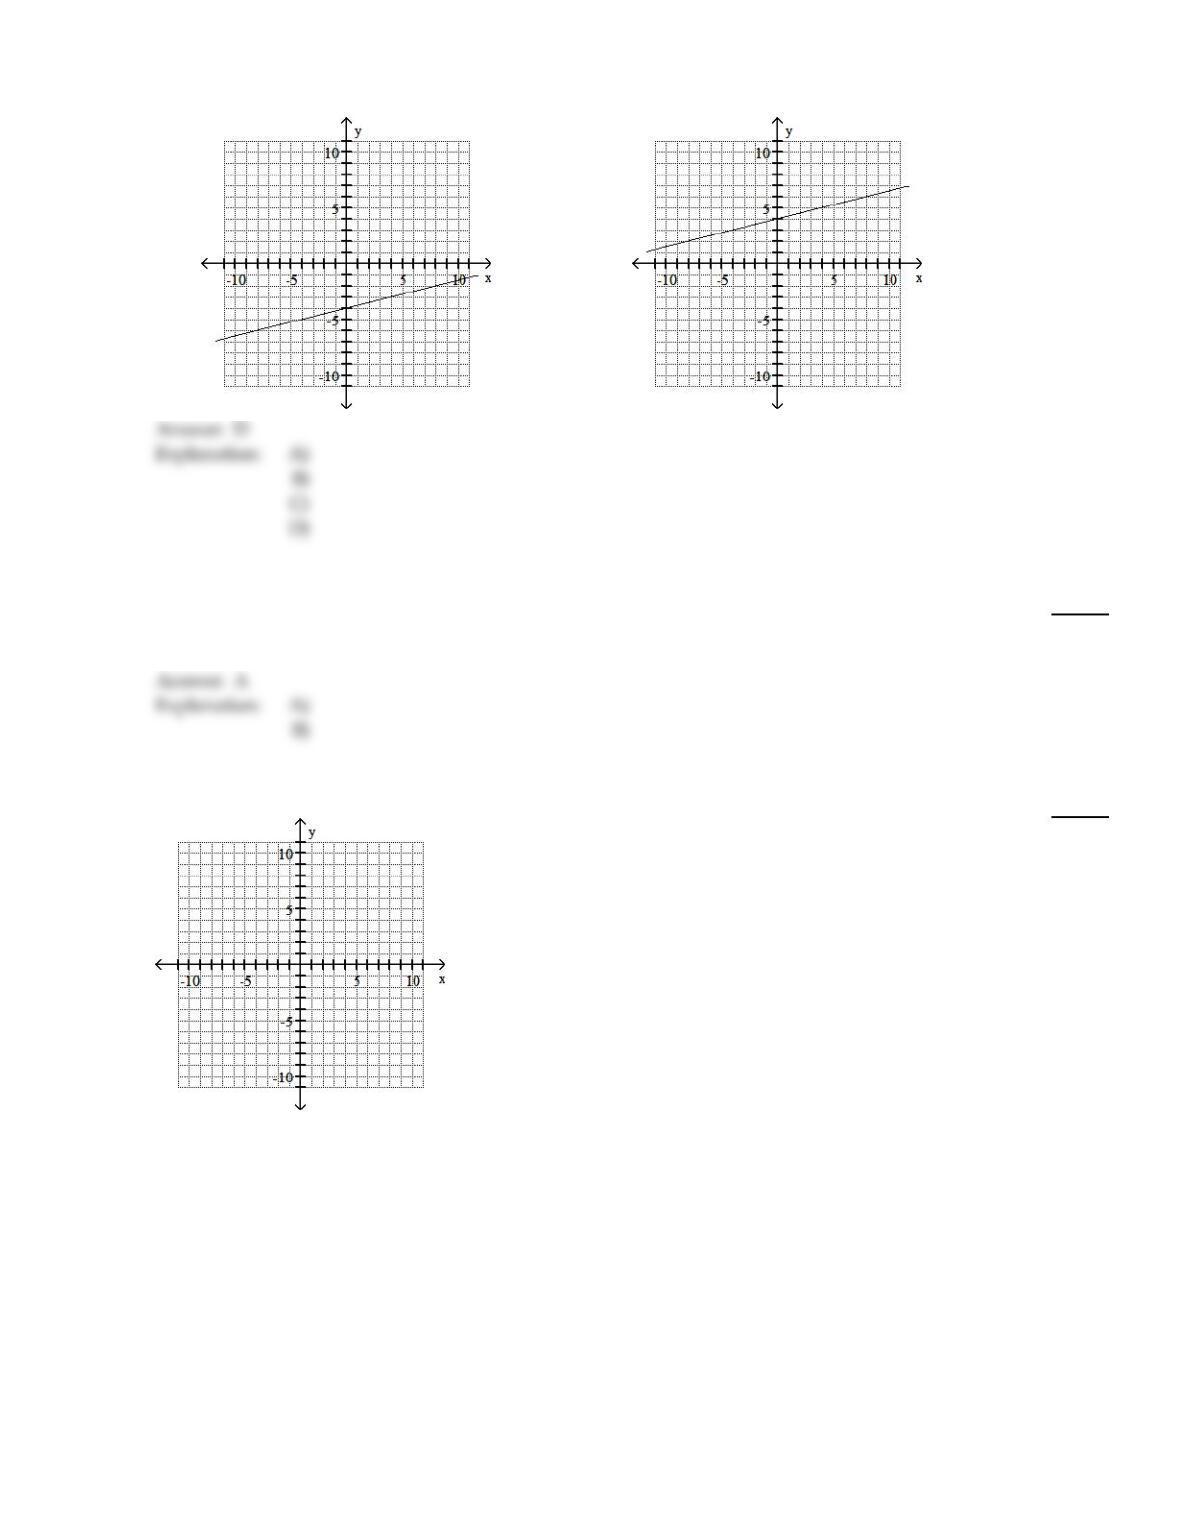
(0, 4), m =1
4
125)
A)
B)
67
C)
D)
Answer the question.
126)
True or False? The ordered pair (–3, 3) determines a point in quadrant II with x–coordinate –3 and
y–coordinate 3.
126)
A)
True
B)
False
Graph the line through the given point with the given slope.
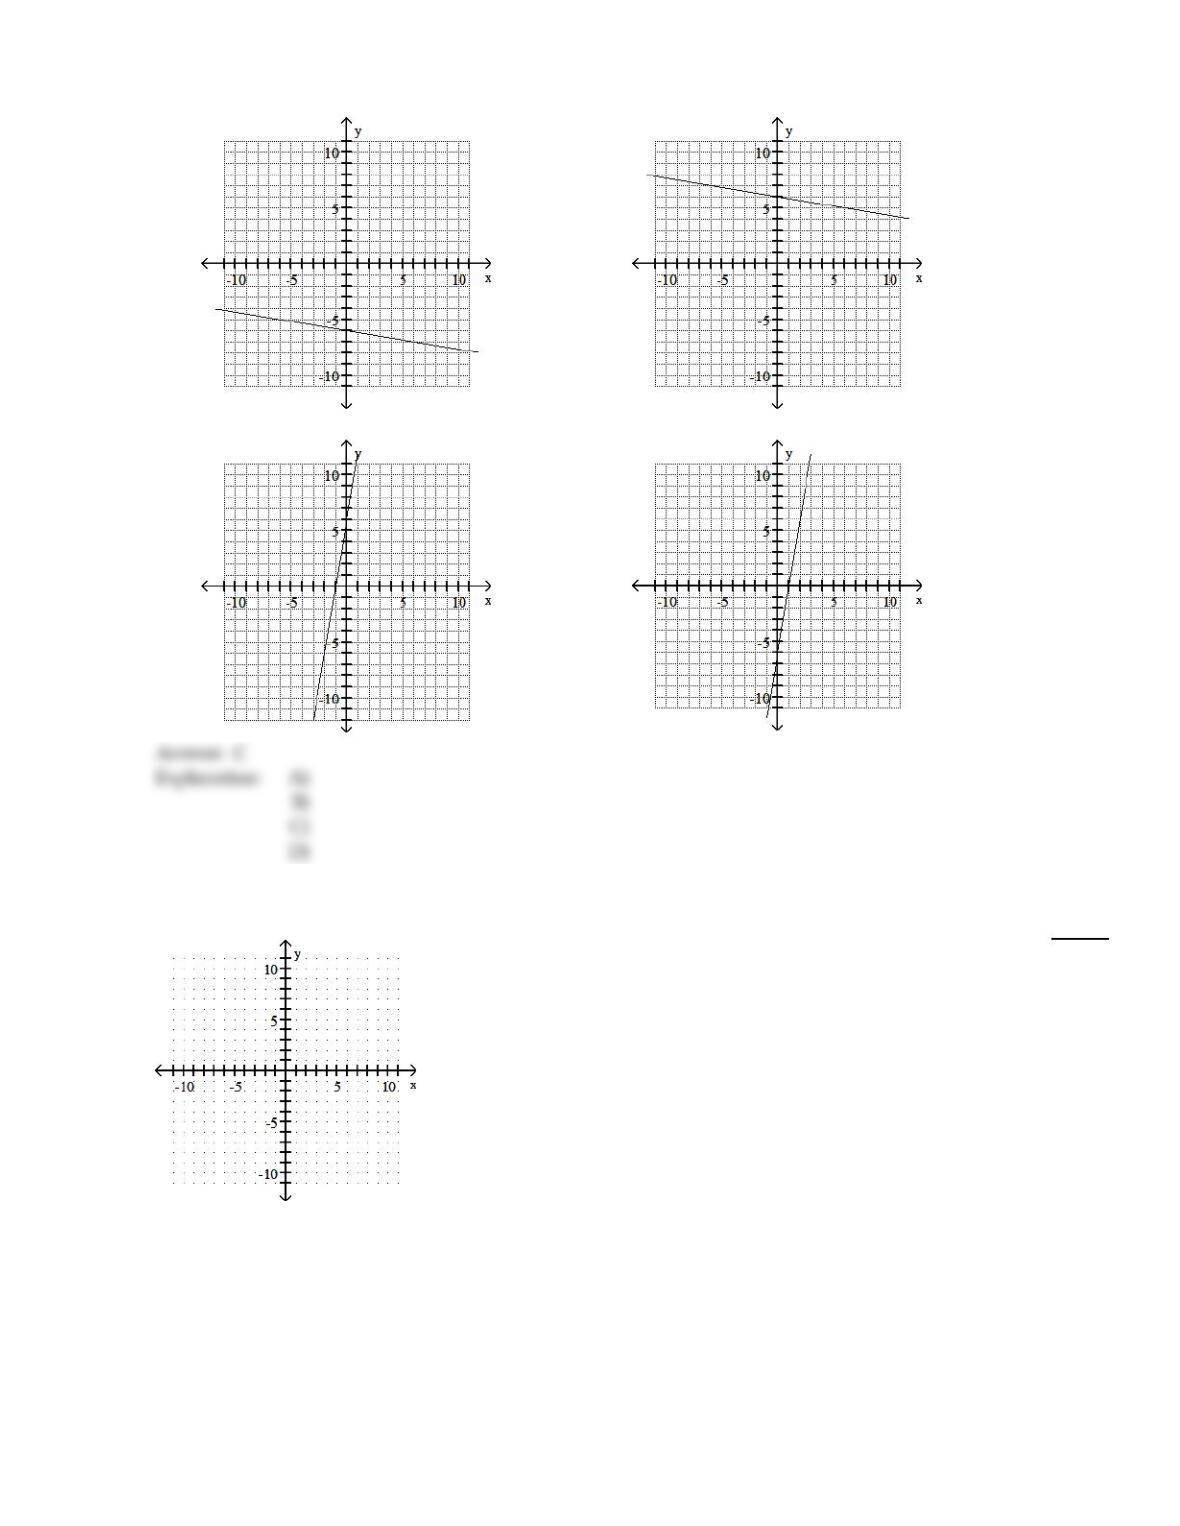
127)
(–2, –6), m =6
127)
68
A)
B)
C)
D)
Complete the ordered pairs. Then graph the equation by plotting the points and drawing a line through them.
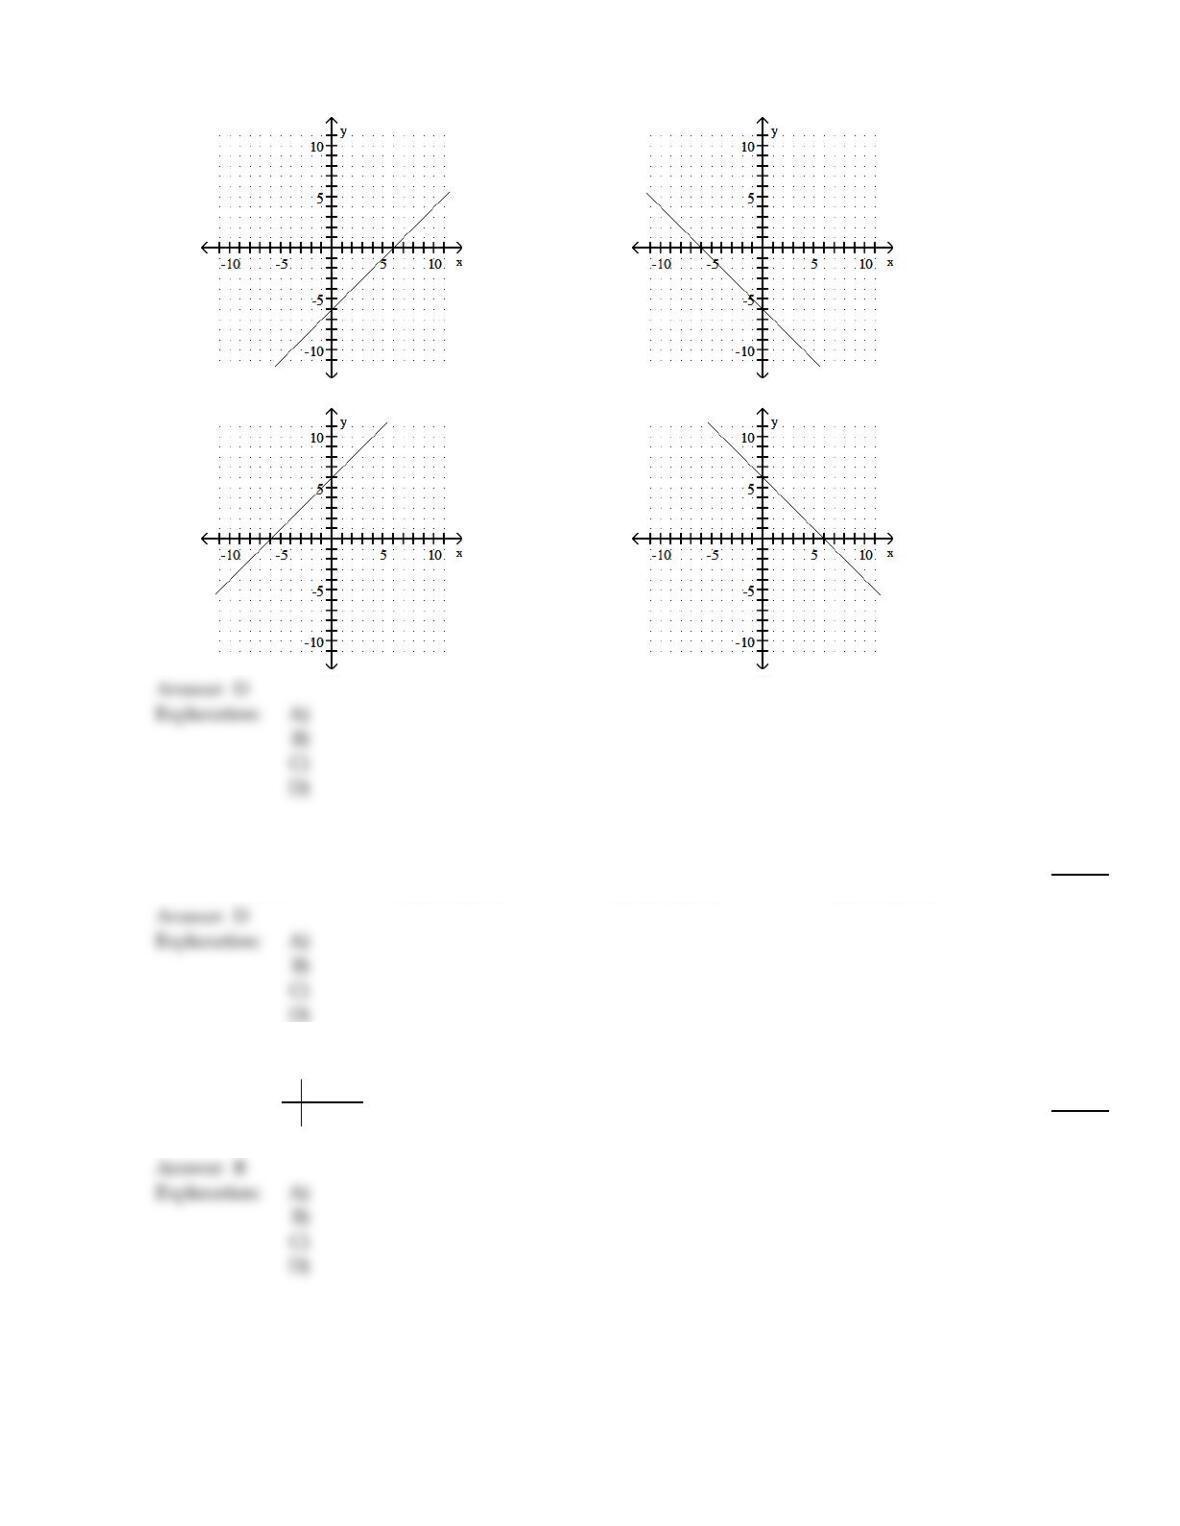
128)
x + y =6 (0, ), ( , 0), (2, )
128)
69
A)
(0, –6), (6, 0), (2, –4)
B)
(0, –6), (–6, 0), (2, –8)
C)
(0, 6), (–6, 0), (2, 8)
D)
(0, 6), (6, 0), (2, 4)
Find the intercepts for the graph of the equation.
129)
x + y =5
129)
A)
(0, 3) (0, 2)
B)
(3, 0) (2, 0)
C)
(5, 2) (3, 5)
D)
(5, 0) (0, 5)
Complete the table of values for the given equation.
130)
y = – 5x 0 2 4
y
130)
A)
3; 3; 3
B)
–5; –5; –5
C)
0; 2; 4
D)
0; 0; 0
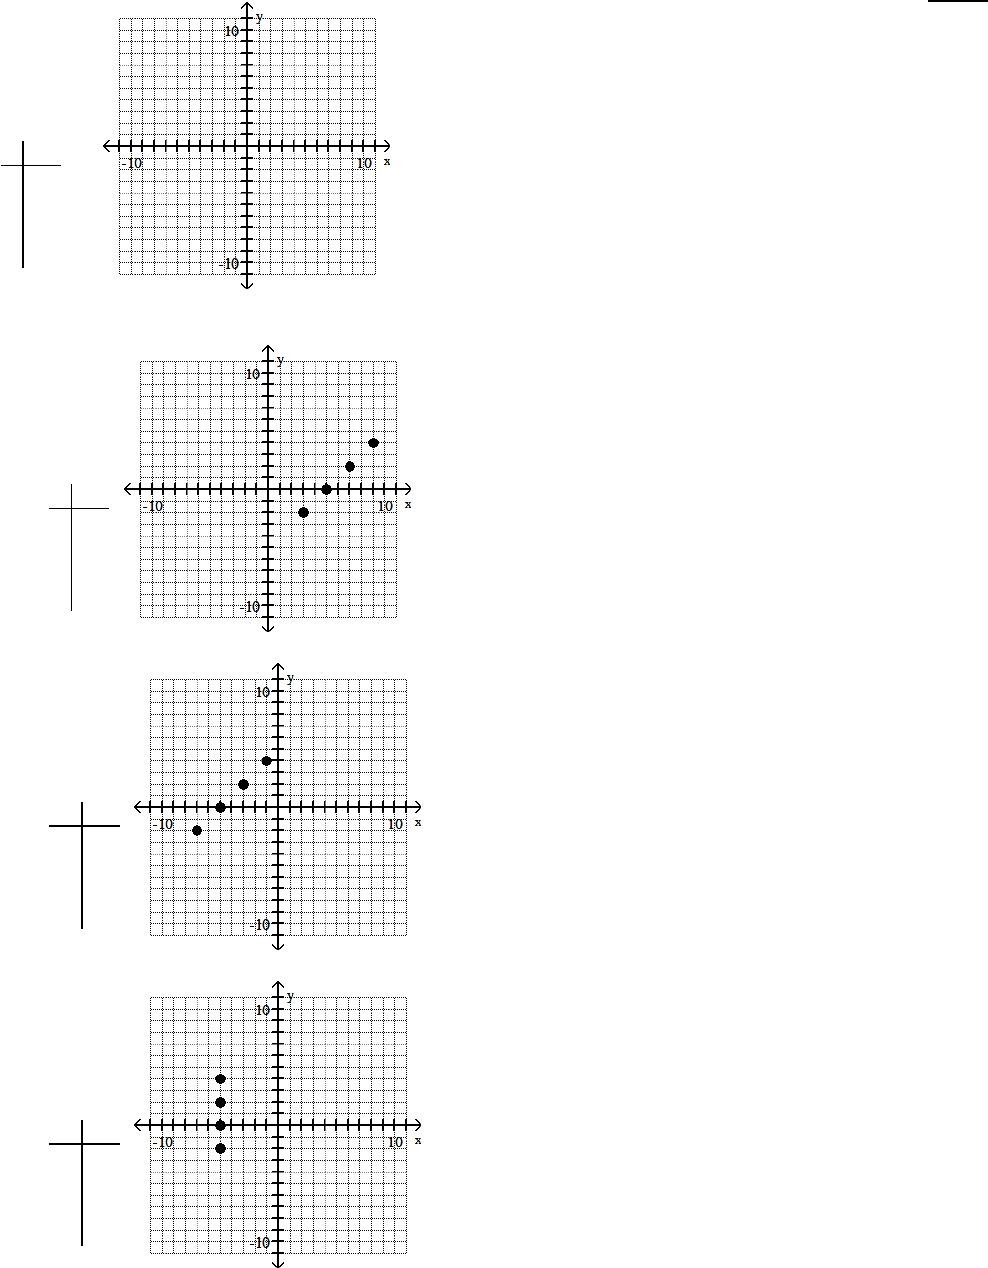
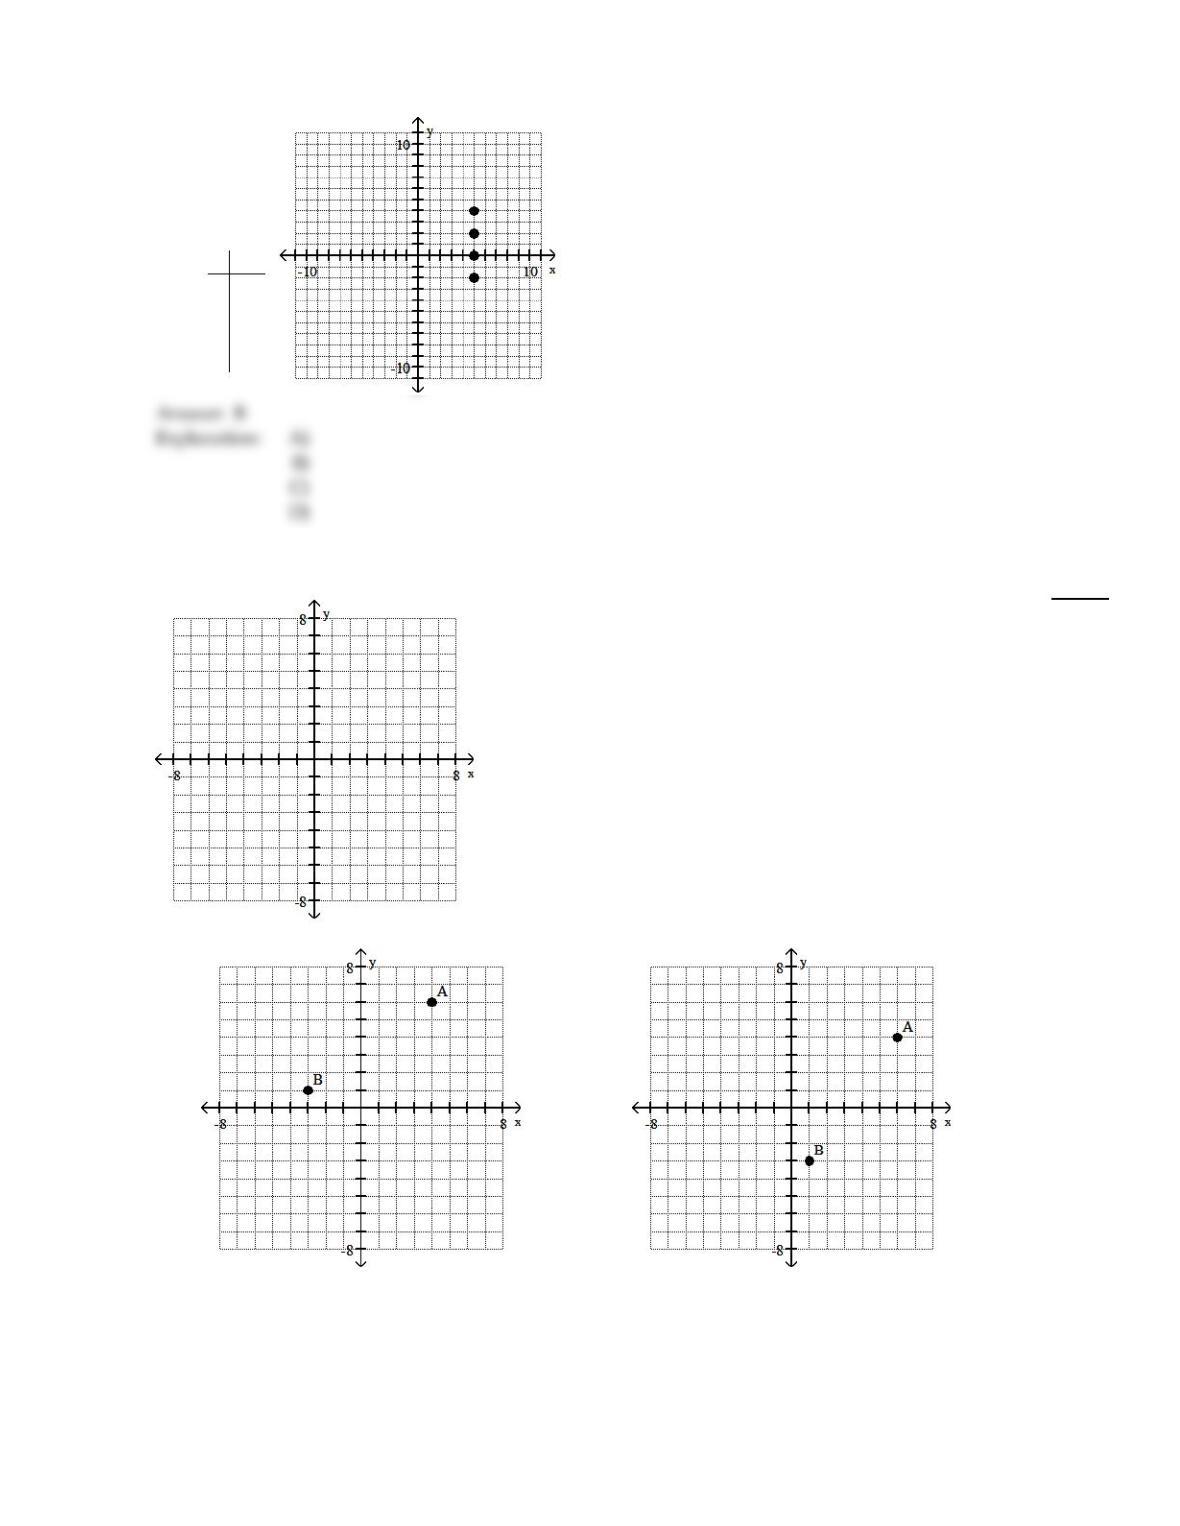
For the given equation, complete the table of values and plot the resulting ordered pairs.
70
131)
x – y = – 5
x y
0
2
–2
4
131)
A)
x y
5 0
7 2
3–2
9 4
B)
x y
–5 0
–3 2
–7–2
–1 4
C)
x y
–5 0
–5 2
–5–2
–5 4
71
D)
x y
5 0
5 2
5–2
5 4
Plot the ordered pairs on the rectangular coordinate system provided.
132)
A(4, 6), B(–3, 1)
132)
A)
B)
72
C)
D)
Decide whether or not the ordered pair is a solution to the equation.
133)
y = – 4; (–2, 5)
133)
A)
No
B)
Yes
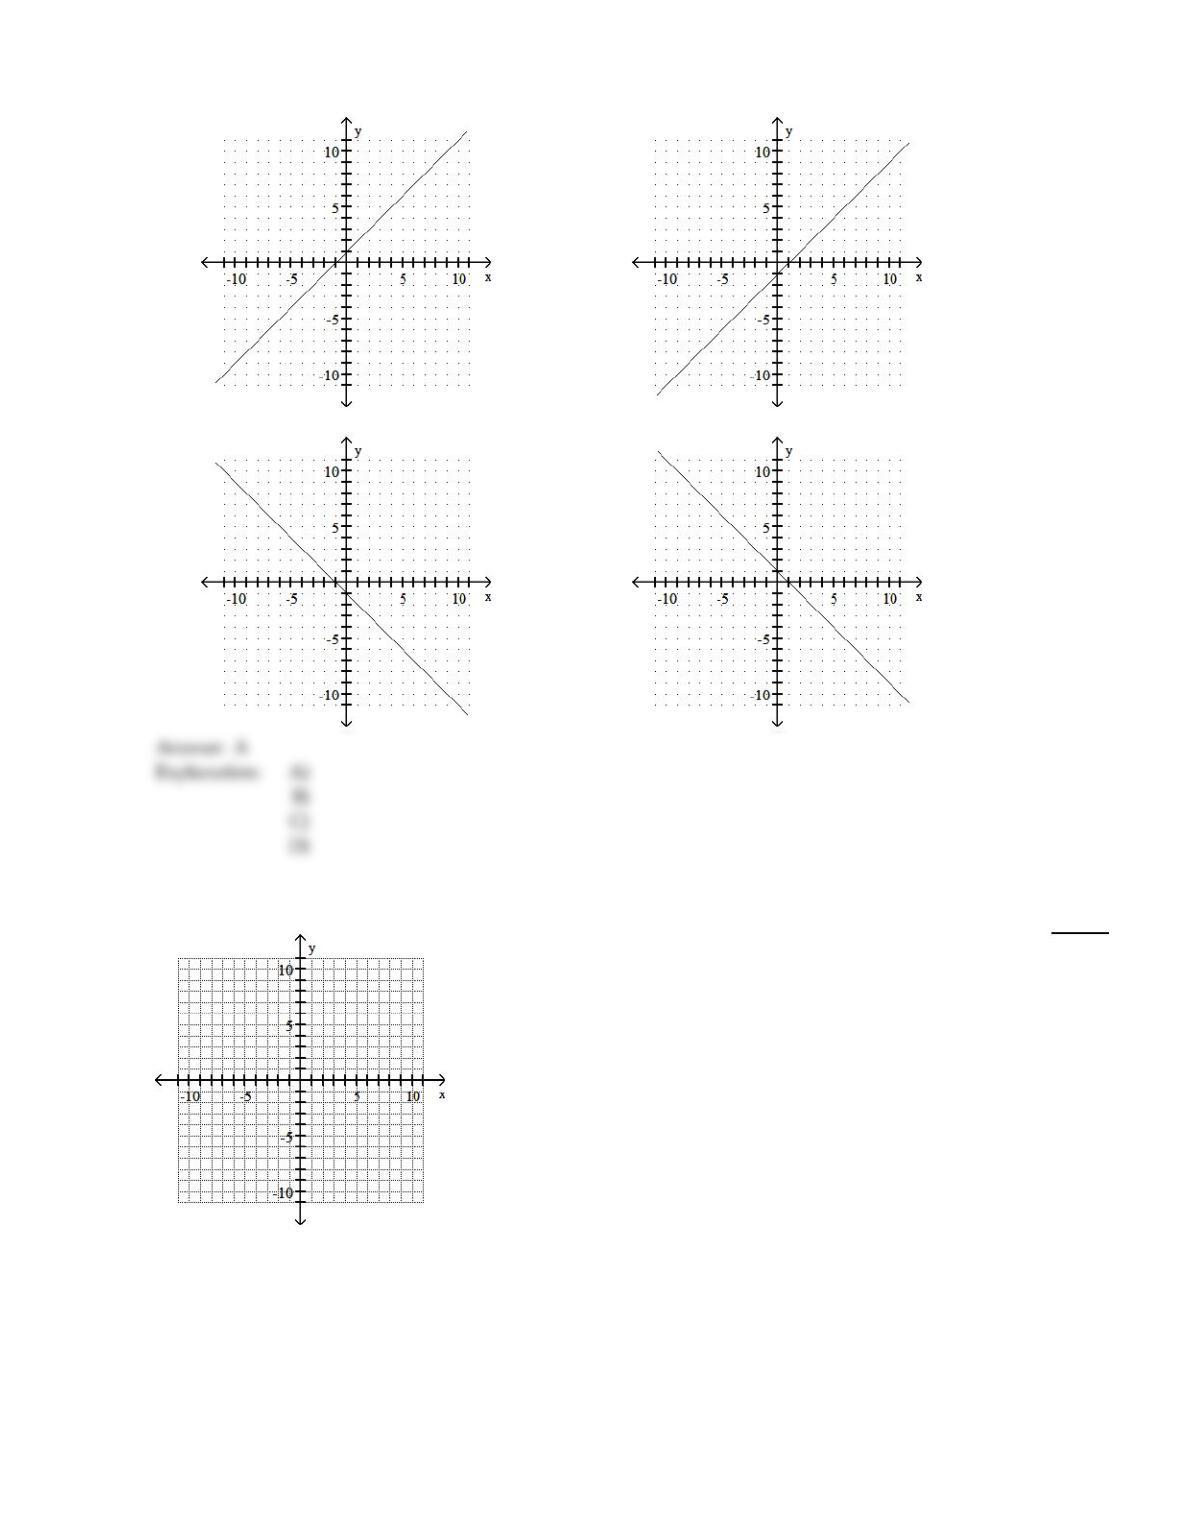
Graph the linear equation.
134)
y = x + 1
134)
73
A)
B)
C)
D)
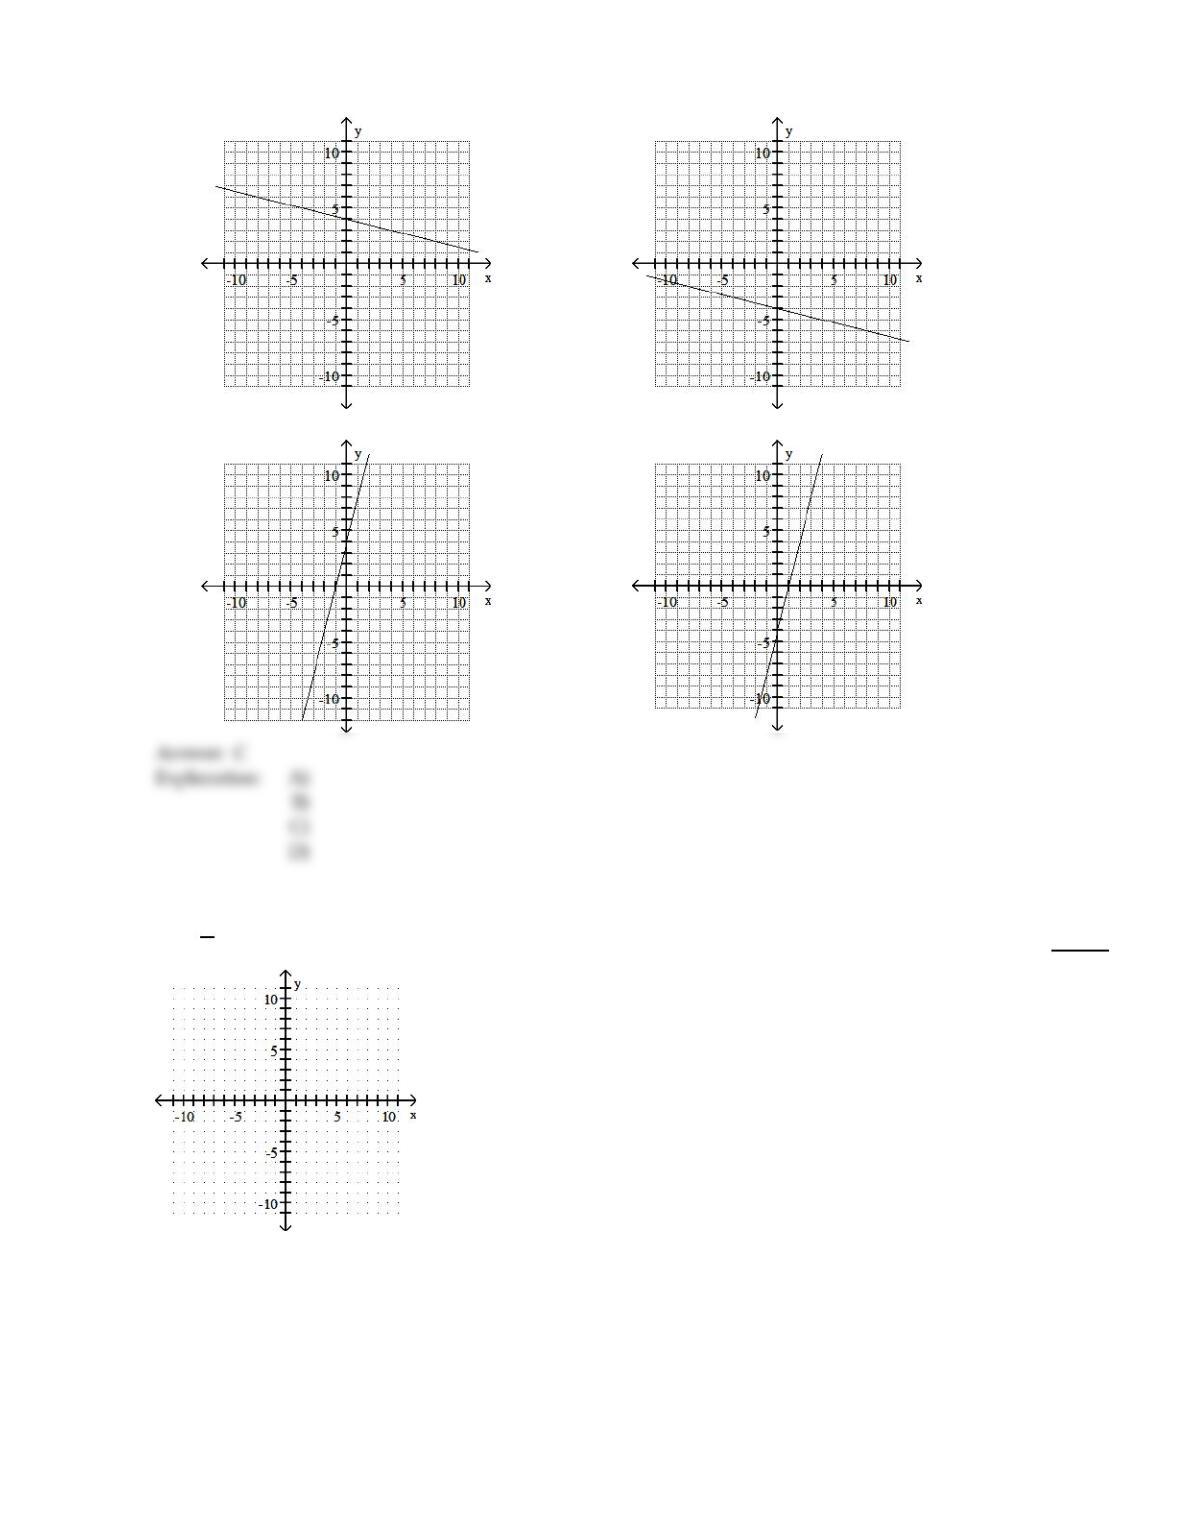
Graph the line through the given point with the given slope.
135)
(–3, –8), m =4
135)
74
A)
B)
C)
D)
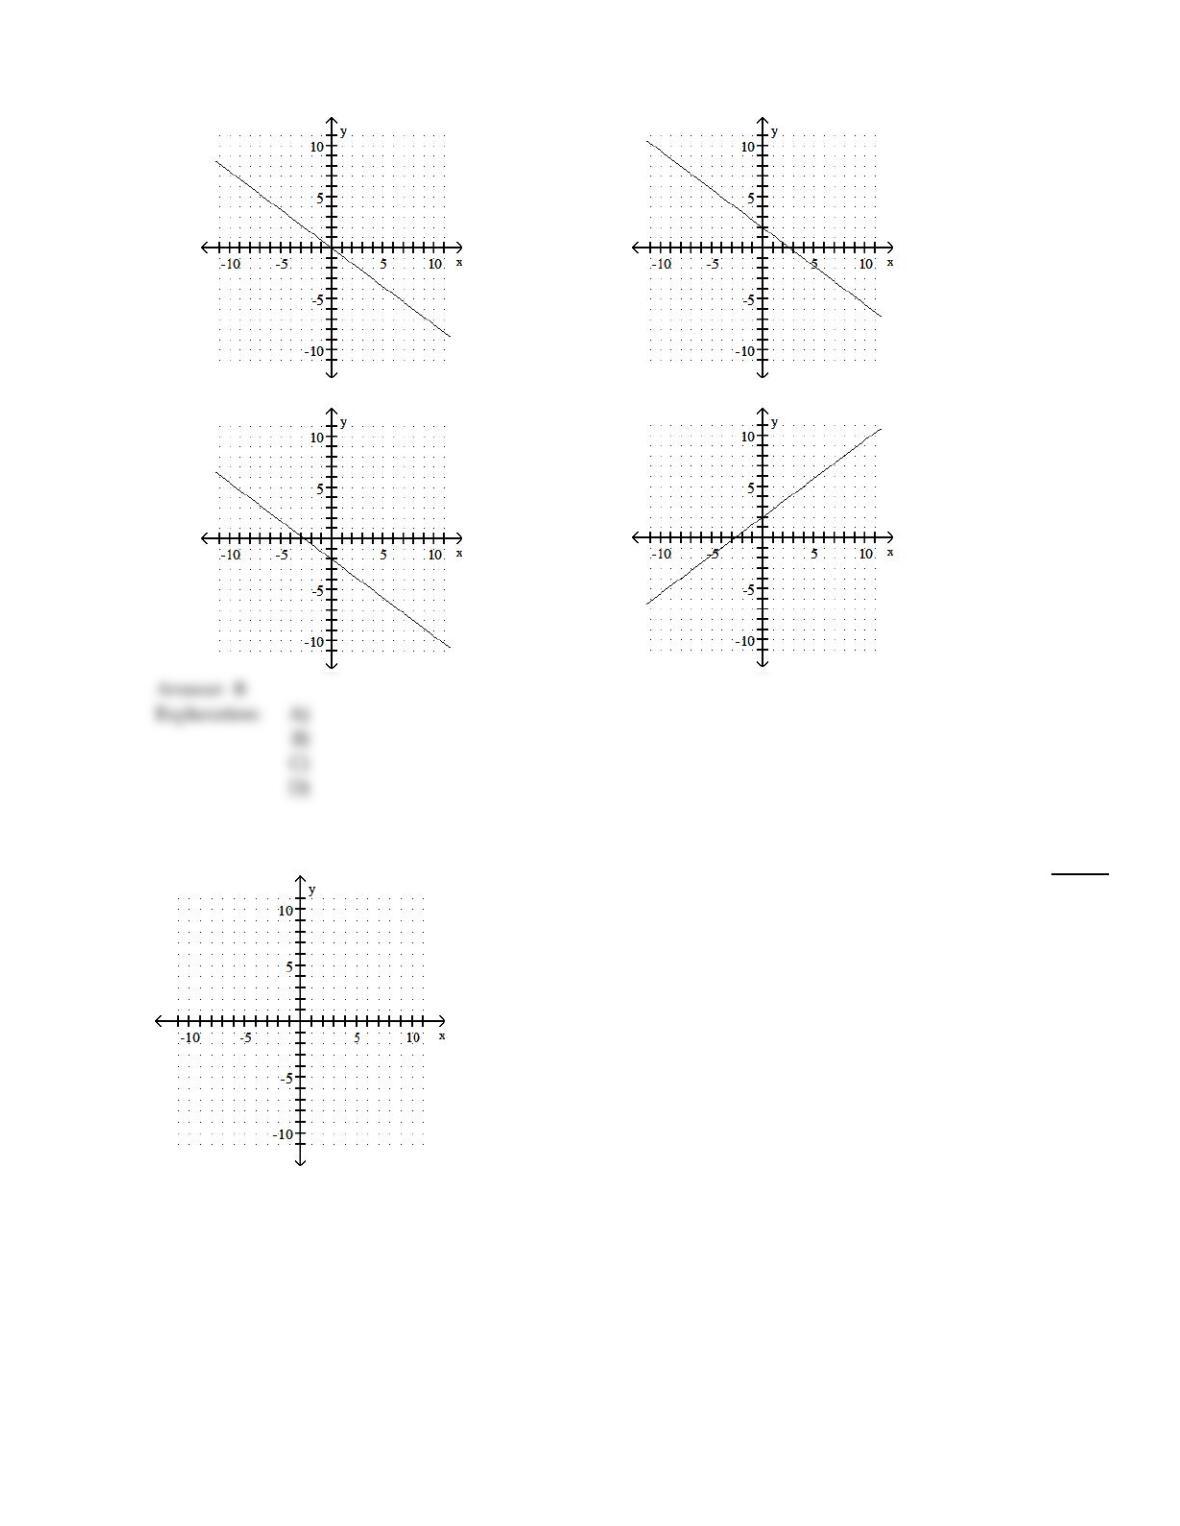
Complete the ordered pairs. Then graph the equation by plotting the points and drawing a line through them.
136)
y = – 3
4x + 2 (0, ), (4, ), (–4, )
136)
75
A)
(0, 0), (4, –3), (–4, 3)
B)
(0, 2), (4, –1), (–4, 5)
C)
(0, –2), (4, –5), (–4, 1)
D)
(0, 2), (4, 5), (–4, –1)
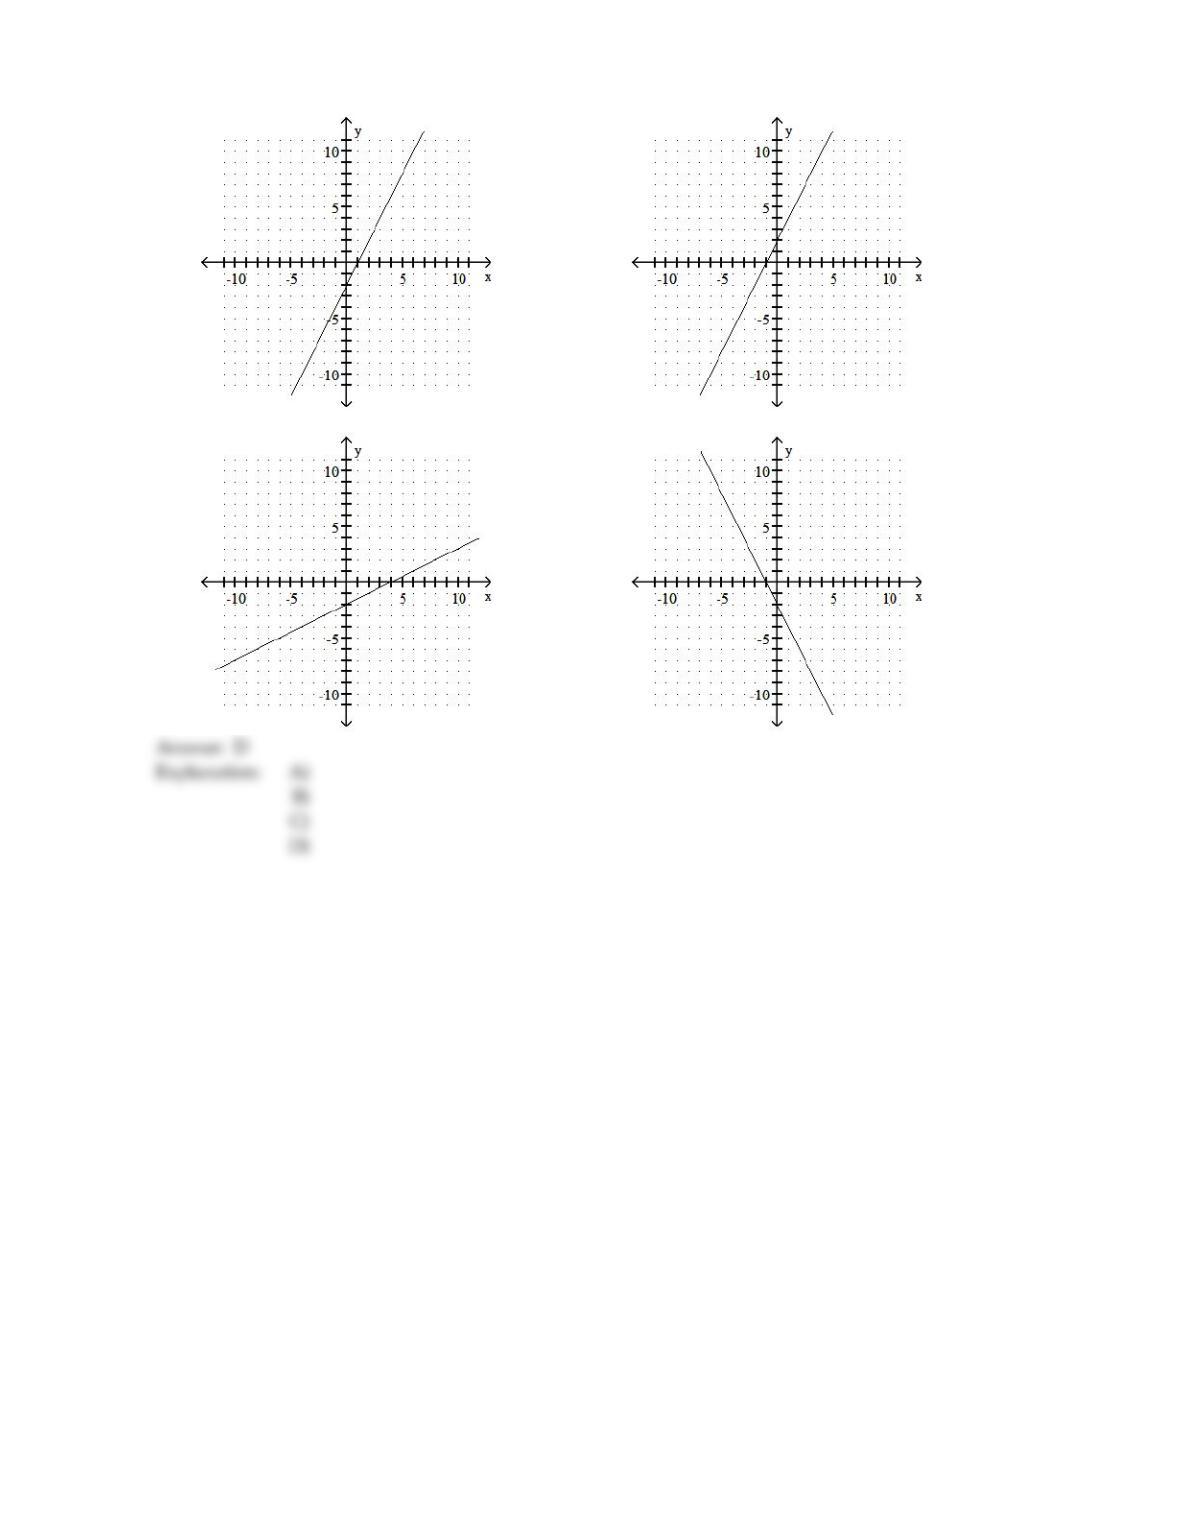
Graph the equation by using the slope and y–intercept.
137)
2x + y =2
137)
76
A)
B)
C)
D)
77
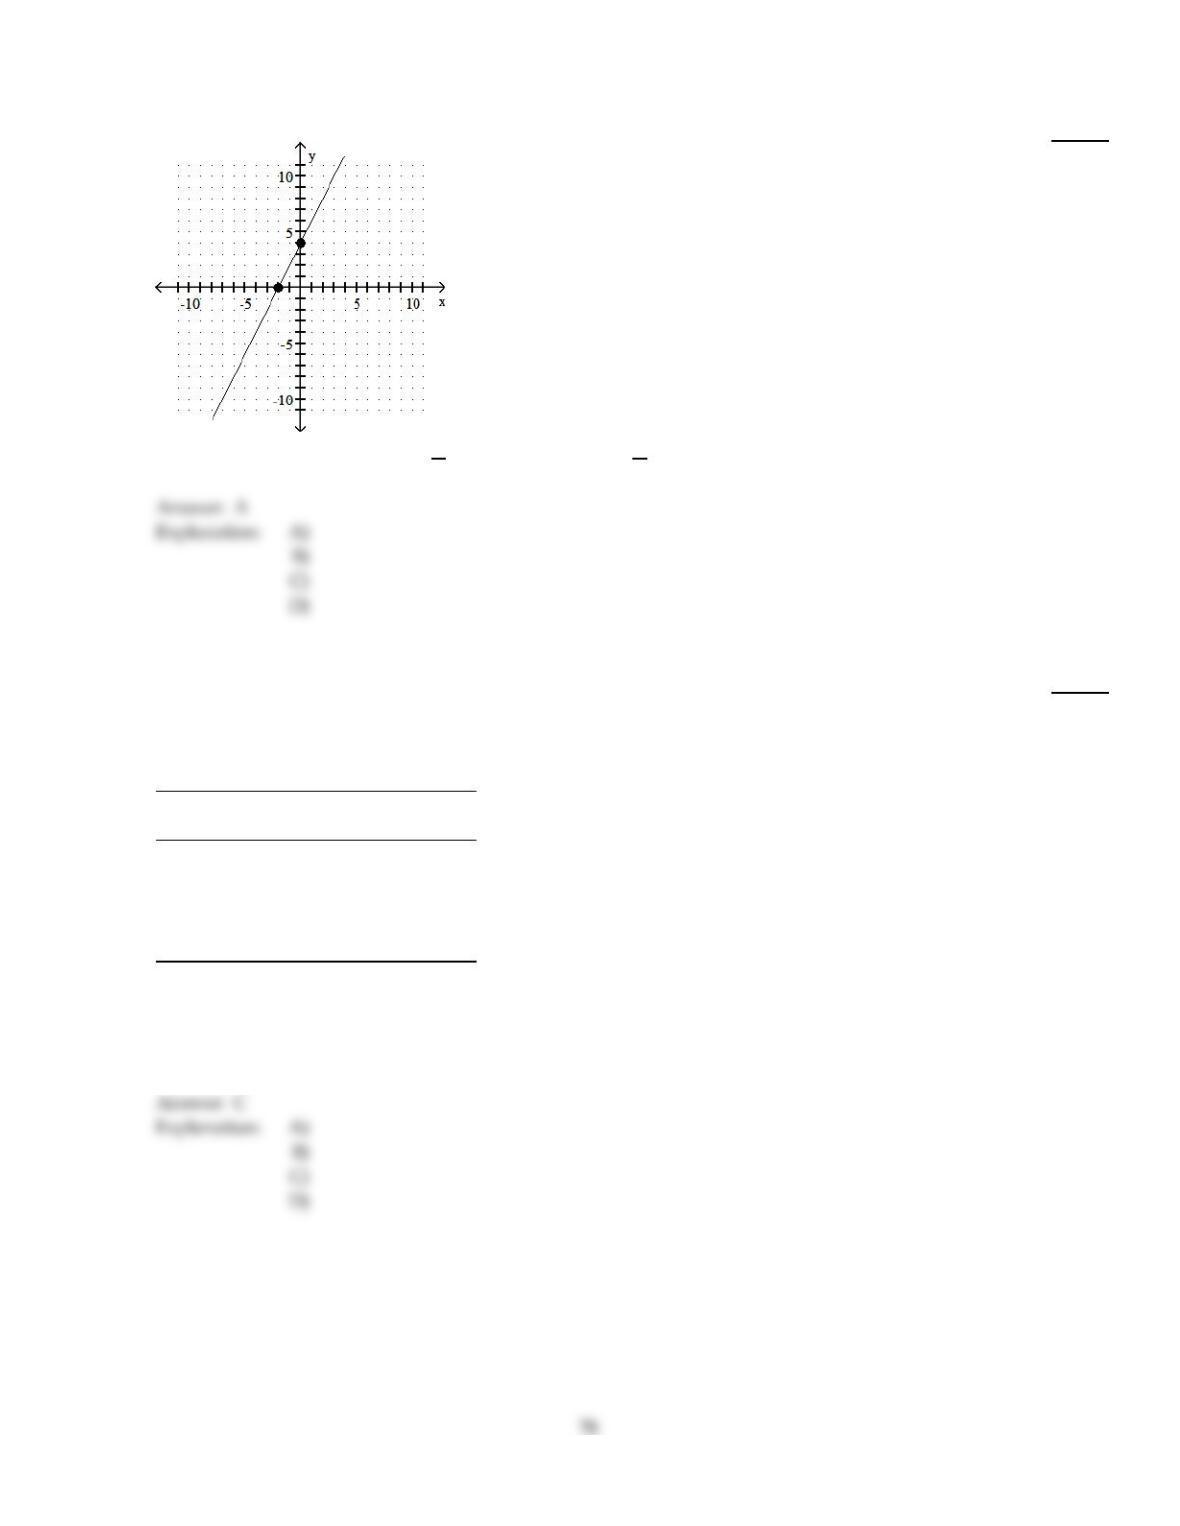
Use the coordinates of the indicated points to find the slope of the line.
138)
138)
A)
2
B)
–1
2
C)
1
2
D)
–2
Solve the problem.
139)
Suppose that during a certain step in a chemical manufacturing process the amount of chlorine
dissolved in a solution, measured in parts per million (ppm), is related to the elapsed time
measured from the beginning of the step. Use the following table as a representation of this
relationship. What does the ordered pair (9, 28.4) mean in the context of this situation?
TIME
(minutes)
AMOUNT DISSOLVED
(ppm)
324.0
626.4
928.4
12 30.4
15 32.2
139)
A)
(9, 28.4) indicates that 28.4 ppm of chlorine was dissolved after 15 minutes elapsed.
B)
(9, 28.4) indicates that 28.4 ppm of chlorine was dissolved after 9 seconds elapsed.
C)
(9, 28.4) indicates that 28.4 ppm of chlorine was dissolved after 9 minutes elapsed.
D)
(9, 28.4) indicates that 9 ppm of chlorine was dissolved after 28.4 minutes elapsed.
C
A
Complete the table of values for the given equation.
140)
4x –5y = – 20 x
y 4 0 8
140)
A)
10; –5; 5
B)
0; 5; –5
C)
0; –5; 5
D)
10; 5; –5
Decide whether or not the ordered pair is a solution to the equation.
141)
x + 4 = 0; (–4, 2)
141)
A)
No
B)
Yes
Solve the problem.
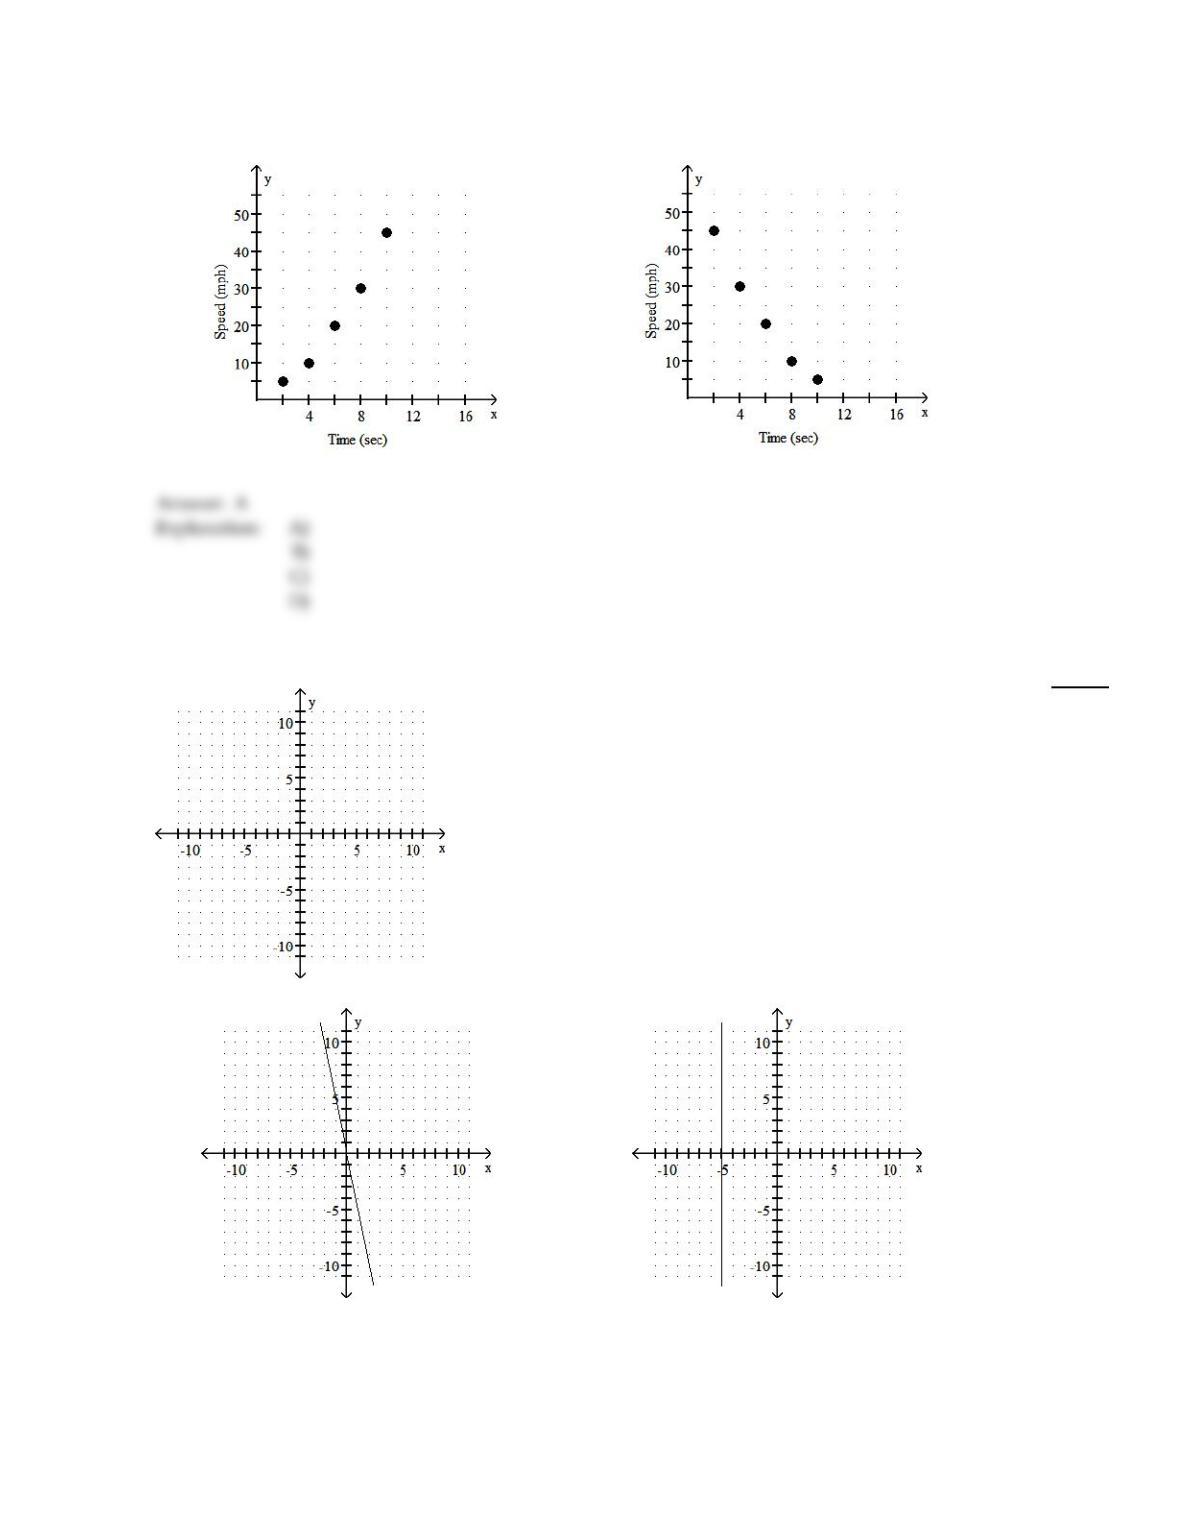
142)
Suppose that the speed of a car, measured in miles per hour (mph), is monitored for some short
period of time after the driver applies the brakes. The following table relates the speed of the car to
the amount of time, measured in seconds (sec), elapsed from the moment that the brakes are
applied. Make a scatter diagram of the data. What is happening to the speed of the car during this
time frame?
TIME
(seconds)
SPEED
(mph)
245
430
620
810
10 5
142)
A)
The speed of the car
decreased as time elapsed.
B)
The speed of the car
increased as time elapsed.
79
C)
The speed of the car
decreased as time elapsed.
D)
The speed of the car
increased as time elapsed.
Graph the linear equation.
143)
y + 5 = 0
143)
A)
B)
80