175. Figure 3-8
The following computer printout estimated overhead costs using multiple regression:
t for H(0)
Std. error
Parameter
Estimate
Parameter = 0
Pr > t
of parameter
Intercept
1000
1.96
0.0250
510.204
Setup hours
25
81.96
0.0001
0.305
# of parts
100
9.50
0.0001
10.527
R Square (R2)
0.94
Standard Error (Se)
75.00
Observations
160
During the year the company used 1,000 setup hours and 500 parts.
Refer to Figure 3-8. What is the predicted overhead cost?
176. Which of the following equations uses multiple regression?
177. Which of the following statements is TRUE about the learning curve?
178. Wonder Company is planning to introduce a new product with an 80 percent incremental unit-time
learning curve for production for batches of 1,000 units. The variable labor costs are $30 per unit for the first
1,000-unit batch. Each batch requires 100 hours. There are $10,000 in fixed costs not subject to learning. What
is the cumulative total time (labor hours) to produce 2,000 units?
179. Figure 3-9
Hereford Company is planning to introduce a new product with an 80 percent learning rate for production for
batches of 1,000 units. The variable labor costs are $30 per unit for the first 1,000-unit batch. Each batch
requires 100 hours. There are $10,000 in fixed costs not subject to learning.
Refer to Figure 3-9. What is the cumulative total time (labor hours) to produce 2,000 units based on the
cumulative average-time learning curve?
180. Figure 3-9
Hereford Company is planning to introduce a new product with an 80 percent learning rate for production for
batches of 1,000 units. The variable labor costs are $30 per unit for the first 1,000-unit batch. Each batch
requires 100 hours. There are $10,000 in fixed costs not subject to learning.
Refer to Figure 3-9. What is the batch unit time (labor hours) to produce 2,000 units based on the cumulative
average time learning curve?
181. Figure 3-9
Hereford Company is planning to introduce a new product with an 80 percent learning rate for production for
batches of 1,000 units. The variable labor costs are $30 per unit for the first 1,000-unit batch. Each batch
requires 100 hours. There are $10,000 in fixed costs not subject to learning.
Refer to Figure 3-9. What is the cumulative total time using the incremental unit-time learning curve to
produce 2,000 units?
182. Figure 3-9
Hereford Company is planning to introduce a new product with an 80 percent learning rate for production for
batches of 1,000 units. The variable labor costs are $30 per unit for the first 1,000-unit batch. Each batch
requires 100 hours. There are $10,000 in fixed costs not subject to learning.
Refer to Figure 3-9. What is the cumulative average time per batch using the incremental unit-time learning
curve for 2,000 units?
183. The learning curve that decreases by a constant percentage each time the cumulative quantity doubles is
known as the
184. Apparent Corp. has developed the following information on product costs and inventories for a three-
month period:
April
May
June
Finished goods inventory, units:
Beginning
20
25
30
Manufactured
25
40
35
Available
45
65
65
Sold
25
40
50
Ending
20
25
15
Manufacturing costs $4,000 $6,000 $5,500
Based on managerial judgment, the best predictor of manufacturing costs is
185. If a motorcycle manufacturer changes from skilled labor to computer-controlled assembly procedures, the
past data
186. Tornado Enterprises has the following information available regarding costs at various levels of monthly
production:
Production volume
7,000
10,000
Direct materials
$ 70,000
$100,000
Direct labor
56,000
80,000
Indirect materials
21,000
30,000
Supervisors’ salaries
12,000
12,000
Depreciation on plant and equipment
10,000
10,000
Maintenance
32,000
44,000
Utilities
15,000
21,000
Insurance on plant and equipment
1,600
1,600
Property taxes on plant and equipment
2,000
2,000
Total
$219,600
$300,600
Required:
a.
Identify each cost as being variable, fixed, or mixed by writing the name of each cost under one of the following headings:
Variable Costs Fixed Costs Mixed Costs
b.
Develop an equation for total monthly production costs.
c.
Predict total costs for a monthly production volume of 8,000 units.
a.
Variable Costs
Fixed Costs
Mixed Costs
Direct materials
Supervisors’ salaries
Maintenance
Direct labor
Depreciation
Utilities
Indirect materials
Insurance
Property taxes
b.
Variable costs = ($300,600 – $219,600)/(10,000 – 7,000) = $27.00
Fixed costs = $300,600 – ($27.00 ´ 10,000) = $30,600 per month
Total monthly production costs = $30,600 + $27.00(monthly production units)
Total costs = $30,600 + ($27.00 ´ 8,000) = $246,600
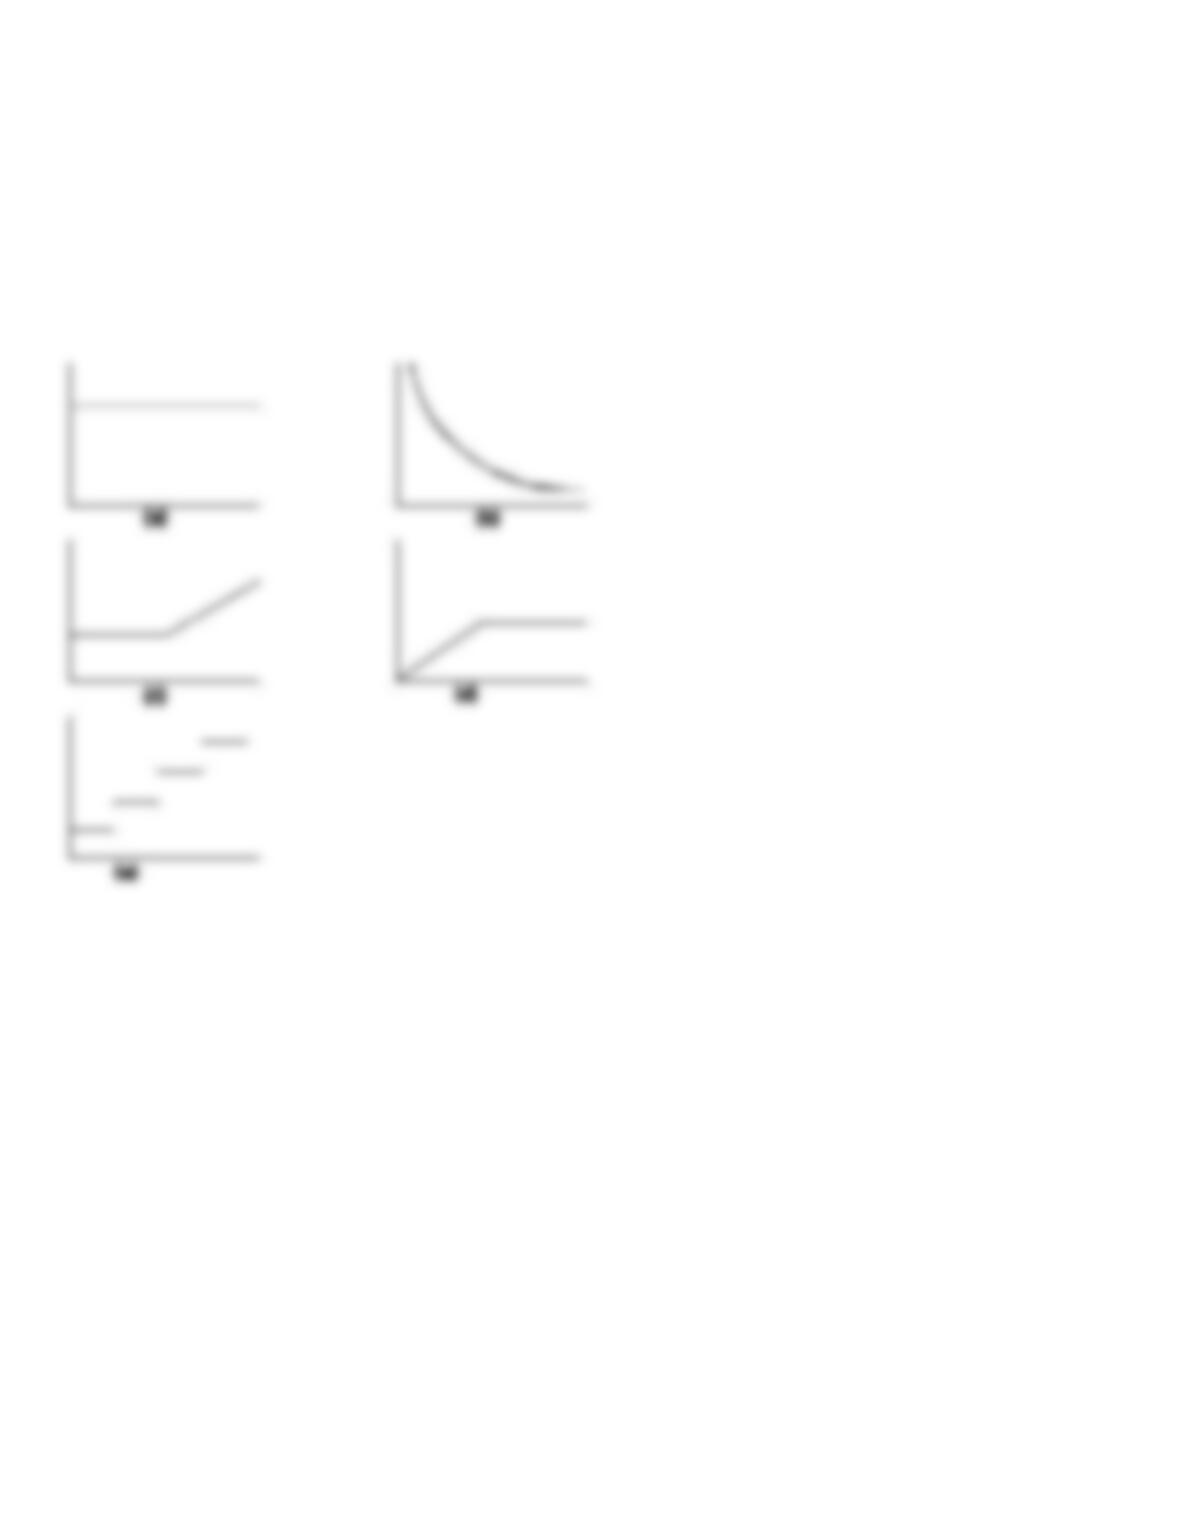
187. For each of the following situations, draw a graph that best describes the cost behavior pattern. The vertical
axis represents costs, and the horizontal axis represents volume.
a.
Direct materials per unit
b.
Depreciation expense on a building per unit
c.
An employee paid $50 per hour with a guaranteed salary of $1,000 per week
d.
A consultant paid $100 per hour with a maximum fee of $2,000
e.
Salaries of teachers where each teacher can handle a maximum of 15 students
188. The Hamilton Mills Company cost accountant wants to determine the cost behavior for overhead. Based on
observation and discussion with the plant workers, the following accounts have been identified as the most
relevant: Supervisor salaries and depreciation are believed to be generally be fixed; Indirect labor, Utilities, and
Purchasing are generally believed to be variable; Indirect labor primarily is responsible for moving materials;
Utility cost is primarily caused by the electricity to run machinery; and Purchasing costs are driven by the
number of purchase orders. These accounts and their balances are given below:
Indirect Labor
Utilities
Purchasing
Supervisory
Salaries
Depreciation on Plant
and Equipment
January
$ 28,500
$ 24,000
$ 76,400
$ 40,000
$ 13,000
February
31,600
21,200
70,800
46,000
13,000
March
33,600
25,000
75,200
64,000
13,000
April
41,400
25,000
80,400
55,600
13,000
May
40,000
25,000
79,800
50,800
13,000
June
34,000
25,000
79,400
34,000
13,000
Total
$209,100
$145,200
$ 462,000
$ 290,400
$ 78,000
Information on the activities is given below:
# of moves
machine hours
purchase orders
January
340
5,400
250
February
380
5,200
300
March
400
5,800
450
April
500
6,200
380
May
480
6,000
340
June
420
5,600
200
Total
2,520
34,200
1,920
Required:
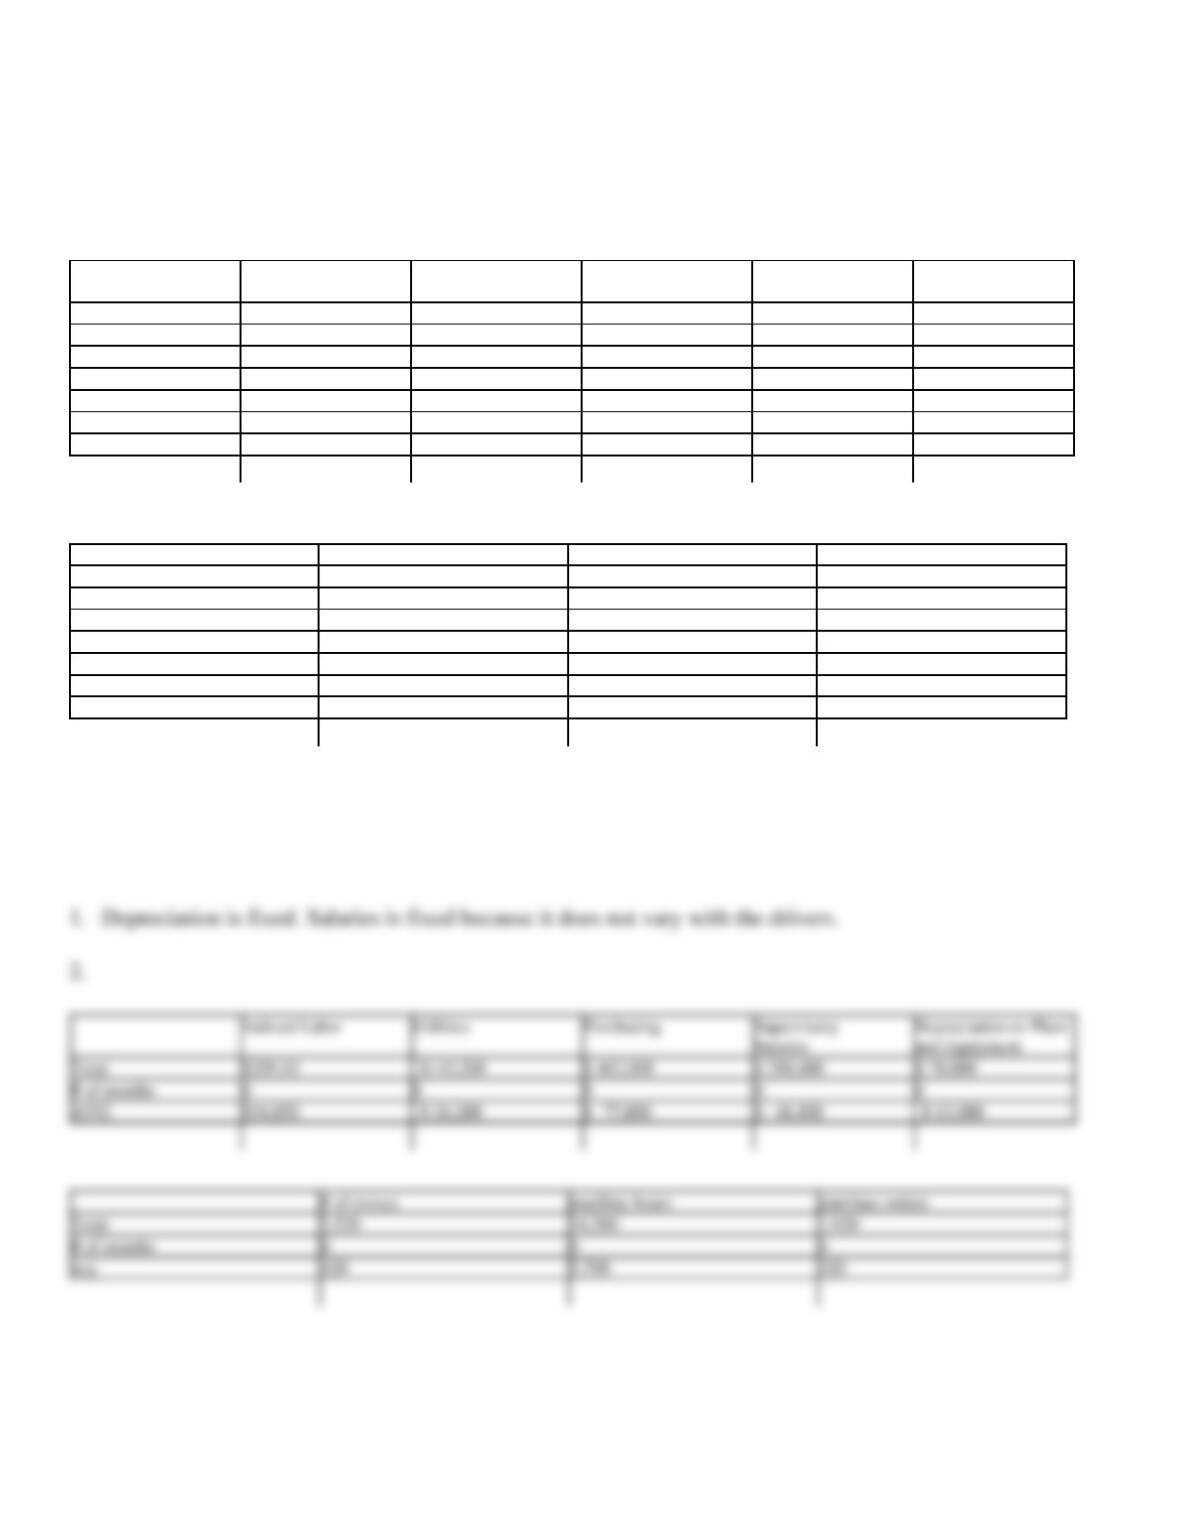
1. Why did the cost accountant decide that salaries and depreciation were fixed?
2. Calculate the average account balance for each of the 5 accounts and calculate the average monthly amount for each of the three drivers.
3. Calculate the fixed overhead and variable rates for each of the costs. Write an equation for the total overhead cost.
4. In January, 490 moves; 4,375 machine hours, and 220 purchase orders were expected. What is the amount of overhead predicted?
Indirect Labor
Utilities
Purchasing
Supervisory
Depreciation on Plant
Total
$209,10
$145,200
$ 462,000
$ 290,400
$ 78,000
# of months
6
6
6
6
6
AVG
$34,850
$ 24,200
$ 77,000
$ 48,400
$ 13,000
# of moves
machine hours
purchase orders
Total
2,520
34,200
1,920
# of months
6
6
6
avg
5,700
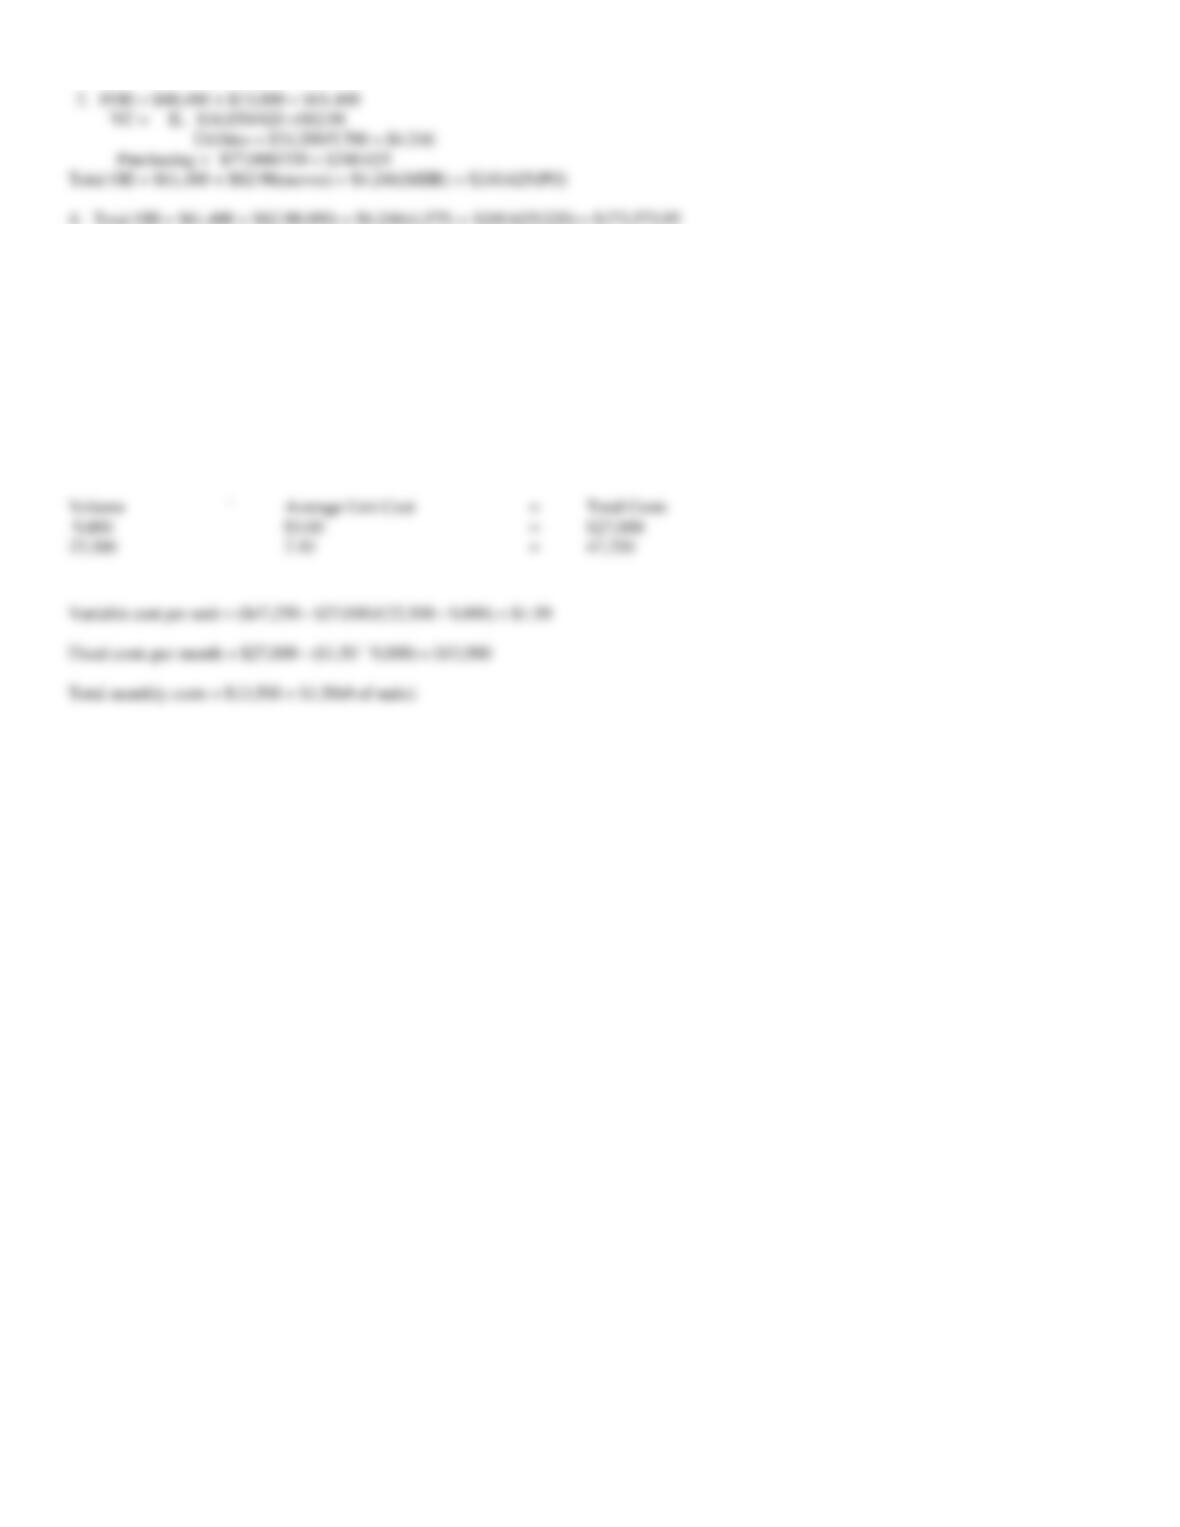
189. The average unit cost at a monthly volume of 9,000 units is $3, and the average unit cost at a monthly
volume of 22,500 units is $2.10.
Required:
Develop an equation for total monthly costs.
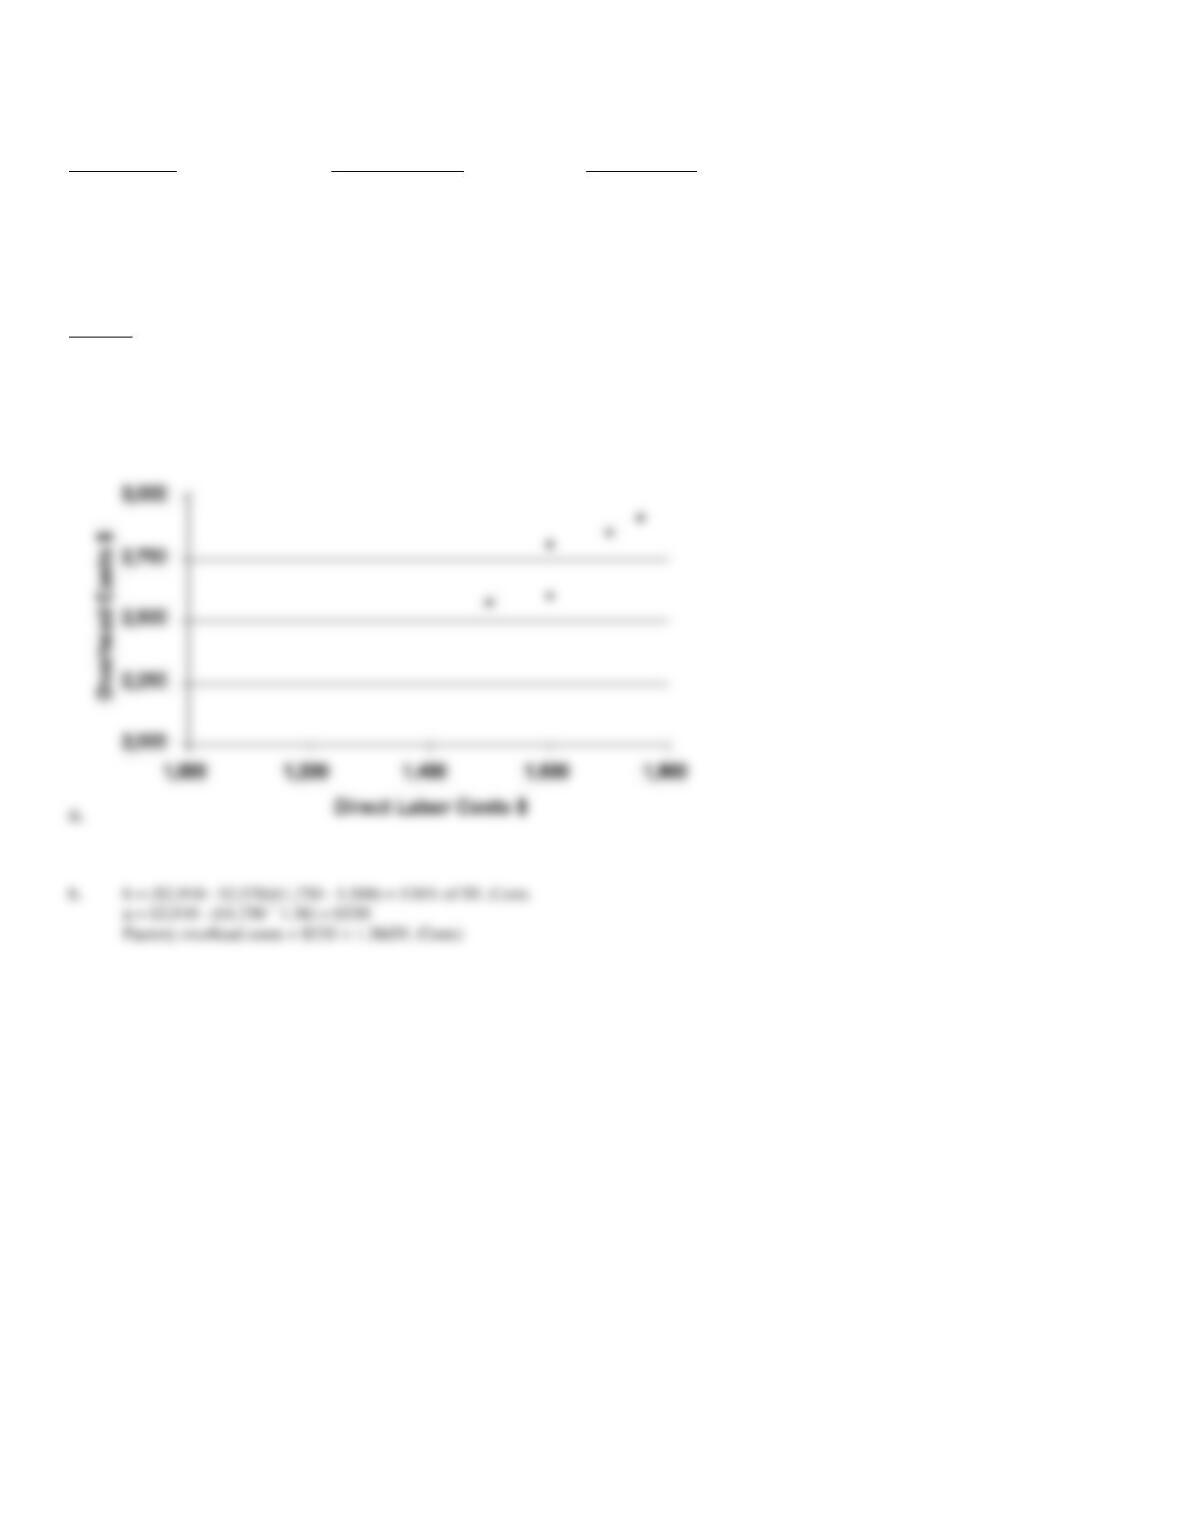
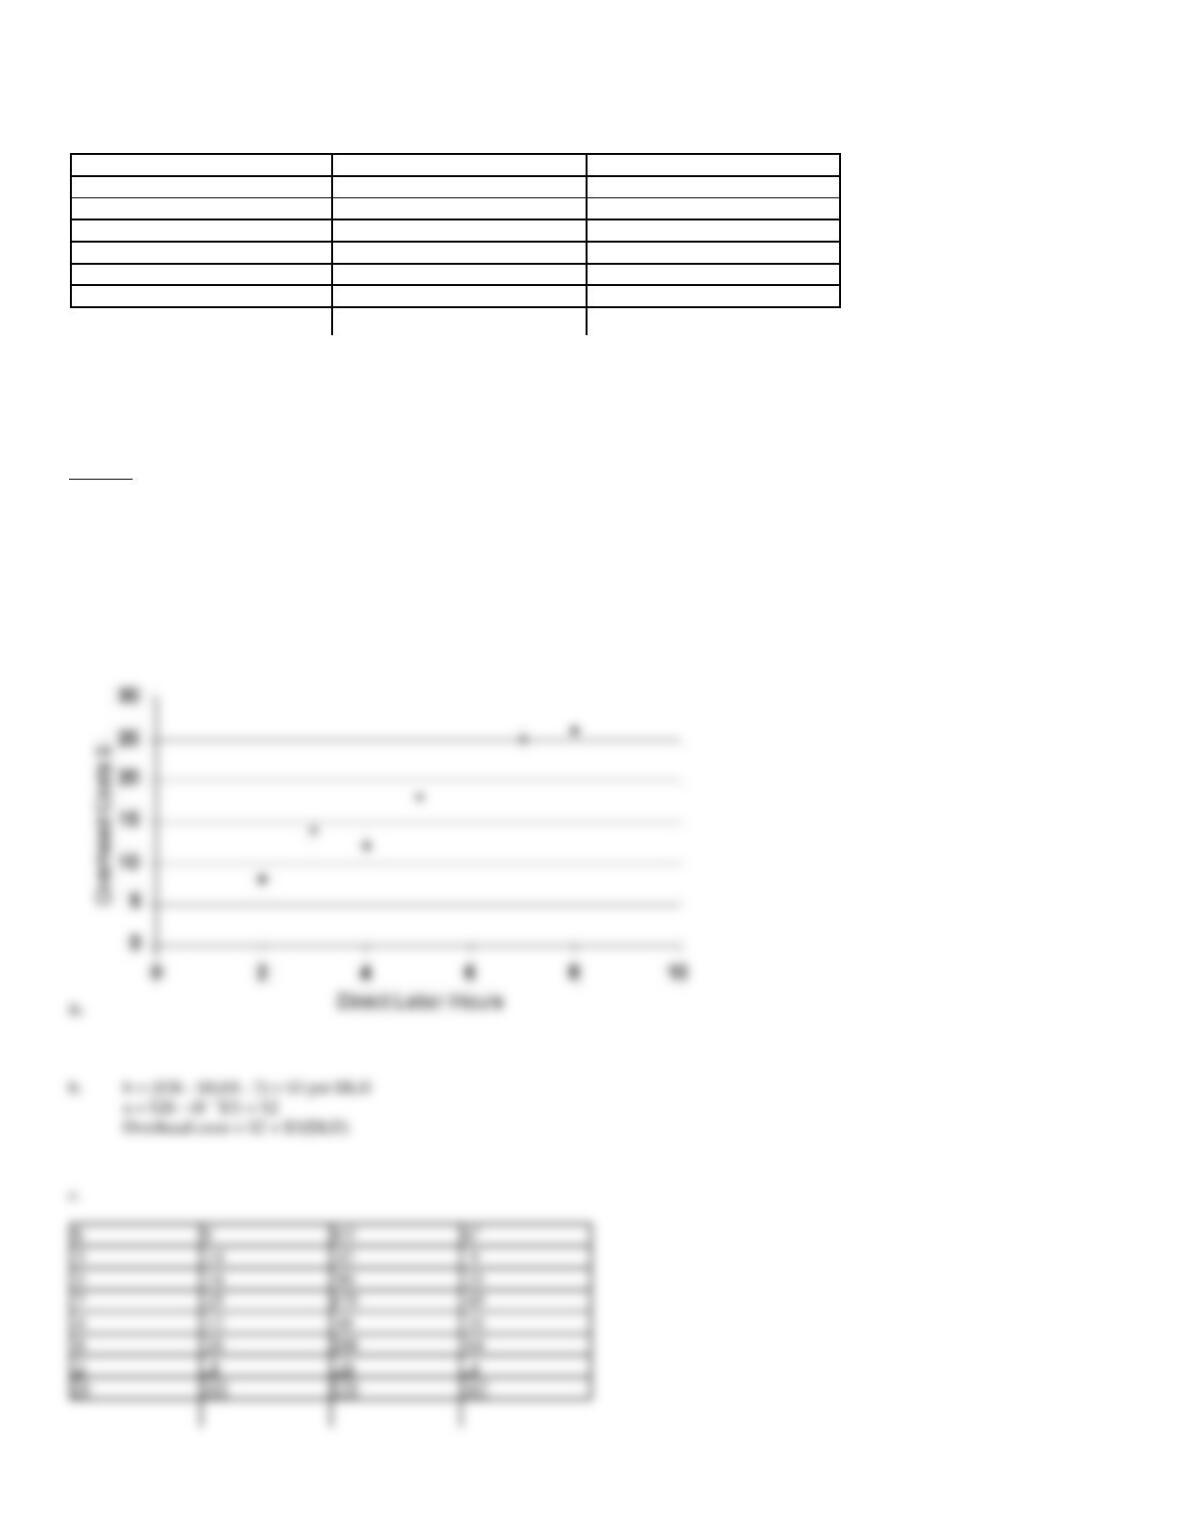
190. Lowell & Company has the following cost data pertaining to the production of small desks:
Units Produced
Direct Labor Costs
Overhead Costs
150
$1,600
$2,800
120
1,500
2,570
210
1,750
2,910
190
1,700
2,850
140
1,600
2,600
Required:
a.
Plot the preceding direct labor costs and overhead costs using the scatterplot method. Overhead costs should be on the vertical axis.
b.
Compute the fixed and variable components of the overhead costs using the high-low method.
b.
b = ($2,910 – $2,570)/(1,750 – 1,500) = 136% of DL Costs
a = $2,910 – ($1,750 ´ 1.36) = $530
Factory overhead costs = $530 + 1.36(DL Costs)
191. The following data were obtained from the books of Thomas Company:
Month
Overhead Costs
Direct Labor Hours
1
$14
3
2
18
5
3
25
7
4
12
4
5
26
8
6
8
2
The normal equations are
SXY = aSX + bSX2
SY = an + bSX
Required:
Use a computer or calculator to prepare the following:
a.
Plot the data for overhead cost as a function of direct labor hours using the scatterplot method.
b.
Compute the fixed and variable components of the overhead costs using the high-low method.
c.
Compute the fixed and variable components of the overhead costs using the least-squares method.
d.
Discuss the strengths and weaknesses of the three different cost estimation techniques used in parts a, b, and c.
b.
b = ($26 – $8)/(8 – 2) = $3 per DLH
a = $26 – (8 ´ $3) = $2
Overhead costs = $2 + $3(DLH)
X
Y
3
9
5
7
175
4
192. Machine hours and electricity costs for Lindbergh Industries for the year 2014 are as follows:
Month
Machine Hours
Electricity Costs
January
2,000
$ 9,200
February
2,320
10,500
March
1,520
6,750
April
2,480
11,500
May
3,040
14,125
June
2,640
11,000
July
3,280
12,375
August
2,800
11,375
September
1,600
7,750
October
2,960
13,000
November
3,760
15,500
December
3,360
13,875
Required:
a.
Using the high-low method, develop an estimate of variable electricity costs per machine hour.
b.
Using the high-low method, develop an estimate of fixed electricity costs per month.
c.
Using the high-low method, develop a cost function for monthly electricity costs.
d.
Estimate electricity costs for a month in which 3,000 machine hours are worked.
a.
$3.91 [($15,500 – $6,750)/(3,760 – 1,520)]
b.
$798.40 [$15,500 – ($3.91 ´ 3,760)]
c.
Y = $798.40 + $3.91X, or
Electricity costs = $798.40 + ($3.91 ´ Machine hours)
d.
$12,528.40 [$798.40 + ($3.91 ´ 3,000)]
193. Given the following information:
Month
HR Dept Costs
# new hires
# terminations
January
$785,000
444
137
February
$569,000
276
250
March
$603,000
219
138
April
$445,000
343
99
May
$463,000
355
75
June
$489,000
298
83
July
$400,000
196
47
August
$423,000
258
92
September
$469,000
307
101
October
$538,000
389
175
November
$667,000
402
23
December
$403,000
361
10
Required:
a.
Calculate an estimate of HR department costs using the hi-low method using # of new hires as the variable parameter
b.
Calculate an estimate of HR department costs using the hi-low method using # termination as the variable parameter
c.
Which parameter do you feel is a better driver of HR cost?
194. The plant manager requested information to assist in estimating maintenance costs. The following
computer printout was generated using the least-squares method:
Intercept
2550
Slope
1.85
Correlation coefficient
0.84
Activity variable
Units of production volume
Required:
a.
Using the information from the computer printout, develop a cost function that can be used to estimate maintenance costs at different
volume levels.
b.
Estimate maintenance costs if expected production for next month is 10,000 units.
a. Variable using New Hires = ($785,000 – 400,000) / (444 -196) =
$1,552.42
b. Variable using Terminations = ($569,000 – 403,000) / (250 – 10) =
a. Fixed using new hires = $569,000 – (250 ´ $691.67) =
$396,082.50
b. Fixed using terminations = $785,000 – (137 ´ $4,277.78) =
$198,944.14
195. The following excel printout provides information to estimate overhead costs using linear regression:
Coefficients
Standard Error
t Stat
P-value
Lower 95%
Upper 95%
Intercept
6035.987027
1411.05464
4.277642
0.002696
2782.0871
9289.88697
DLH
4.558482698
1.609683731
2.831912
0.022085
0.846543
8.27042244
# setups
771.1028938
54.93418317
14.03685
6.44E-07
644.42436
897.781429
# moves
29.9411124
2.874675342
10.41548
6.26E-06
23.312095
36.5701299
Regression Statistics
Multiple R
0.996584412
R Square
0.99318049
Adjusted R Square
0.990623174
Standard Error
347.9563597
Observations
12
Required:
a.
Write the multiple regression model (round to nearest cent).
b.
What does the ‘t Stat’ measure?
c.
What is the estimate of overhead if the department has 1,205 DLH, 55 setups and 125 moves?
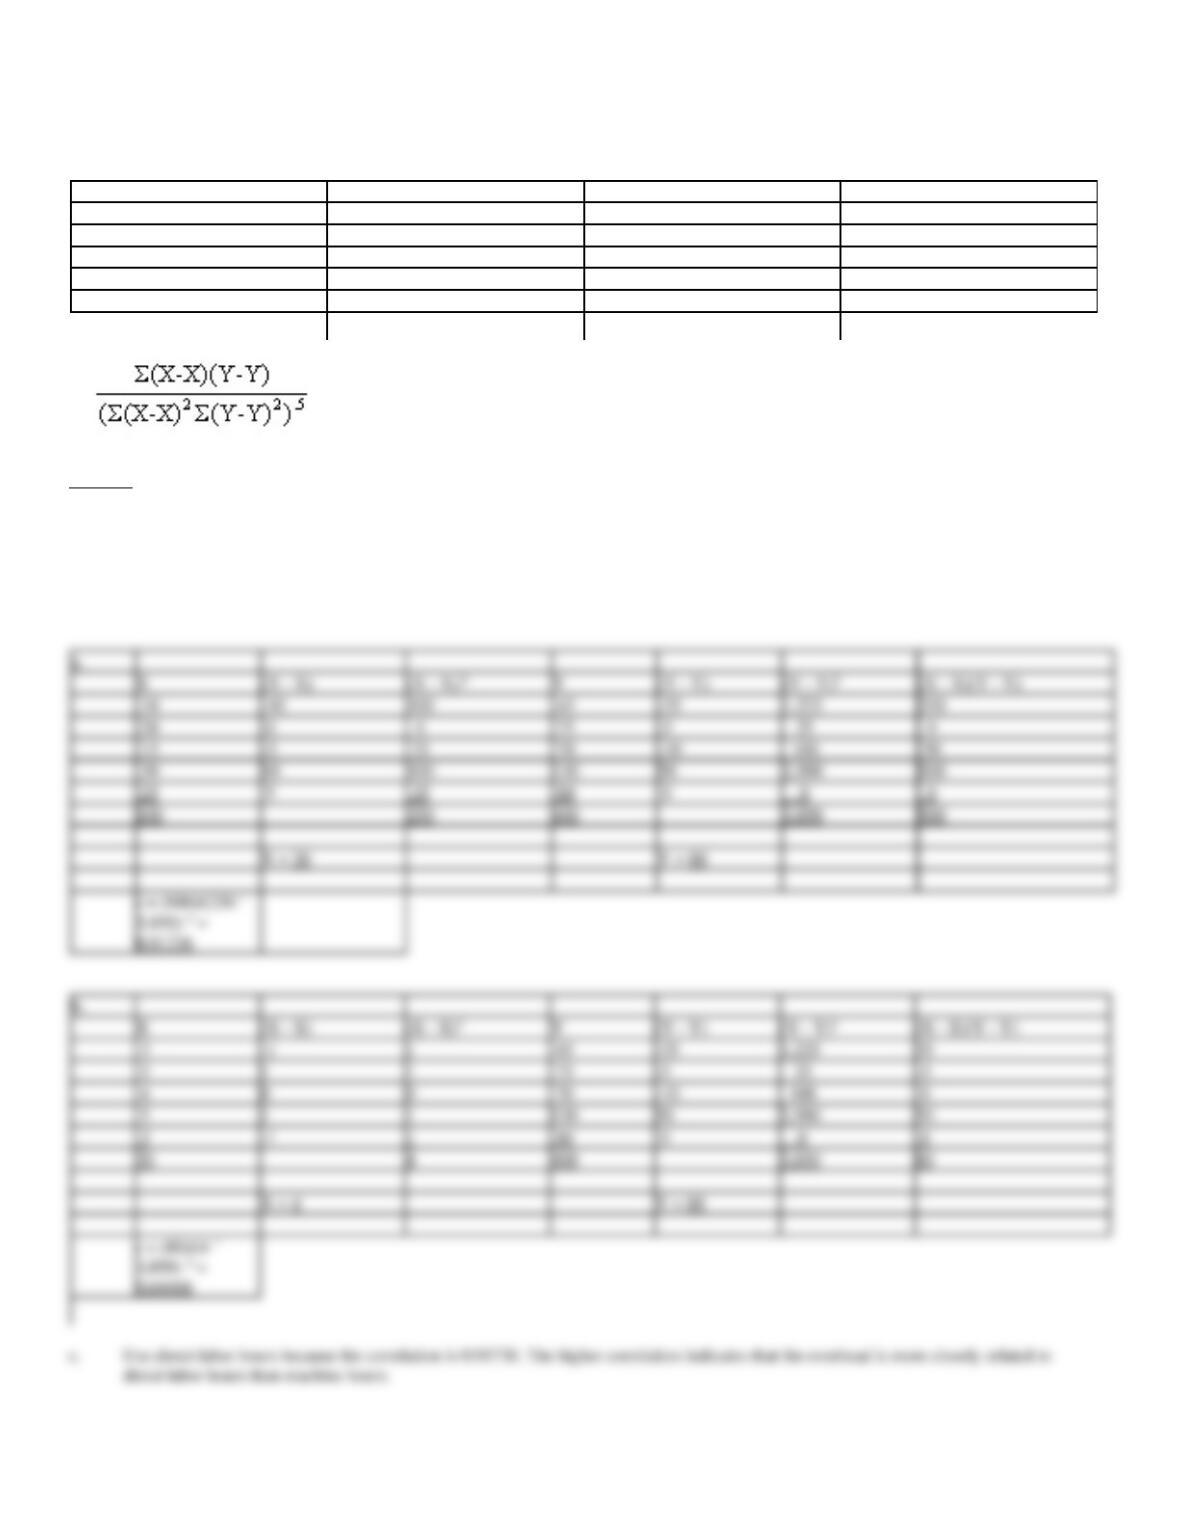
196. The Johnson Company is trying to find an appropriate allocation base for factory overhead. Presented are
five months of data:
Month
Direct Labor Hours
Machine Hours
Factory Overhead
June
10
3
$45
July
20
5
75
August
15
4
70
September
30
5
130
October
25
3
80
r =
Required:
a.
Calculate the correlation coefficient between factory overhead and direct labor hours.
b.
Calculate the correlation coefficient between factory overhead and machine hours.
c.
Should Johnson Company use direct labor hours or machine hours for their allocation base for factory overhead? Why?
a.
X
(X – X)
Y
(Y – Y)
(X – X)(Y – Y)
10
100
45
1,225
350
20
0
0
75
-5
0
15
-5
25
70
100
50
30
10
100
130
50
2,500
500
25
5
25
80
0
0
100
250
400
3,850
900
X = 20
Y = 80
b.
X
(X – X)
Y
(Y – Y)
(X – X)(Y – Y)
3
-1
1
45
1,225
35
5
1
1
75
-5
-5
4
0
0
70
100
0
5
1
1
130
50
2,500
50
3
-1
1
80
0
0
20
4
400
3,850
80
X = 4
Y = 80
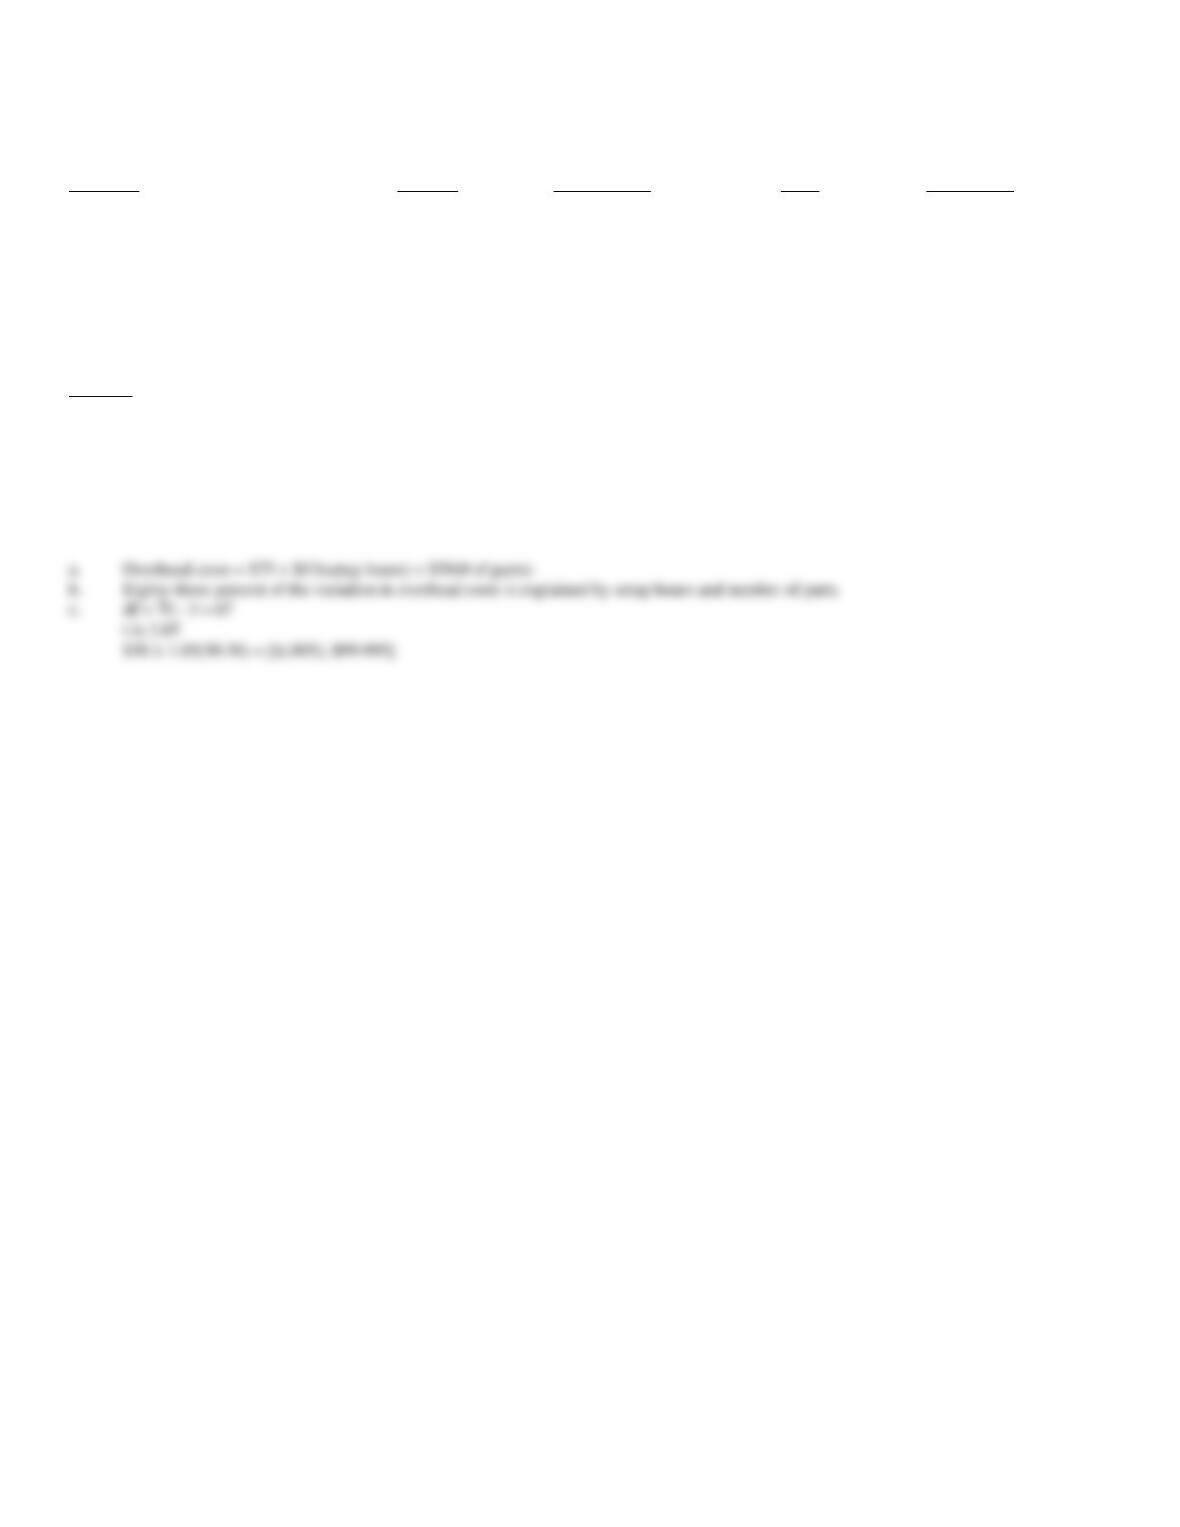
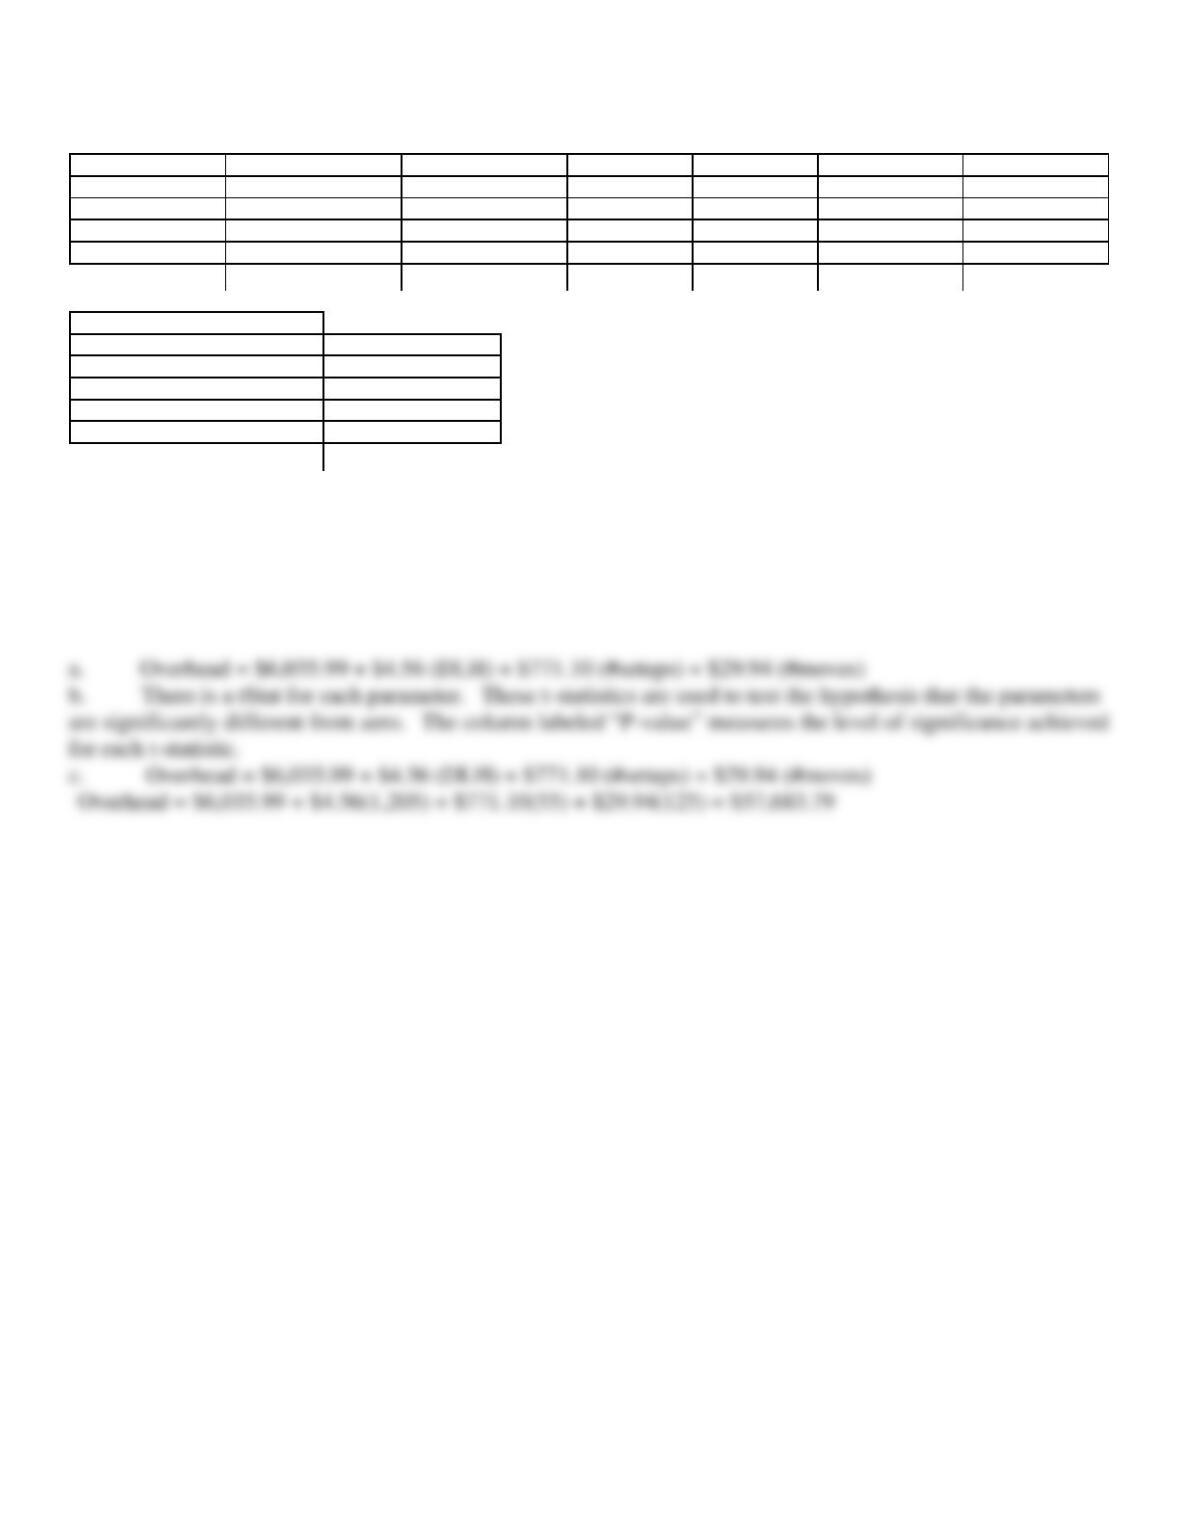
197. The following computer printout estimated overhead costs using linear regression:
t for H(0)
Std. error
Parameter
Estimate
Parameter = 0
Pr > t
of parameter
Intercept
75
2.25
0.0250
33.33
Setup hours
13
5.10
0.0001
2.45
# of parts
50
1.65
0.0500
30.30
R Square (R2)
0.83
Standard Error (Se)
50.00
Observations
70
Required:
a.
Write the multiple regression model.
b.
What does R Square mean?
c.
Provide a 95 percent confidence interval around the number of parts parameter.
a.
Overhead costs = $75 + $13(setup hours) + $50(# of parts)
b.
Eighty-three percent of the variation in overhead costs is explained by setup hours and number of parts.
c.
df = 70 – 3 = 67
t is 1.65
$50 1.65(30.30) = [$(.005), $99.995]
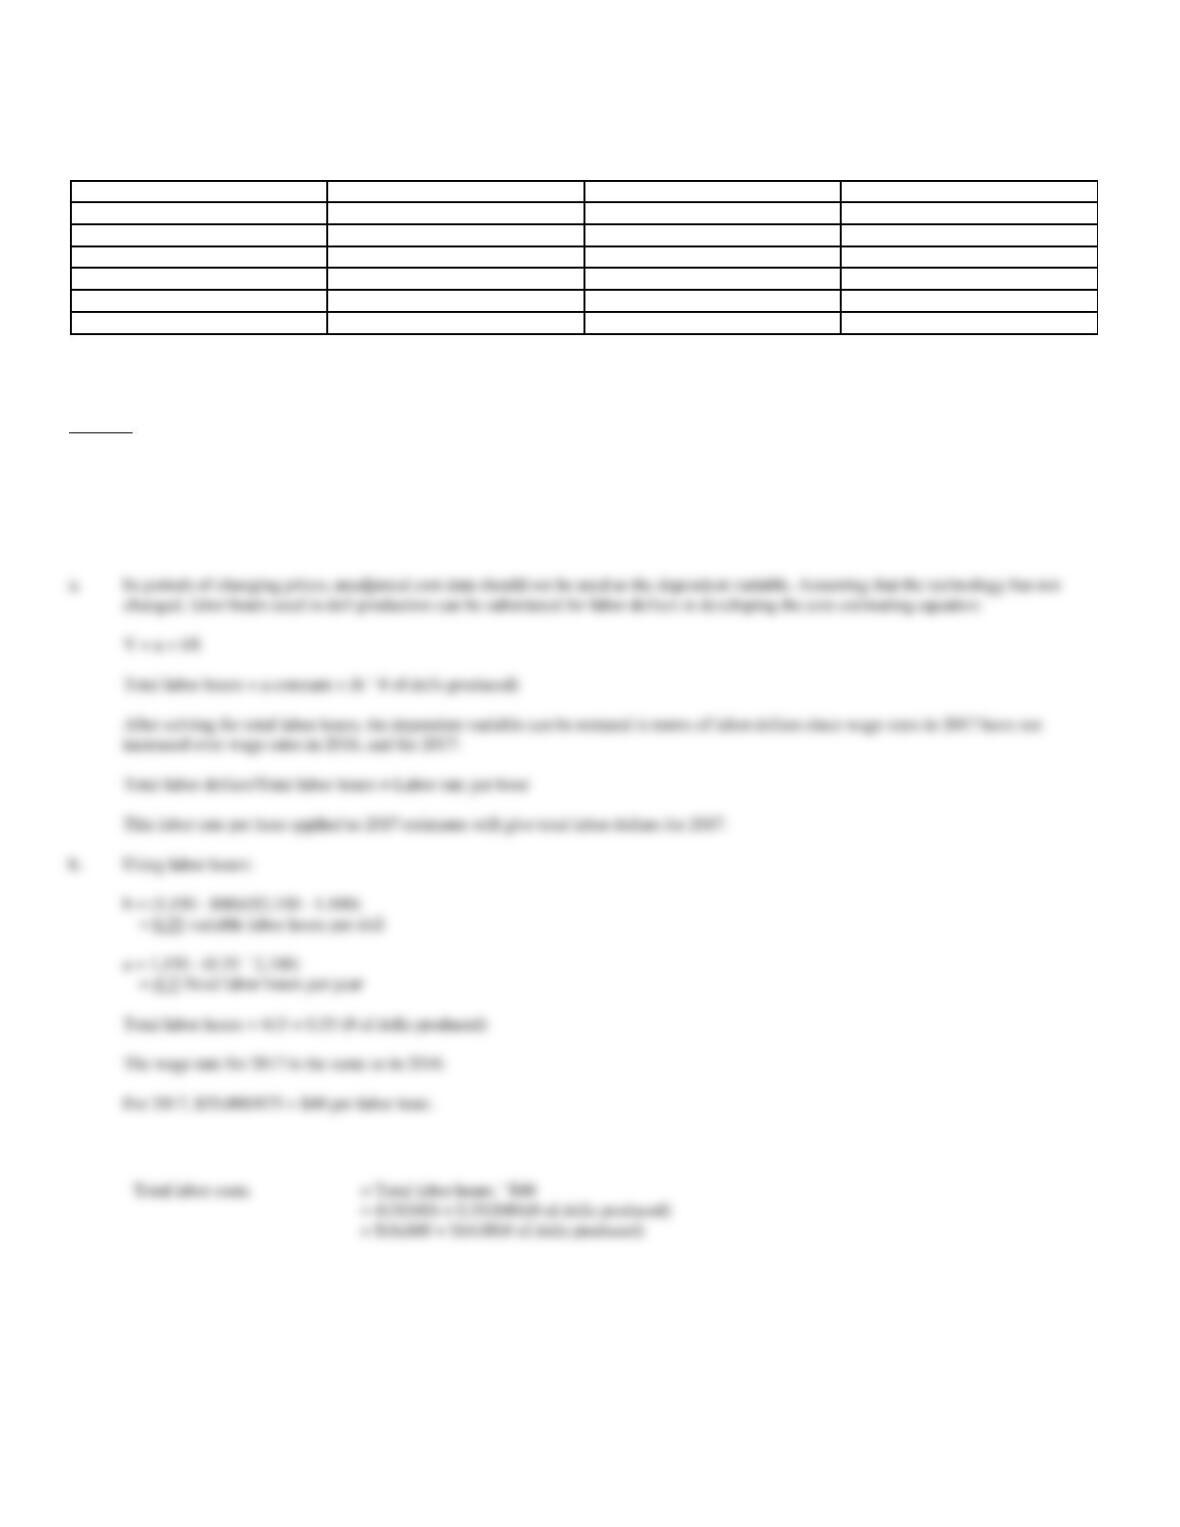
198. The Knapp Company needs to predict the labor cost in producing small ceramic dolls. The following
production information is available:
Year
Dolls Produced
Labor Hours
Labor Dollars
2011
1,150
850
$17,000
2012
1,600
975
23,400
2013
1,100
800
25,600
2014
2,100
1,150
36,800
2015
1,500
950
34,200
2016
1,300
875
35,000
Wage rates have steadily increased since 2011; however, management expects no
further increases in 2017.
Required:
a.
Select the appropriate independent variable for predicting labor cost. Explain the reason for your selection.
b.
Develop an equation to predict for 2017 the labor cost of producing ceramic dolls. Use the high-low method.
Y = a + bX
Total labor hours = a constant + (b ´ # of dolls produced)
Total labor dollars/Total labor hours = Labor rate per hour
This labor rate per hour applied to 2017 estimates will give total labor dollars for 2017.
b.
Using labor hours:
b = (1,150 – 800)/($2,100 – 1,100)
= 0.35 variable labor hours per doll
a = 1,150 – (0.35 ´ 2,100)
= 415 fixed labor hours per year
Total labor hours = 415 + 0.35 (# of dolls produced)
The wage rate for 2017 is the same as in 2016.
For 2017, $35,000/875 = $40 per labor hour.
Total labor costs
= Total labor hours ´ $40
= 415($40) + 0.35($40)(# of dolls produced)
= $16,600 + $14.00(# of dolls produced)
199. Alamo, Inc., is beginning the production of a new product. Management believes that 500 labor hours will
be required to complete the new unit. An 80 percent incremental unit-time learning curve model for direct labor
hours is assumed to be valid. Assume the q = -0.3219. Data on costs are as follows:
Direct materials
$50,000 per unit
Direct labor
$20 per direct labor hour
Variable manufacturing overhead
$30 per direct labor hour
Required:
a.
Set up a table with columns for cumulative number of units showing the cumulative total time in hours using the incremental unit-time
learning curve. Complete the table for 1, 2, 3, and 4 units given the individual unit time for the nth unit as 500, 400, 351, and 320 for 1 to 4
units respectively.
b.
Set up a similar table assuming a 90 percent with the incremental unit-time learning curve with the individual unit time for the nth unit as
500, 450, 430, 405 for 1 to 4 units respectively.
c.
What is the difference in variable cost of producing four units?
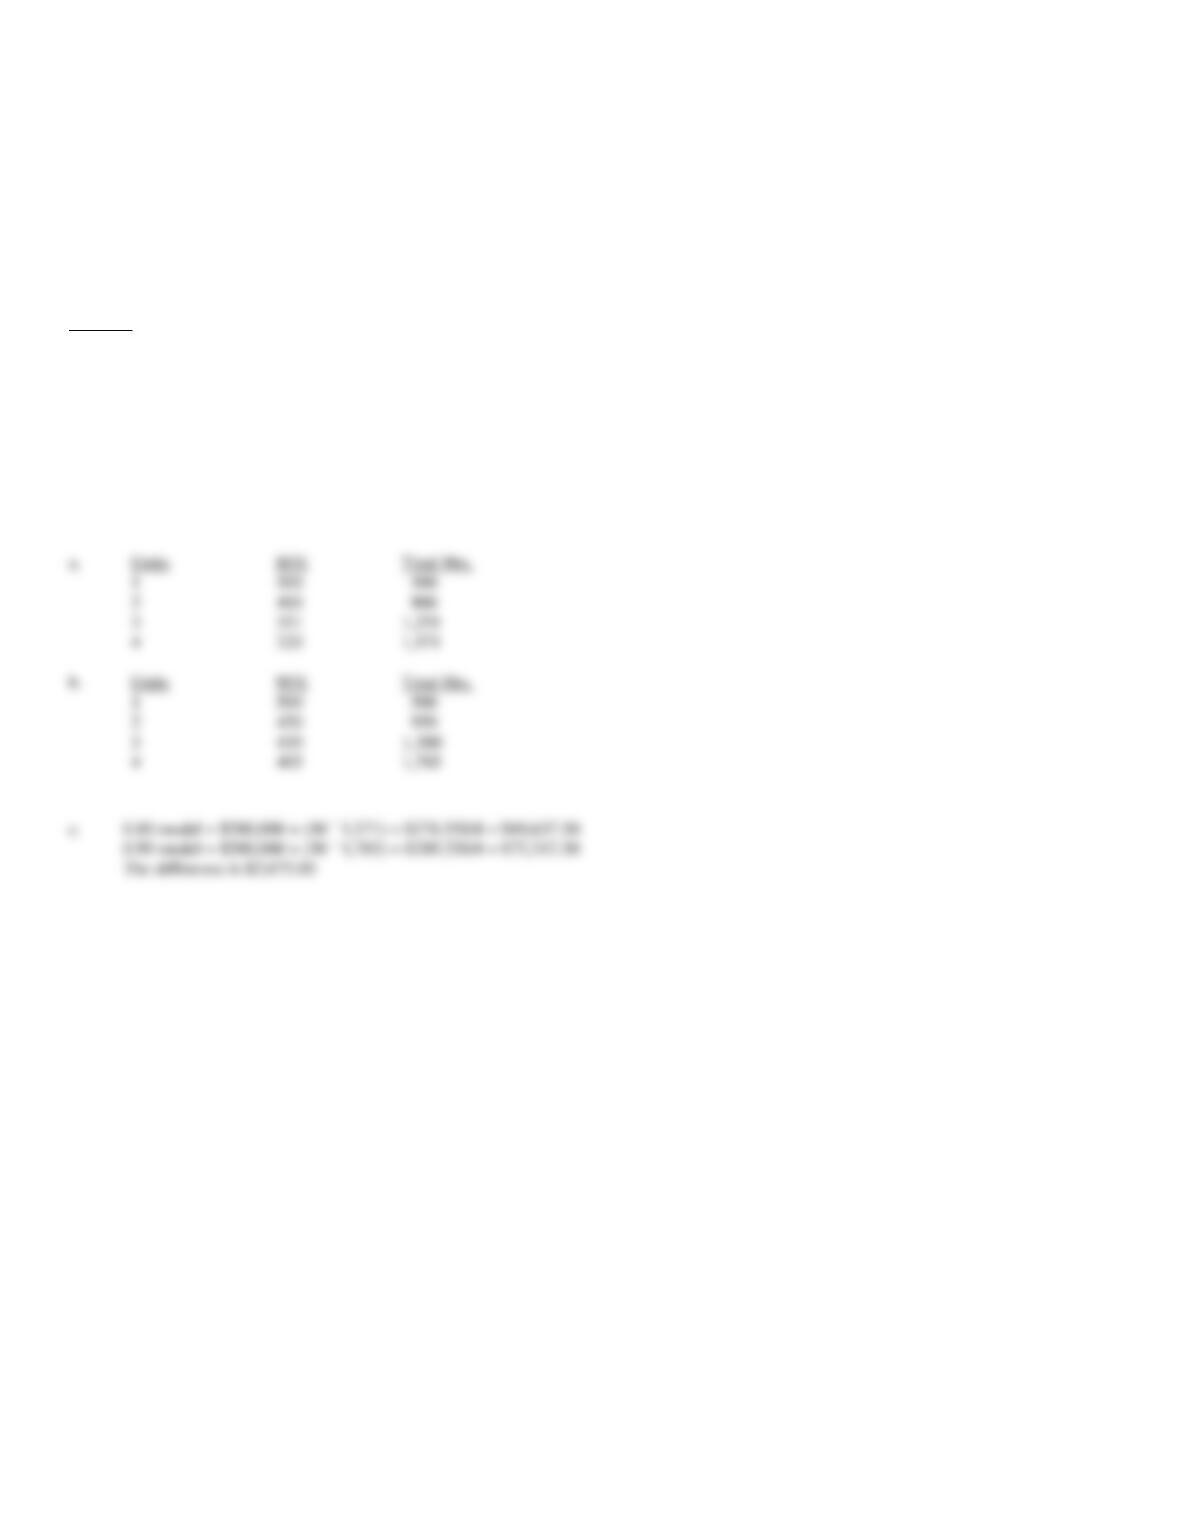
a.
Units
80%
Total Hrs.
1
500
2
900
3
1,251
4
1,571
Units
90%
Total Hrs.
1
500
2
950
3
1,380
4
1,785
c.
0.80 model = $200,000 + (50 ´ 1,571) = $278,550/4 = $69,637.50
0.90 model = $200,000 + (50 ´ 1,785) = $289,250/4 = $72,312.50
The difference is $2,675.00
200. Highestec, Inc., is beginning the production of a new product. Management believes that 500 labor hours
will be required to complete the new unit. A 90 percent cumulative average-time learning curve model for direct
labor hours is assumed to be valid. Data on costs are as follows:
Direct materials
$50,000 per unit
Direct labor
$20 per direct labor hour
Variable manufacturing overhead
$30 per direct labor hour
Required:
a.
Set up a table with columns for cumulative number of units, cumulative average time per unit in hours, and cumulative total time in hours
using the cumulative average-time learning curve. Complete the table for 1, 2, 4, and 8 units.
b.
Set up a similar table assuming an 80 percent cumulative average-time learning curve.
c.
What is the difference in variable cost of producing four units?
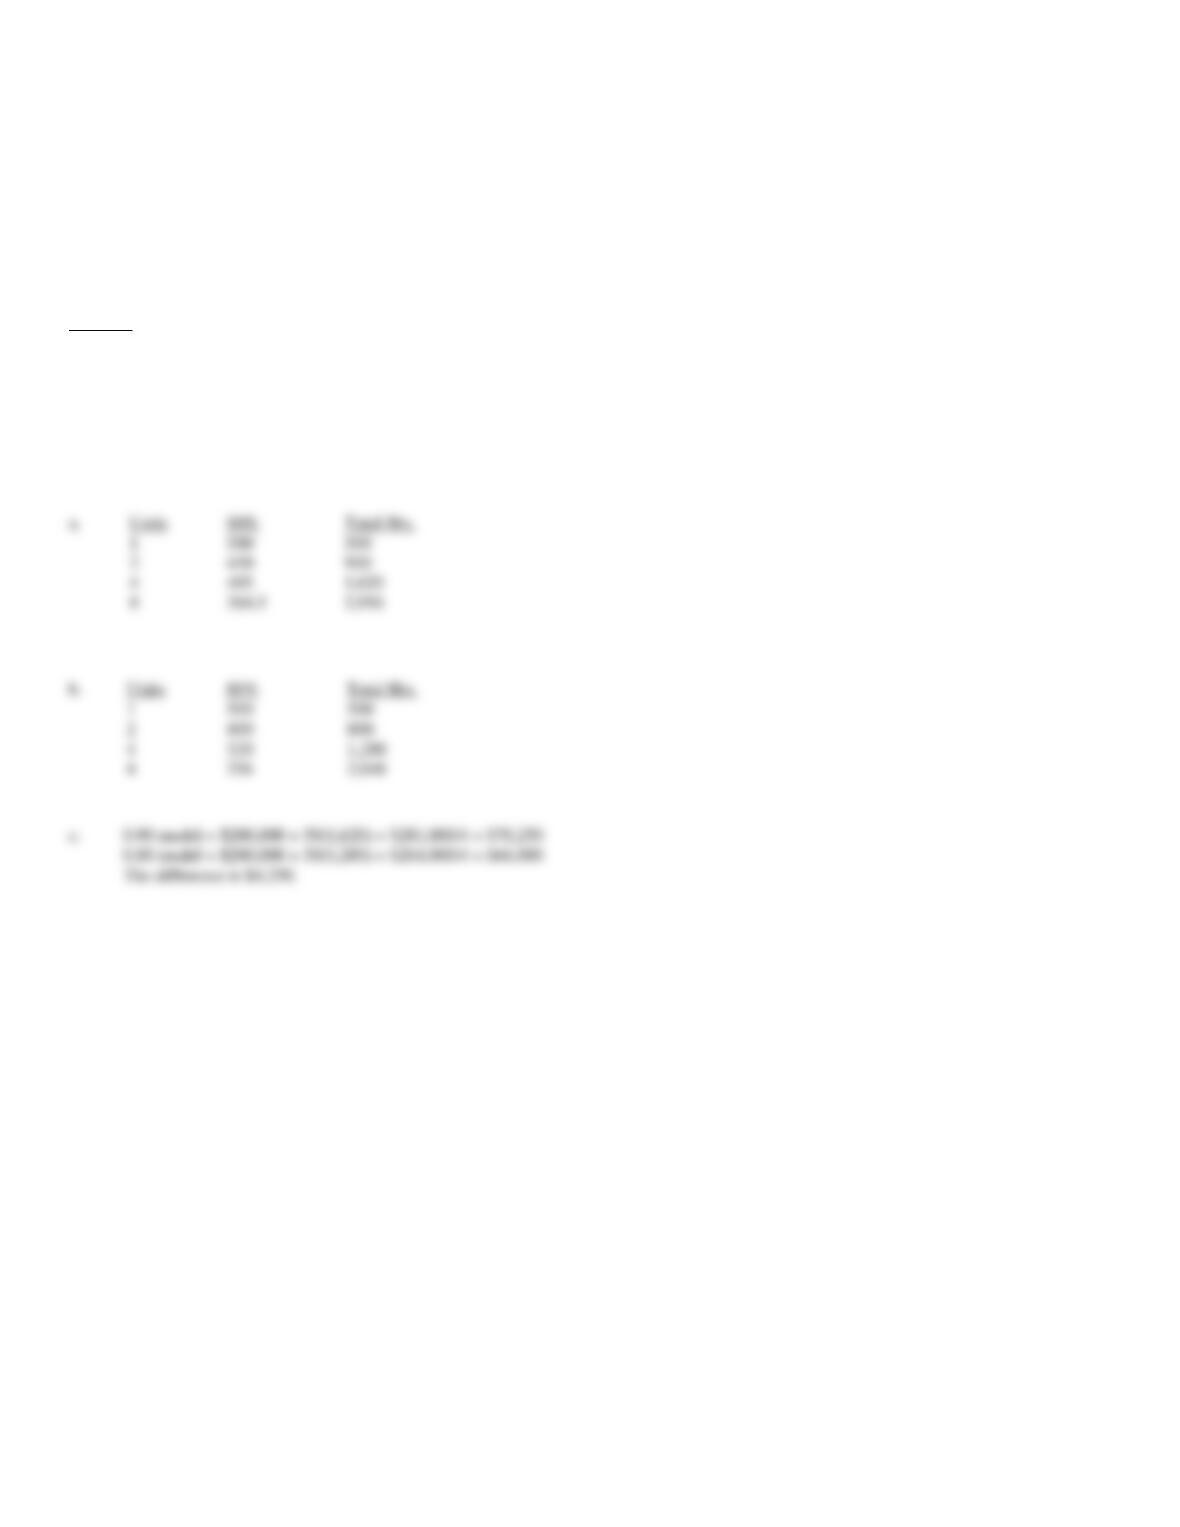
Units
90%
Total Hrs.
1
500
500
2
450
900
4
405
1,620
8
364.5
2,916
b.
Units
80%
Total Hrs.
1
500
500
2
4
320
1,280
8
256
2,048
0.90 model = $200,000 + 50(1,620) = $281,000/4 = $70,250
0.80 model = $200,000 + 50(1,280) = $264,000/4 = $66,000
The difference is $4,250.