Solve the problem.
38)
Suppose that during a certain step in a chemical manufacturing process the amount of
hydrogen sulfide dissolved in a solution, measured in parts per million (ppm), is related to the
elapsed time measured from the beginning of the step. Use the following table as a representation
of this relationship. Write the data from the table as ordered pairs (x, y), where x represents the
time and y represents the amount dissolved.
TIME
(minutes)
AMOUNT DISSOLVED
(ppm)
420.0
822.4
12 24.4
16 26.4
20 28.2
38)
A)
(0, 20.0), (4, 22.4), (8, 24.4), (12, 26.4), (16, 28.2)
B)
(4, 20.0), (8, 22.4), (12, 24.4), (16, 26.4), (20, 28.2)
C)
(1, 20.0), (2, 22.4), (3, 24.4), (4, 26.4), (5, 28.2)
D)
(20.0, 4), (22.4, 8), (24.4, 12), (26.4, 16), (28.2, 20)
Decide whether or not the ordered pair is a solution to the equation.
39)
3x + 5y =19; (3, 2)
39)
A)
Yes
B)
No
A
21
B
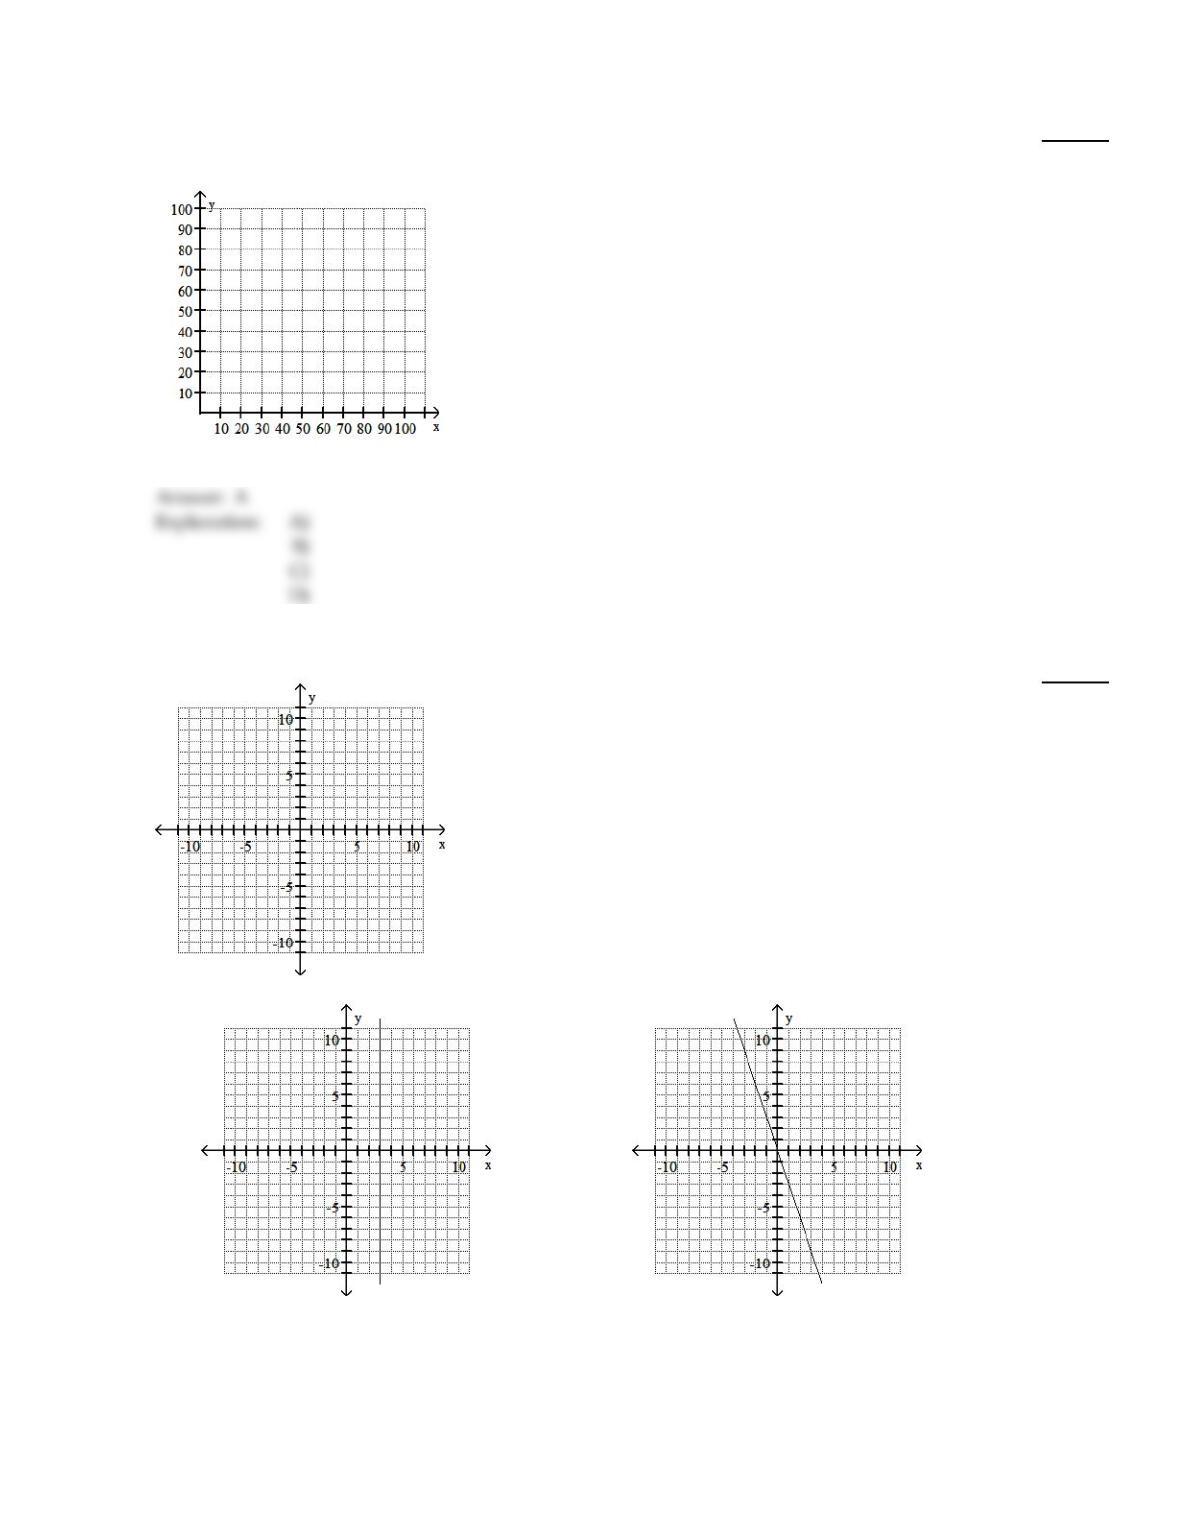
Solve by graphing. Label the axes and show where the solution is located on the graph.
40)
Suppose y = mx + b is a mathematical model for actual time as a function of estimated time, where
y represents actual time and x represents estimated time and m and b are constants. If m =1.8 and
b = – 0.3, find y when x is 30 min.
40)
A)
53.7 min
B)
30.54 min
C)
54.3 min
D)
29.46 min
Graph the line through the given point with the given slope.
41)
(–3, –2), undefined slope
41)
A)
B)
22
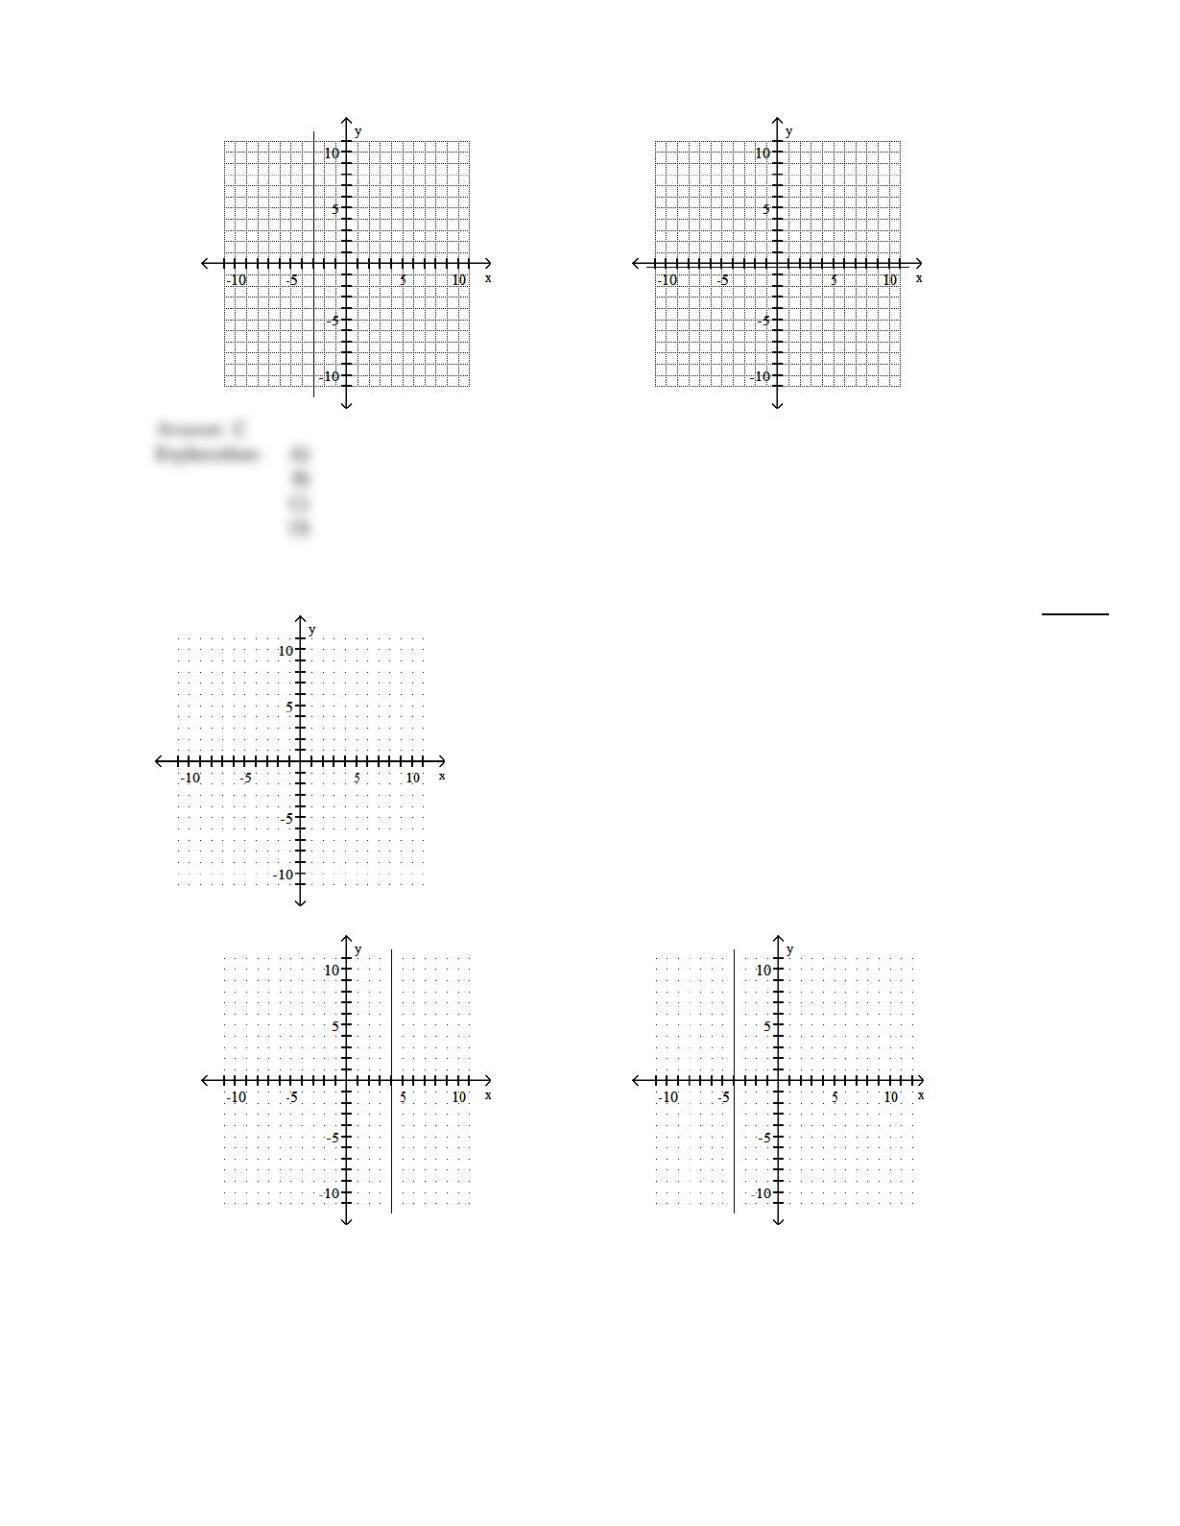
C)
D)
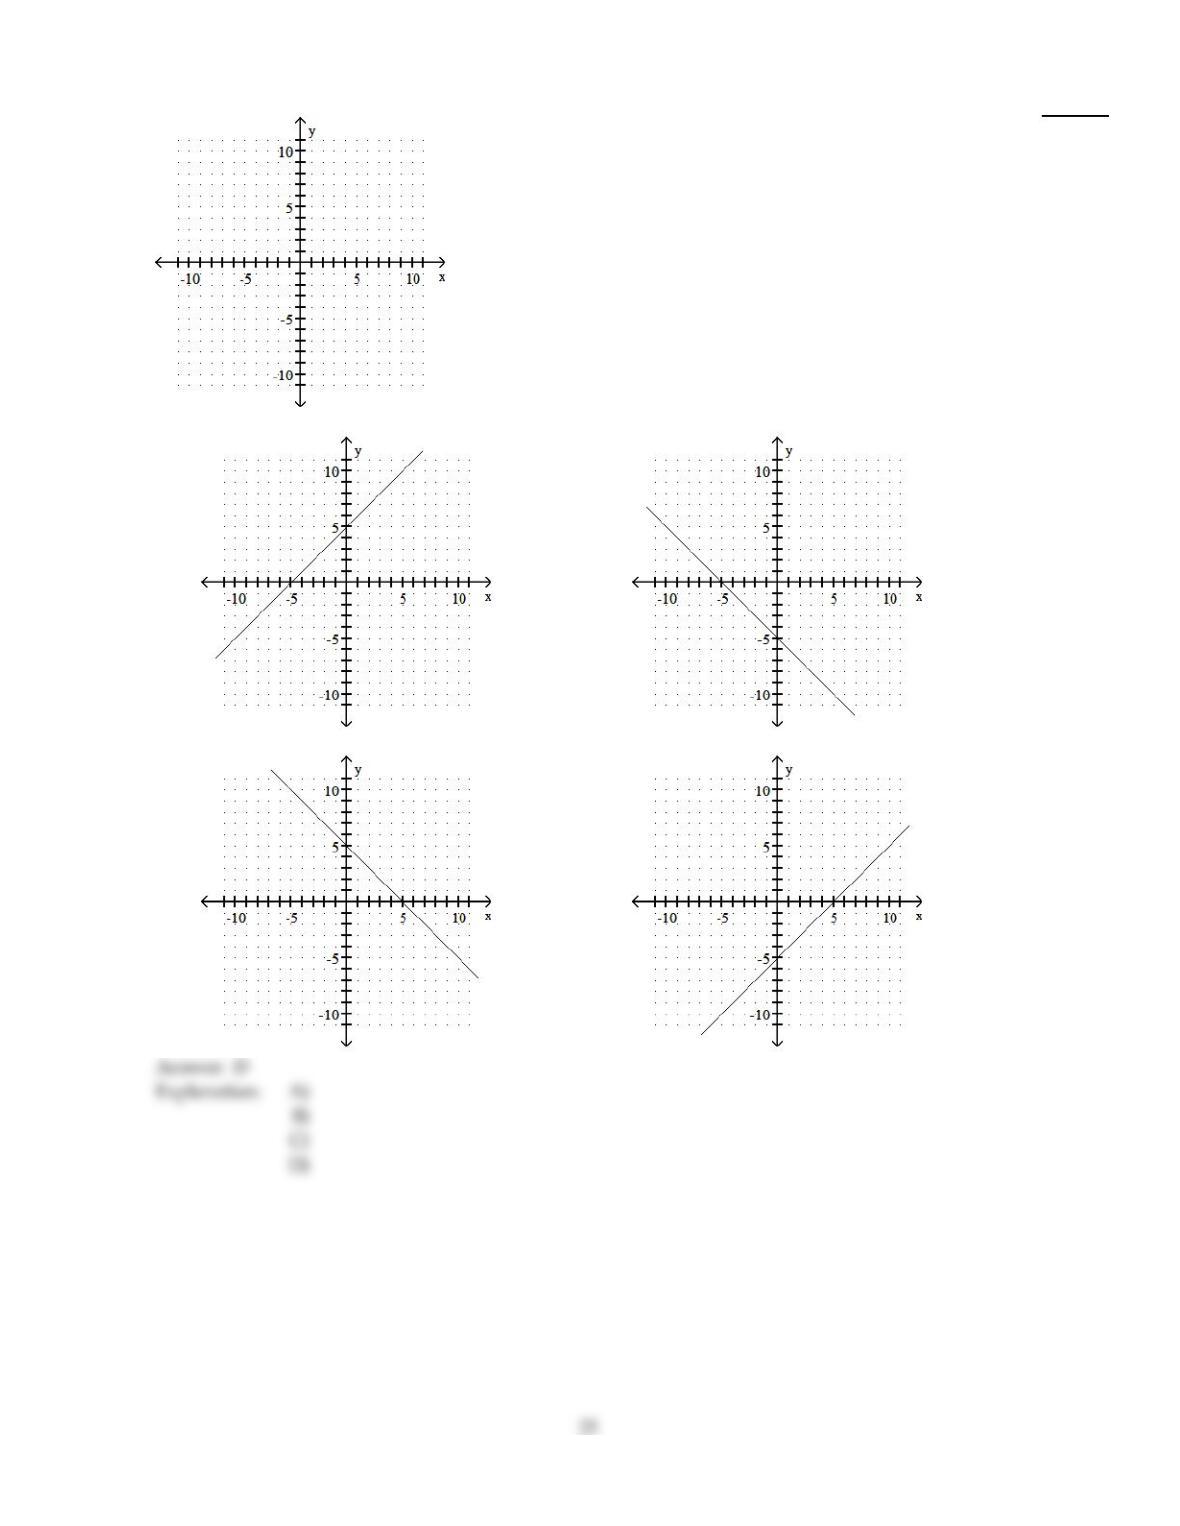
Graph the linear equation. Give the x– and y–intercepts.
42)
x + 4 = 0
42)
A)
x–intercept: (4, 0); y–intercept: none
B)
x–intercept: (–4, 0); y–intercept: none
23
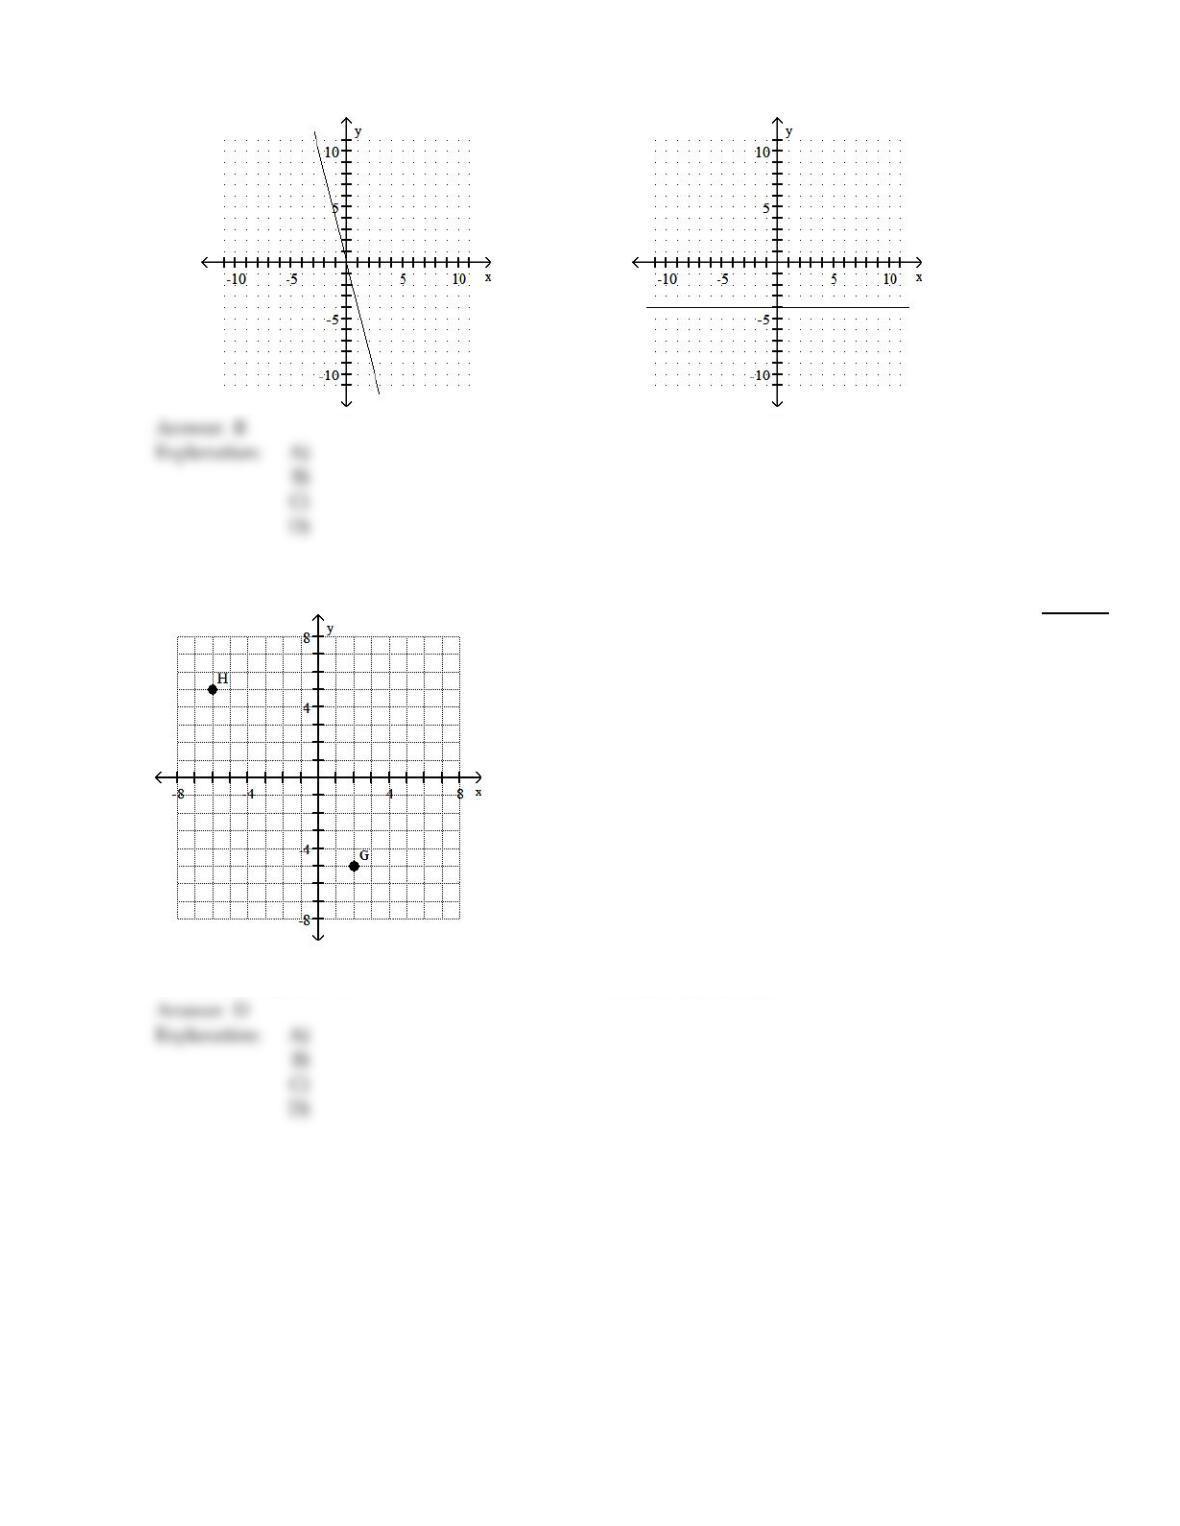
C)
x–intercept: (0, 0); y–intercept: (0, 0)
D)
x–intercept: none; y–intercept: (0, –4)
Give the ordered pairs for the points labeled on the graph.
43)
43)
A)
G(2, 5); H(–5, 5)
B)
G(2, –5); H(5, –6)
C)
G(–5, 20); H(5, –6)
D)
G(2, –5); H(–6, 5)
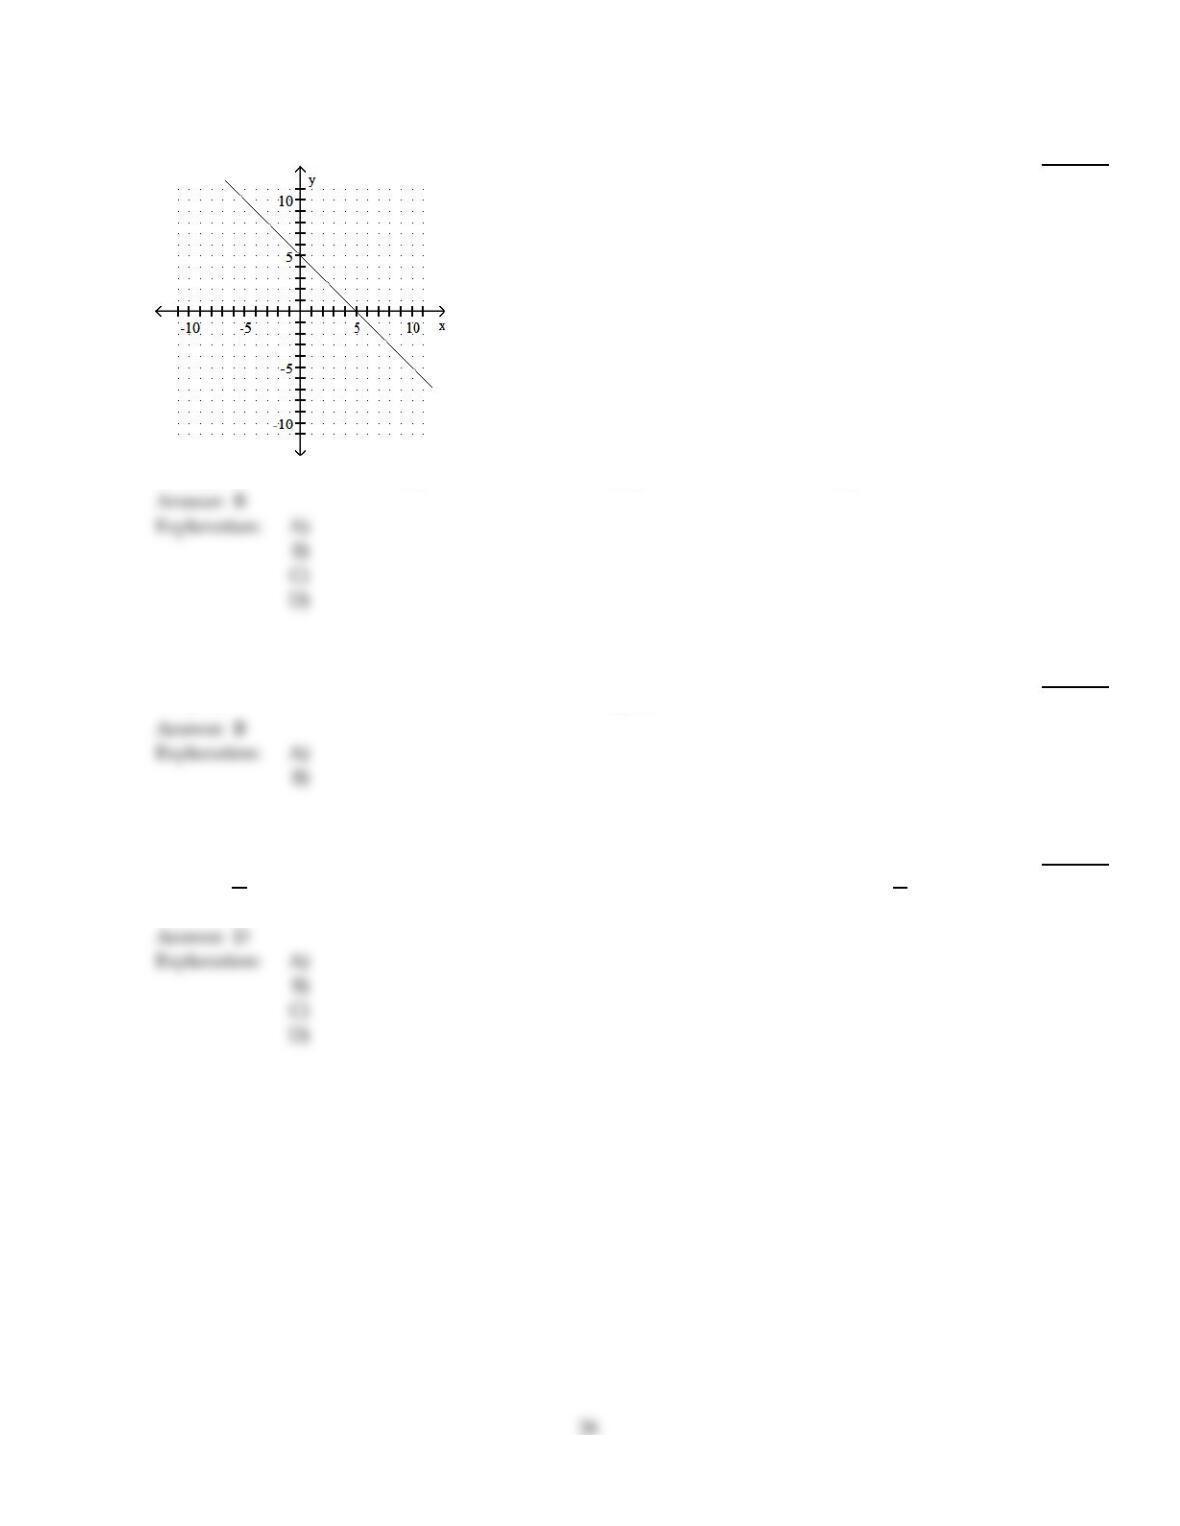
Graph the linear equation. Give the x– and y–intercepts.
24
44)
x – y =5
44)
A)
x–intercept: (– 5, 0); y–intercept: (0, 5)
B)
x–intercept: (– 5, 0); y–intercept: (0, – 5)
C)
x–intercept: (5, 0); y–intercept: (0, 5)
D)
x–intercept: (5, 0); y–intercept: (0, – 5)
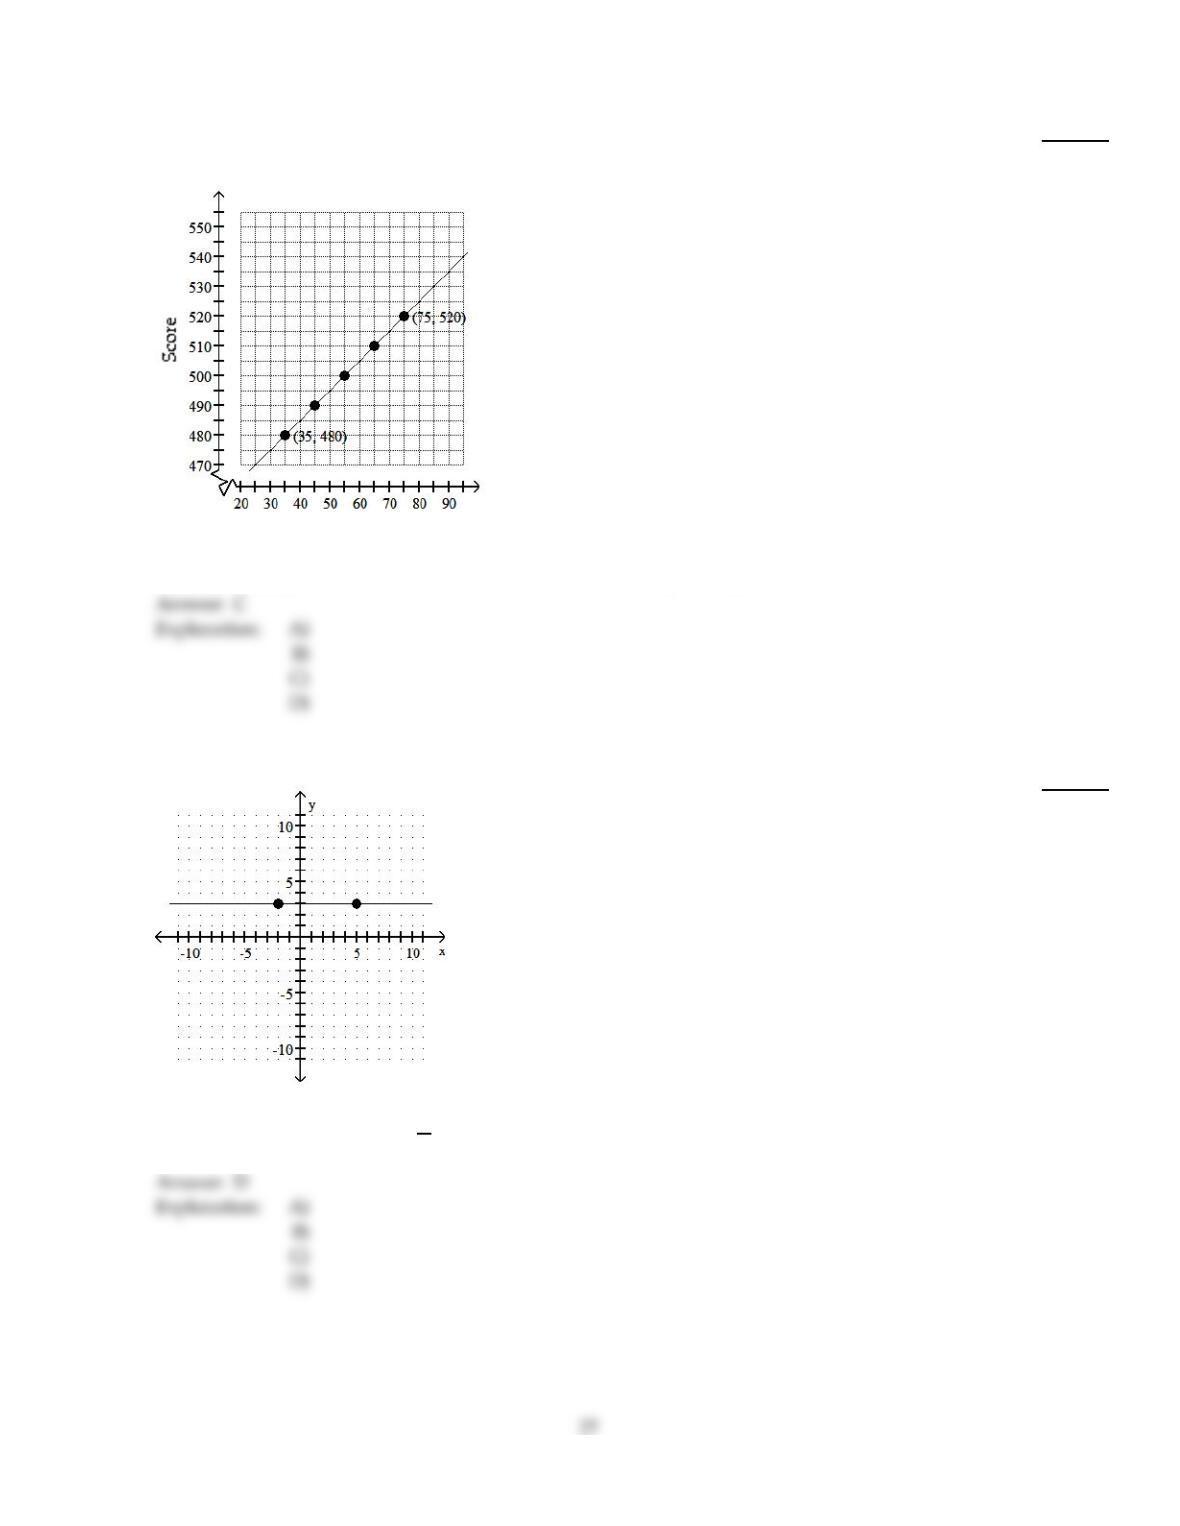
Use the geometric interpretation of slope (rise divided by run) to find the slope of the line. Then, by identifying the
y–intercept from the graph, write the slope–intercept form of the equation of the line.
45)
45)
A)
y = x +5
B)
y = – x +5
C)
y = – x –5
D)
y = x –5
Solve.
46)
Is (5, 2) a solution of 3x – 2y =19?
46)
A)
Yes
B)
No
B
Write the slope–intercept form of the equation for the line passing through the given pair of points.
47)
(–7, –2) and (0, –5)
47)
A)
y =3
7x – 5
B)
y = – 1x – 5
C)
y =1x – 5
D)
y = – 3
7x – 5
D
B
Solve the problem.
48)
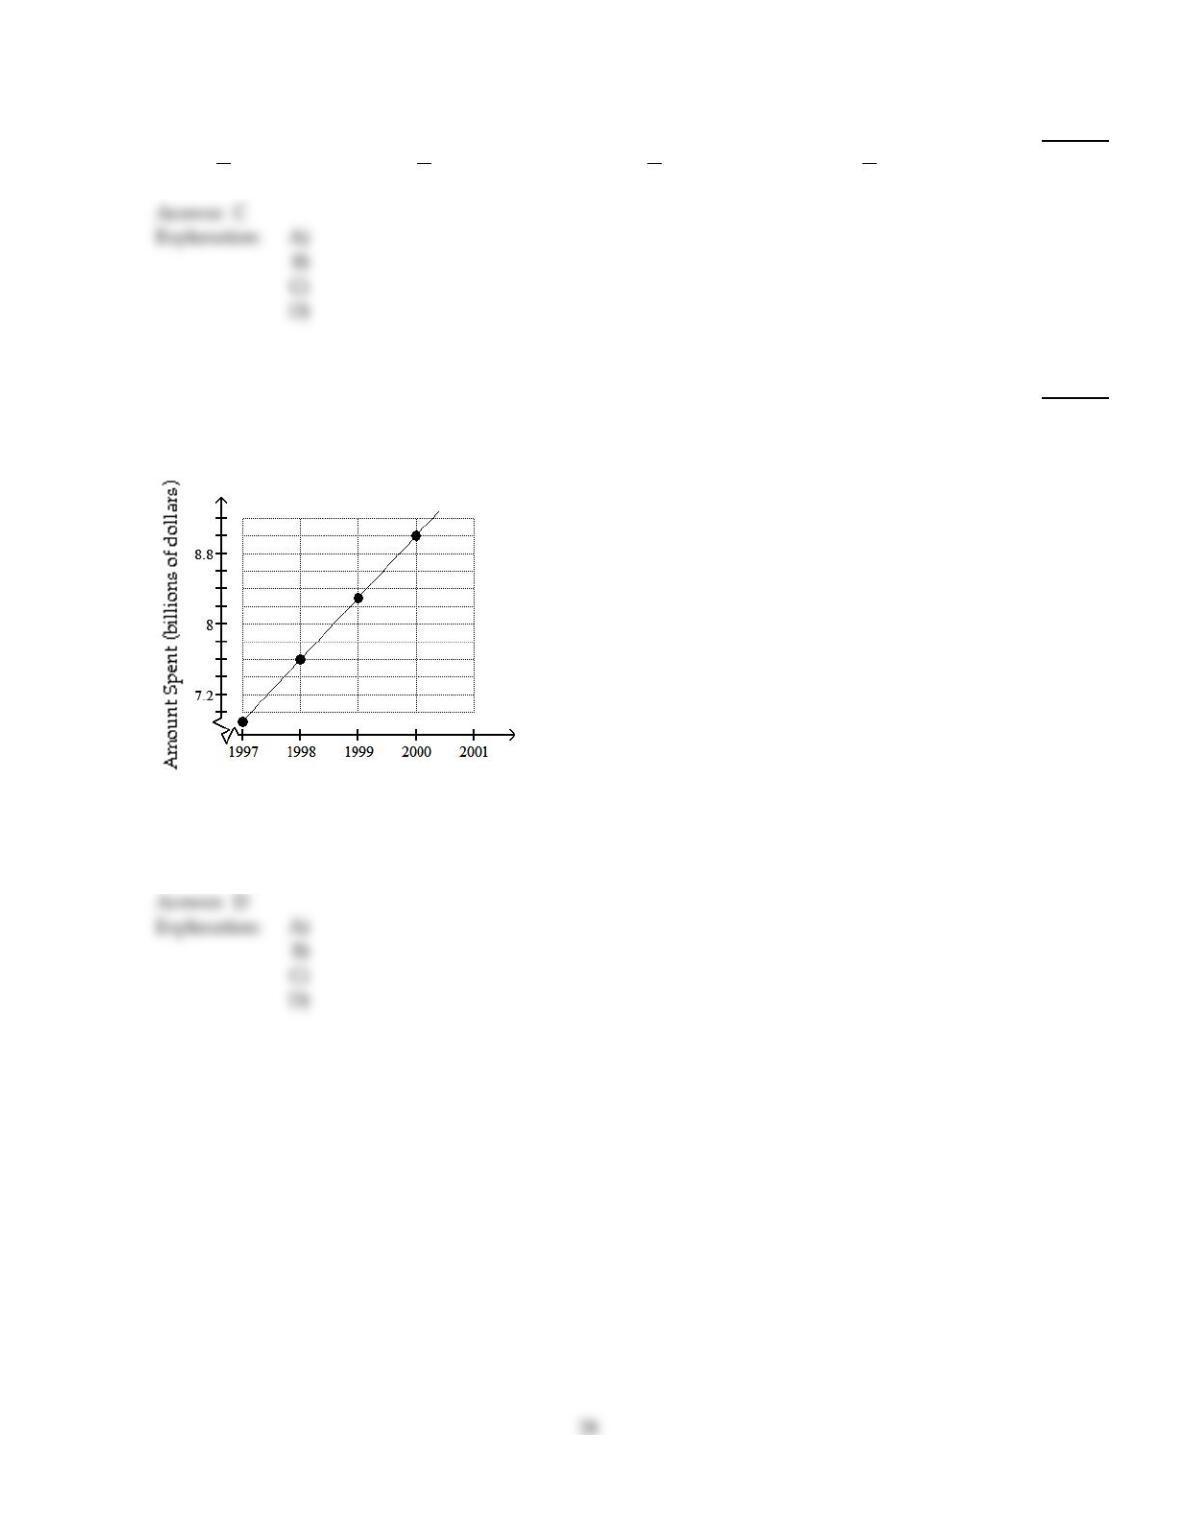
The graph depicts a relationship between scores achieved on an unspecified standardized test and
family income. Find the slope of the line.
r
Income (in $1000’s)
48)
A)
10.1 point(s) per thousand dollars
B)
1000 point(s) per thousand dollars
C)
1 point(s) per thousand dollars
D)
100 point(s) per thousand dollars
Use the coordinates of the indicated points to find the slope of the line.
49)
49)
A)
undefined
B)
7
6
C)
3
D)
0
Find the slope of the line.
50)
–8x =3y + 9
50)
A)
–3
8
B)
8
3
C)
–8
3
D)
–9
8
Solve the problem.
51)
Data regarding the amount spent by a government department is represented in the following
graph. Find the change in amount spent for the years shown in the graph. Is the graph a straight
line?
Year
51)
A)
Change for each year: $0.38 billion; yes
B)
Change from 1998 to 1999: $0.72 billion, change from 1999 to 2000: $0.18 billion; no
C)
Change for each year: $0.18 billion; yes
D)
Change for each year: $0.72 billion; yes
52)
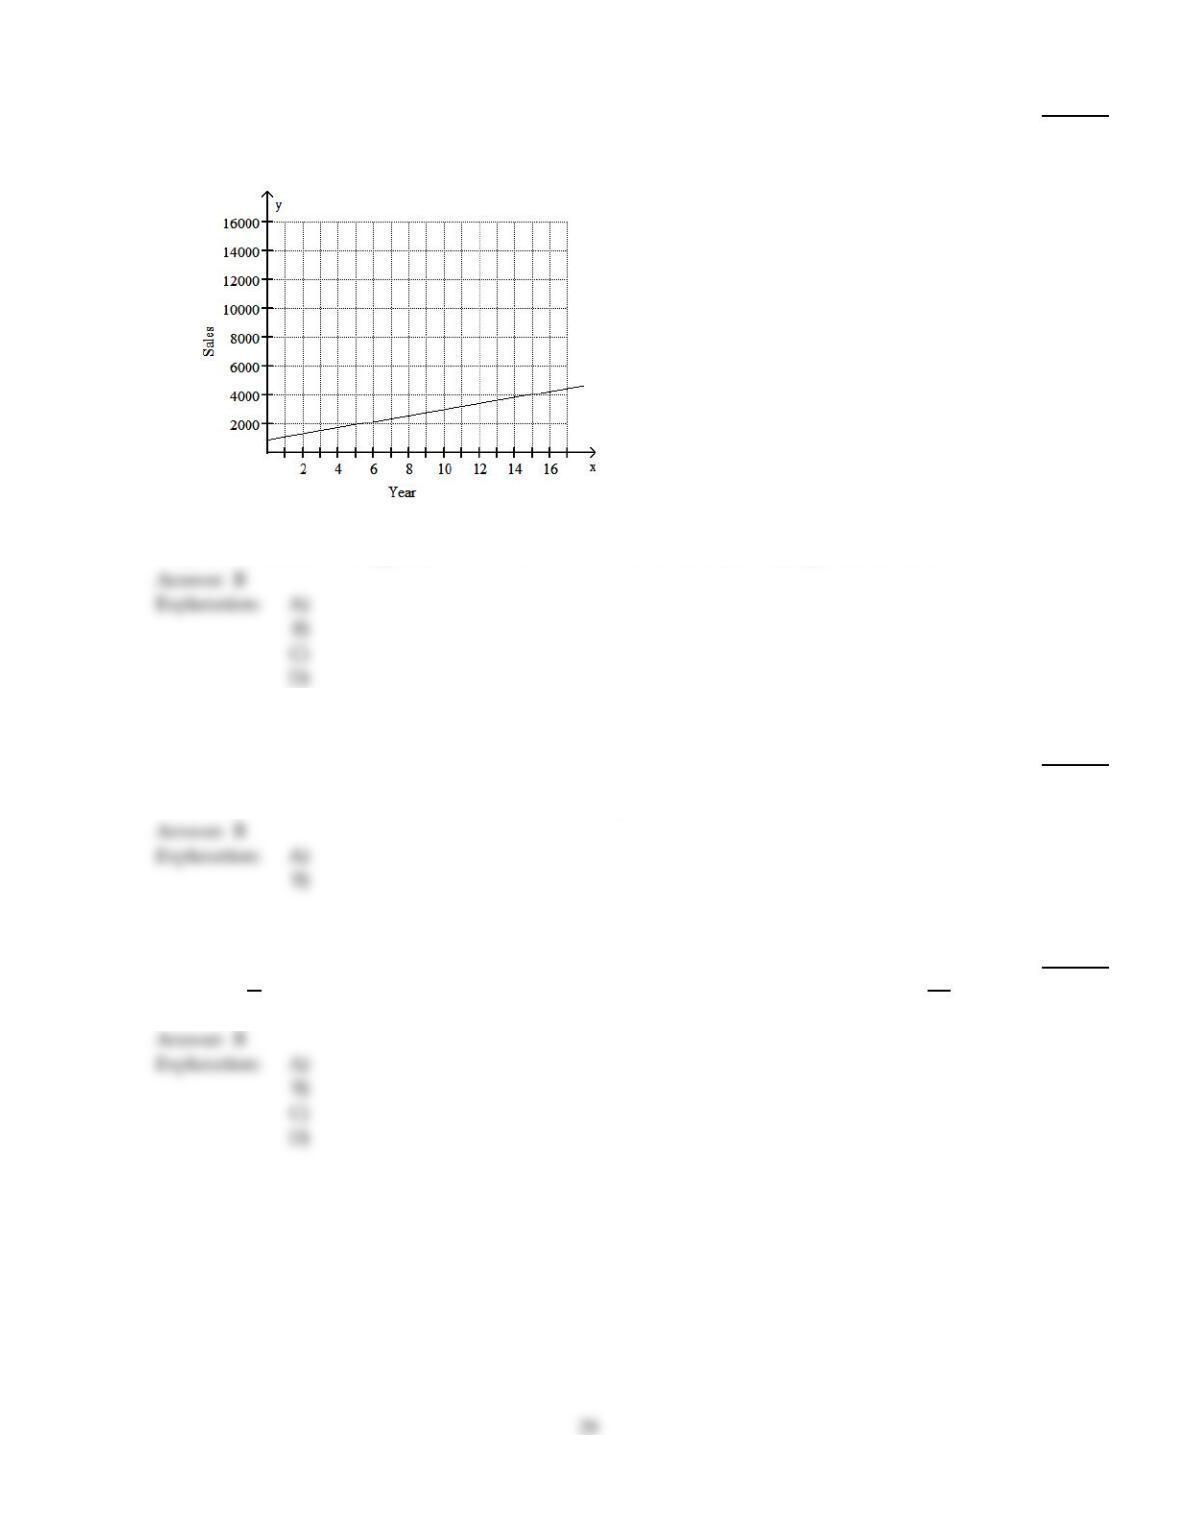
Suppose that sales of a particular brand of appliance satisfy the relationship y =210x + 900, where y
represents the number of sales in year x, with x = 0 corresponding to 1992. What does the ordered
pair (8, 2580) mean in the context of the situation?
52)
A)
In 2000, sales of the appliance were 5160.
B)
In 2000, sales of the appliance were 2580.
C)
In 2000, sales of the appliance were 2370.
D)
In 2000, sales of the appliance were 4950.
Answer the question.
53)
True or False? The ordered pair (0, 0) determines a point in quadrant I with x–coordinate 0 and
y–coordinate 0.
53)
A)
True
B)
False
Write an equation for the line. Give the final answer in slope–intercept form.
54)
Through (4, 2), m = – 8
54)
A)
y = – 1
8x +34
B)
y = – 8x +34
C)
y = – 8x –34
D)
y = – 8x +1
34
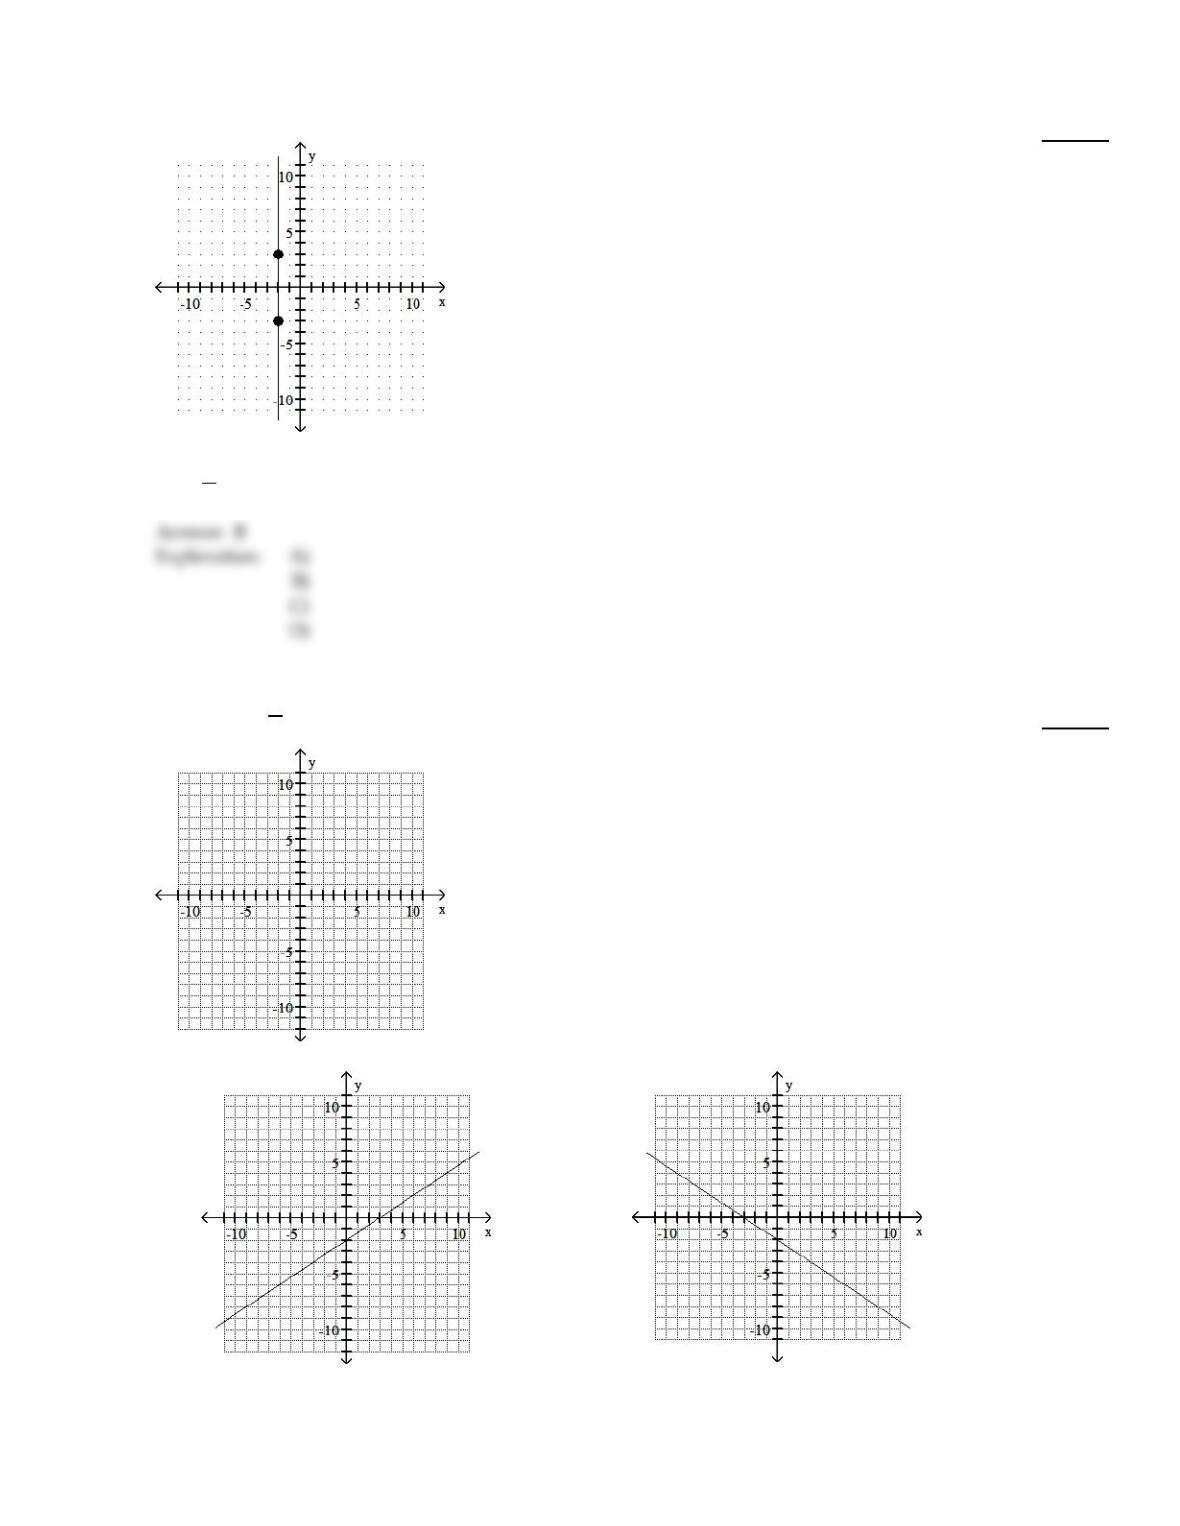
Use the coordinates of the indicated points to find the slope of the line.
55)
55)
A)
3
2
B)
undefined
C)
–2
D)
0
Graph the line through the given point with the given slope.
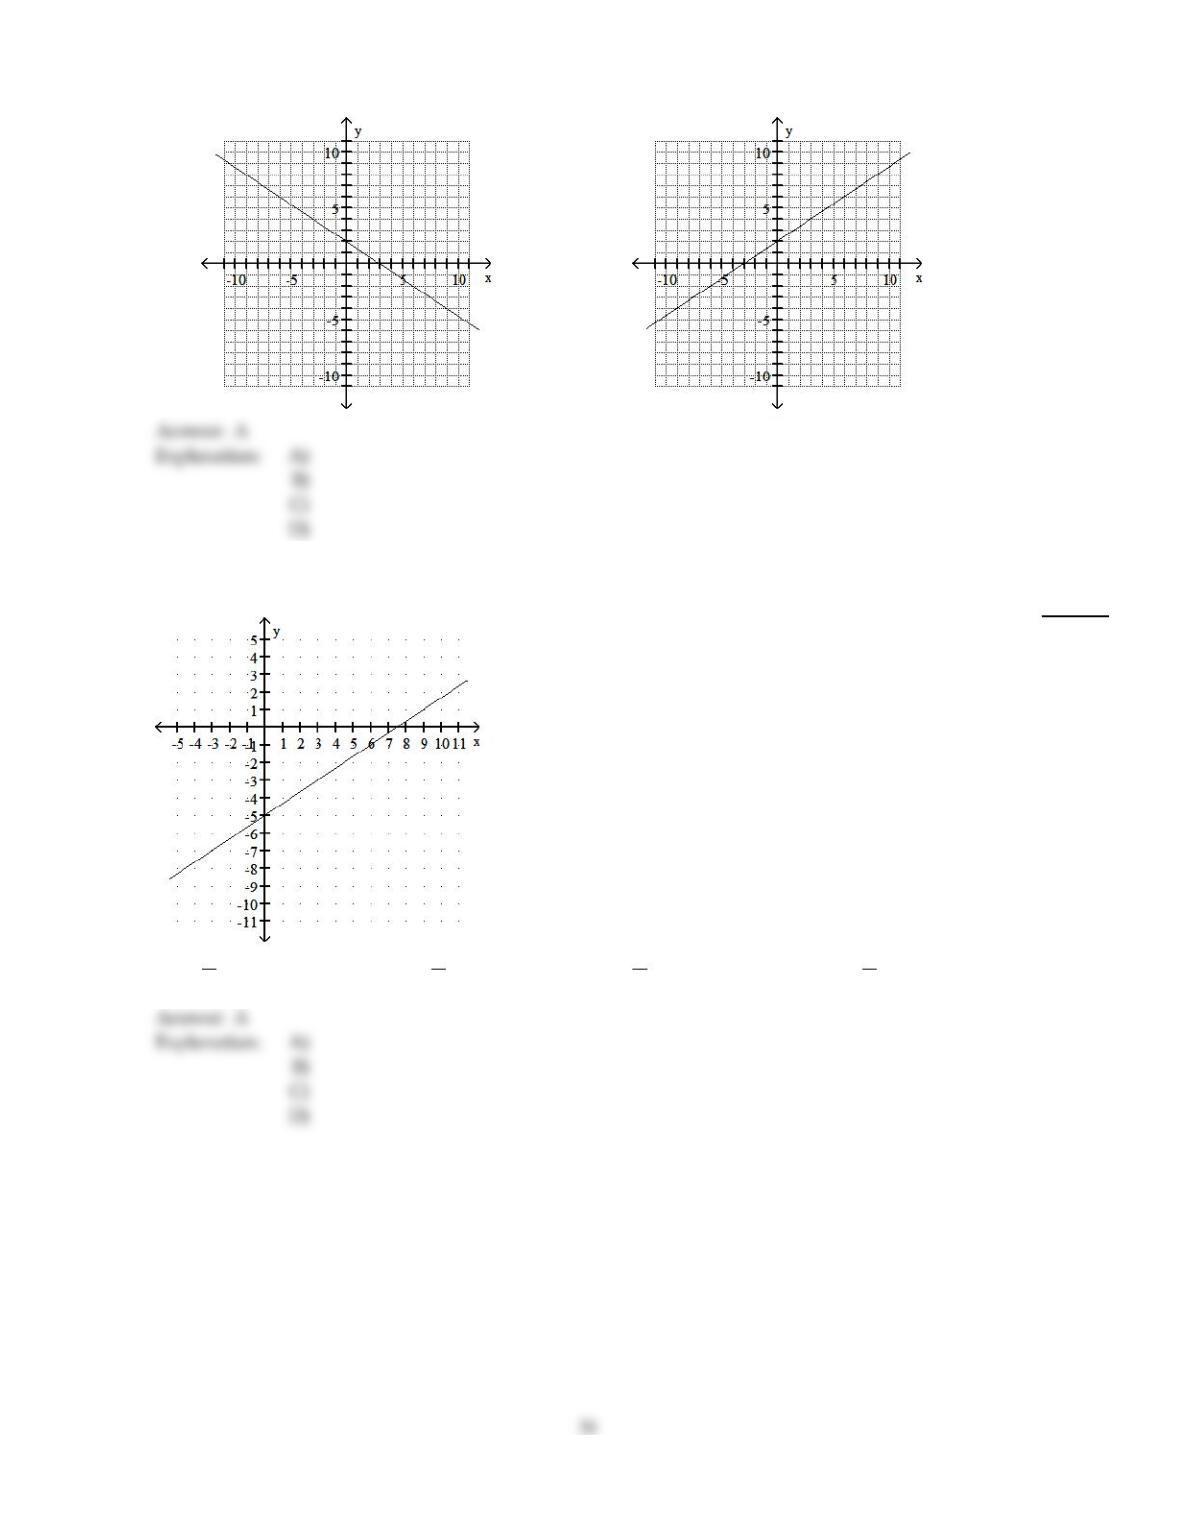
56)
(–6, –6) , m =2
3
56)
A)
B)
30
C)
D)
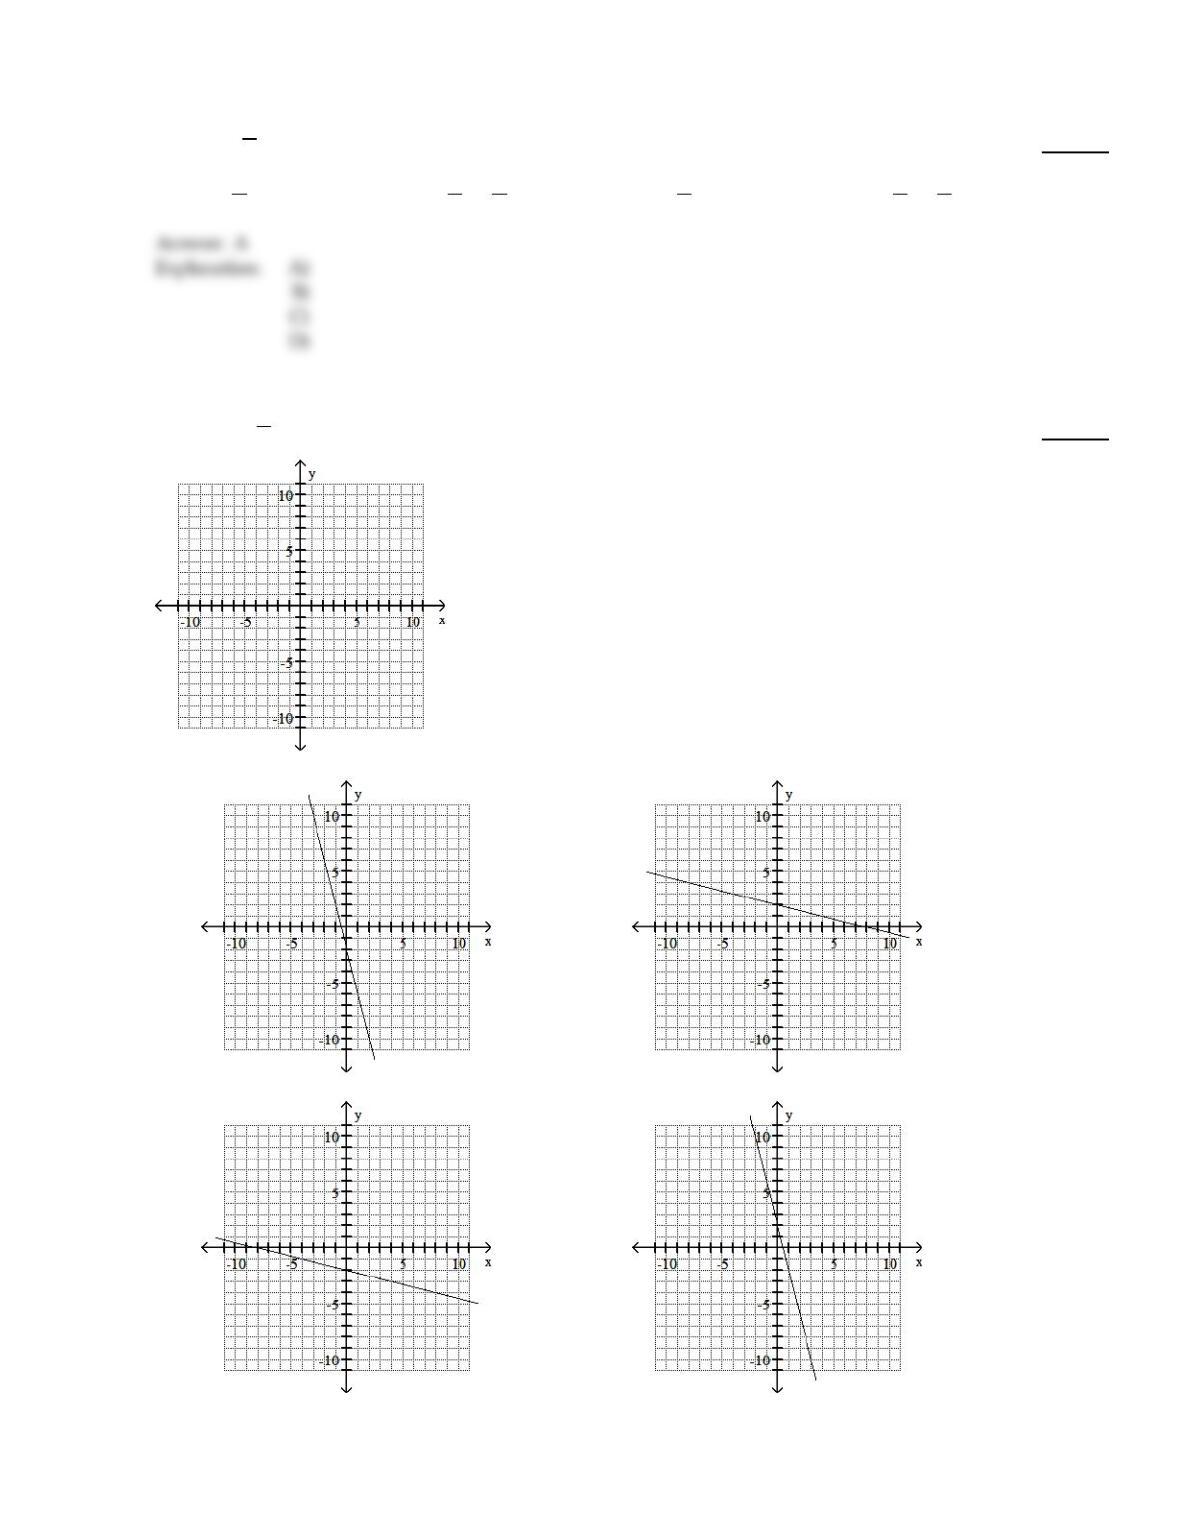
Find the slope of the line.
57)
57)
A)
2
3
B)
–2
3
C)
3
2
D)
–3
2
Write an equation of the line through the given point with the given slope. Write the equation in slope–intercept form.
58)
(0, 4); m =5
4
58)
A)
y =5
4x + 4
B)
y =5
4x –1
4
C)
y = – 5
4x + 4
D)
y = – 4
5x +1
4
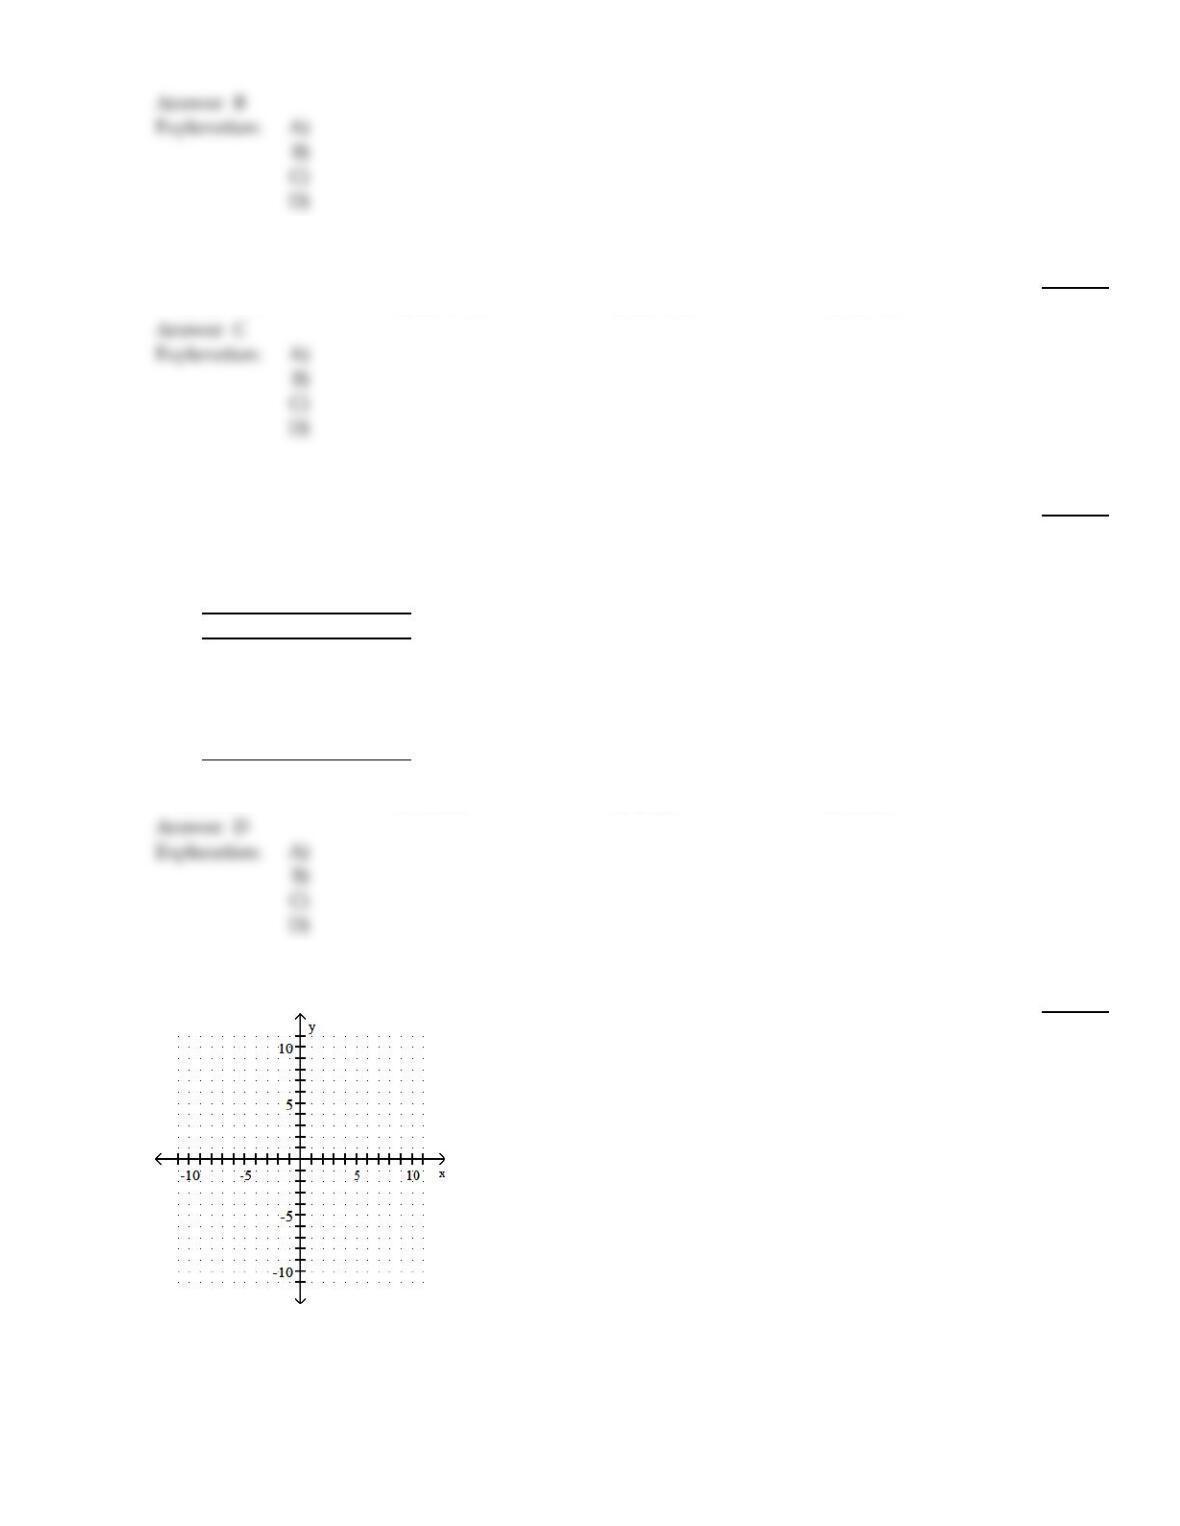
Graph the line through the given point with the given slope.
59)
(8, 0), m = – 1
4
59)
A)
B)
C)
D)
32
Complete the ordered pair for the given equation.
60)
9x + y = – 38 (0, )
60)
A)
(0, –47)
B)
(0, –342)
C)
(0, –38)
D)
(0, –5)
Solve the problem.
61)
The table lists the average annual cost (in dollars) of tuition and fees at a certain 2–year college for
selected years, where year 1 represents 1992, year 3 represents 1994, and so on. The equation
y =27x +1072 can be used to approximate the data. Predict the average annual cost in 2005 to the
nearest dollar.
Year Cost (in dollars)
11071
31153
51228
71282
91315
61)
A)
$1477
B)
$1504
C)
$1423
D)
$1450
Graph the linear equation. Give the x– and y–intercepts.
62)
y = – 3
62)
33
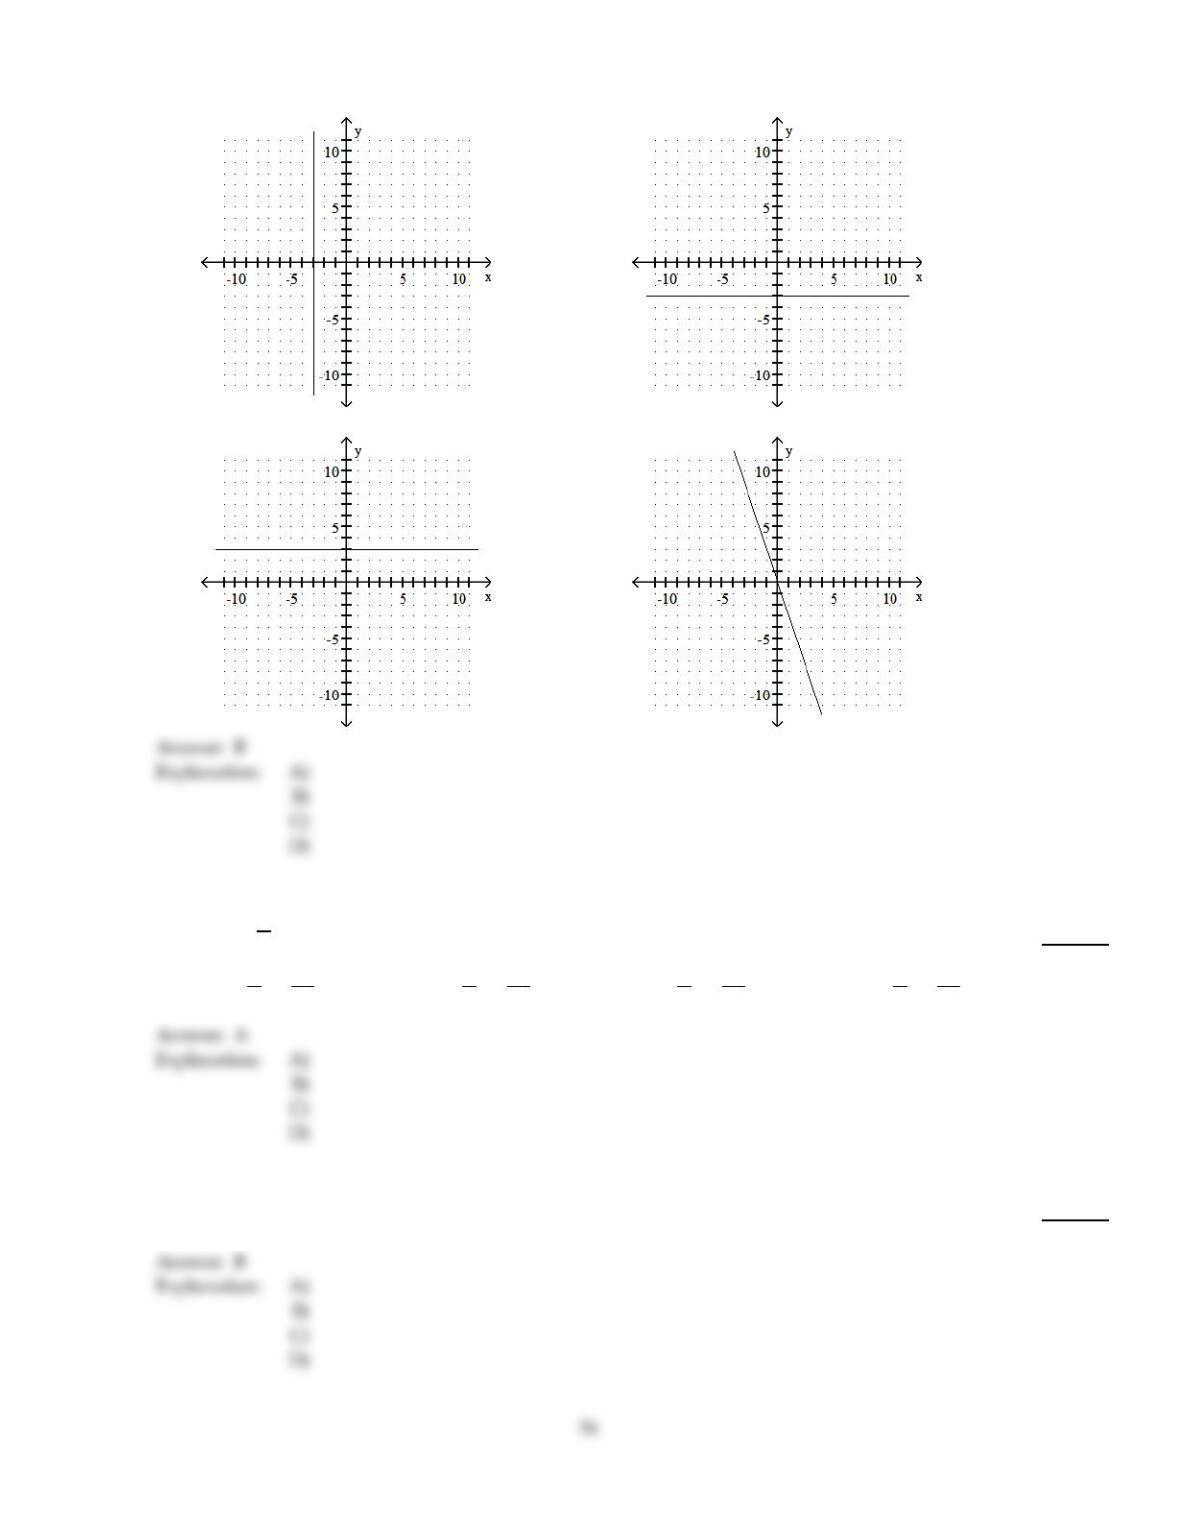
A)
x–intercept: (– 3, 0); y–intercept: none
B)
x–intercept: none; y–intercept: (0, – 3)
C)
x–intercept: none; y–intercept: (0, 3)
D)
x–intercept: (0, 0); y–intercept: (0, 0)
Write an equation of the line through the given point with the given slope. Write the equation in slope–intercept form.
63)
(5, 4); m = – 4
7
63)
A)
y = – 4
7x +48
7
B)
y = – 4
7x –48
7
C)
y = – 7
4x –7
48
D)
y = – 4
7x +7
48
Find the intercepts for the graph of the equation.
64)
–2x + 4y =4
64)
A)
(–2, –6) (–5, 4)
B)
(–2, 0) (0, 1)
C)
(0, –5) (0, –6)
D)
(–5, 0) (–6, 0)
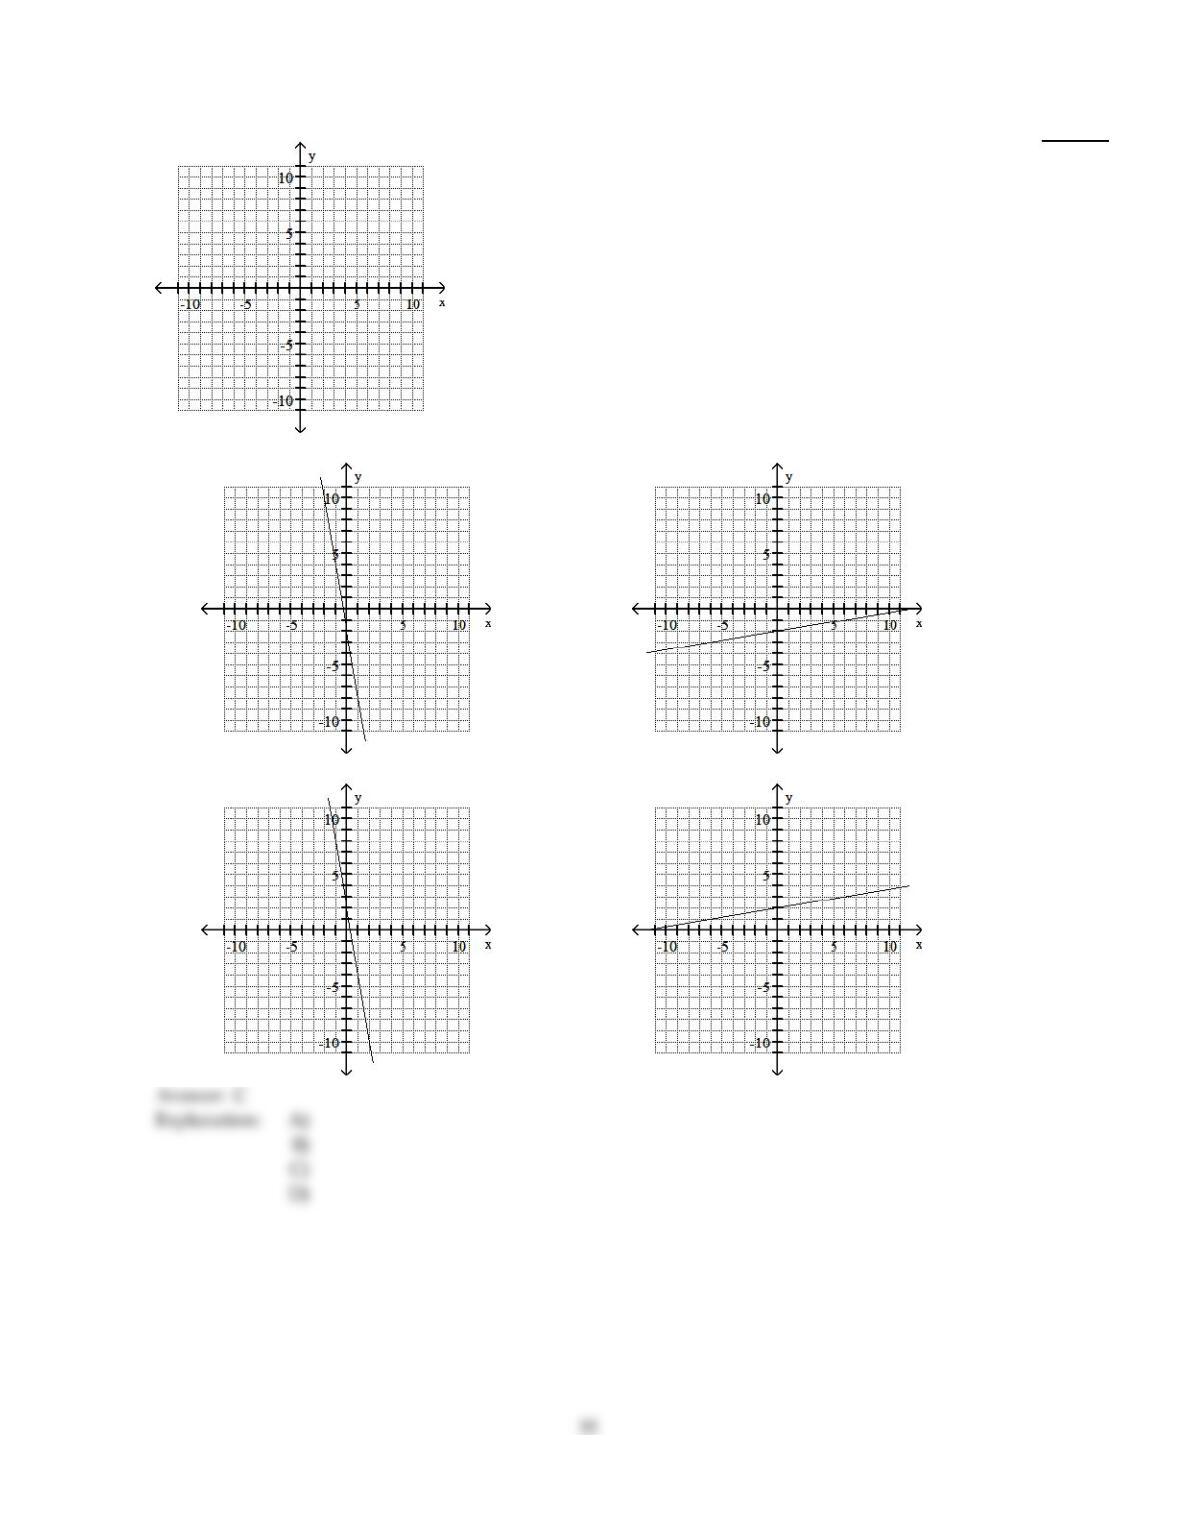
Graph the line through the given point with the given slope.
65)
(0, 2), m = – 6
65)
A)
B)
C)
D)
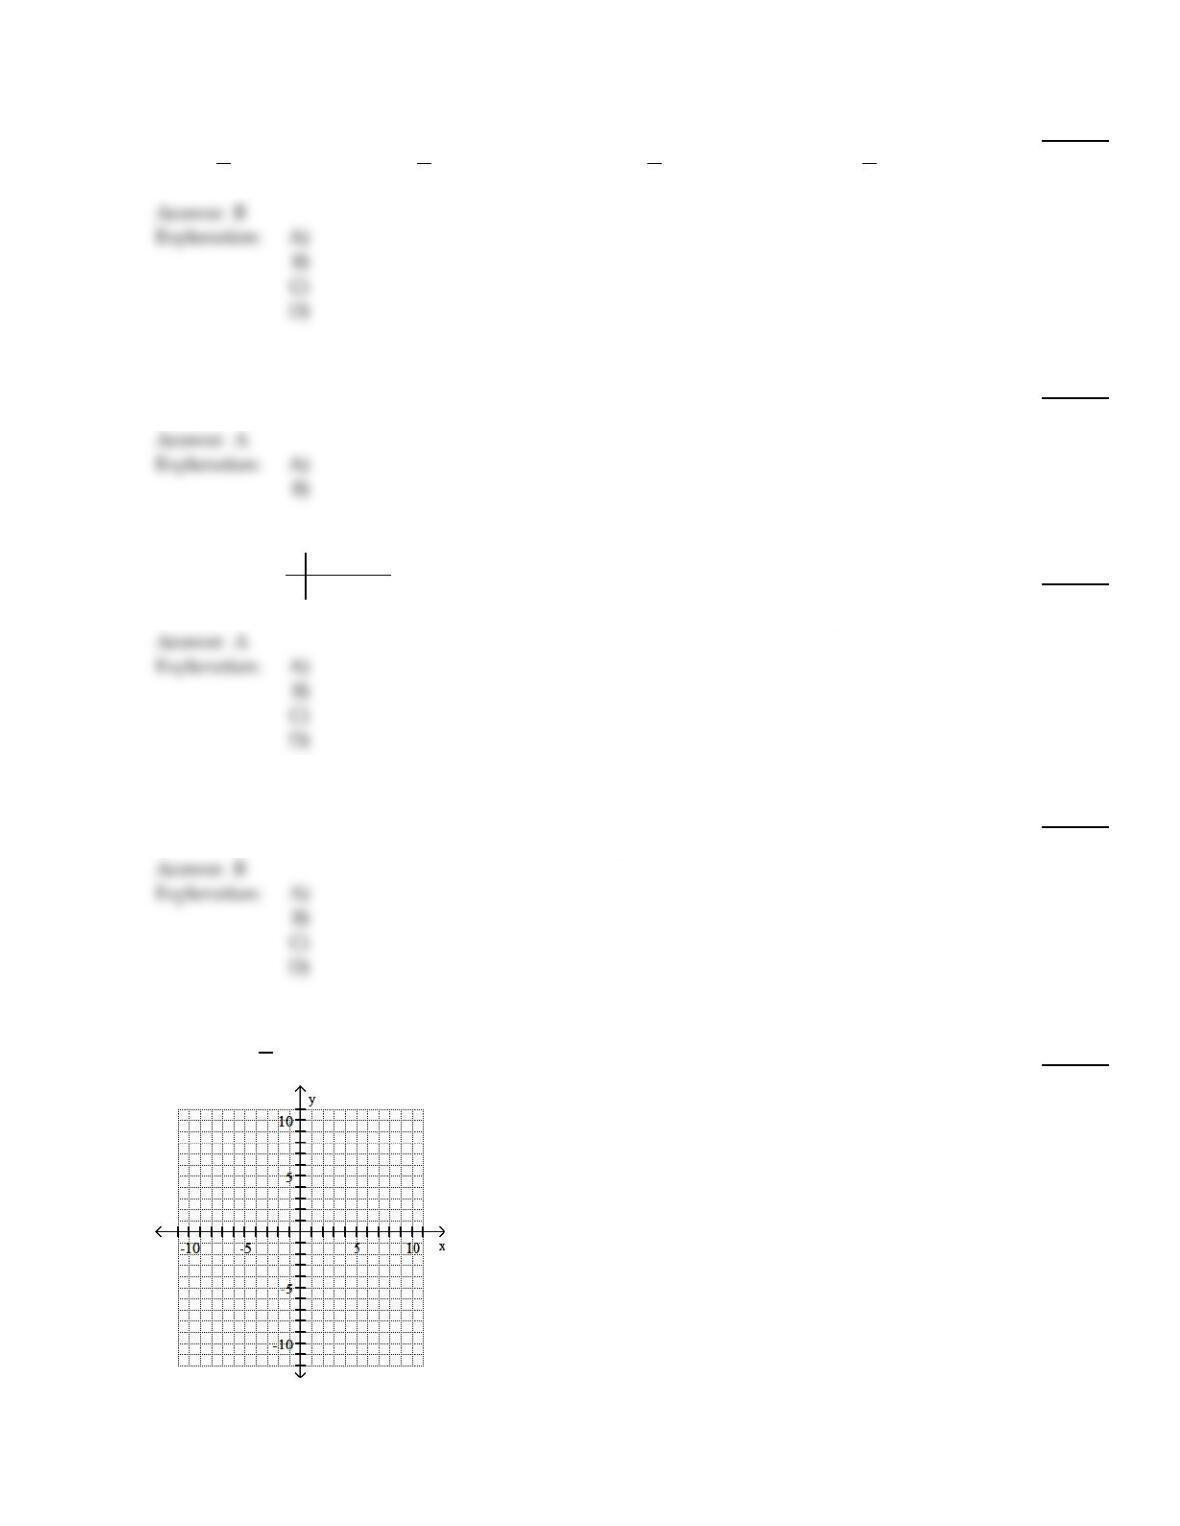
Find the slope of the line.
66)
3x – 2y =9
66)
A)
–2
3
B)
3
2
C)
–9
2
D)
–3
2
Answer the question.
67)
True or False: The graph of the equation 6x –10y =20 goes through (15, 7).
67)
A)
True
B)
False
Complete the table of values for the given equation.
68)
5x + y = – 24 x–6 0 1
y
68)
A)
6; –24; –29
B)
–6; –24; –29
C)
6; 0; –29
D)
6; –36; –29
Find the slope of the line.
69)
A line parallel to the graph of y –4=6
69)
A)
Undefined
B)
0
C)
4
D)
6
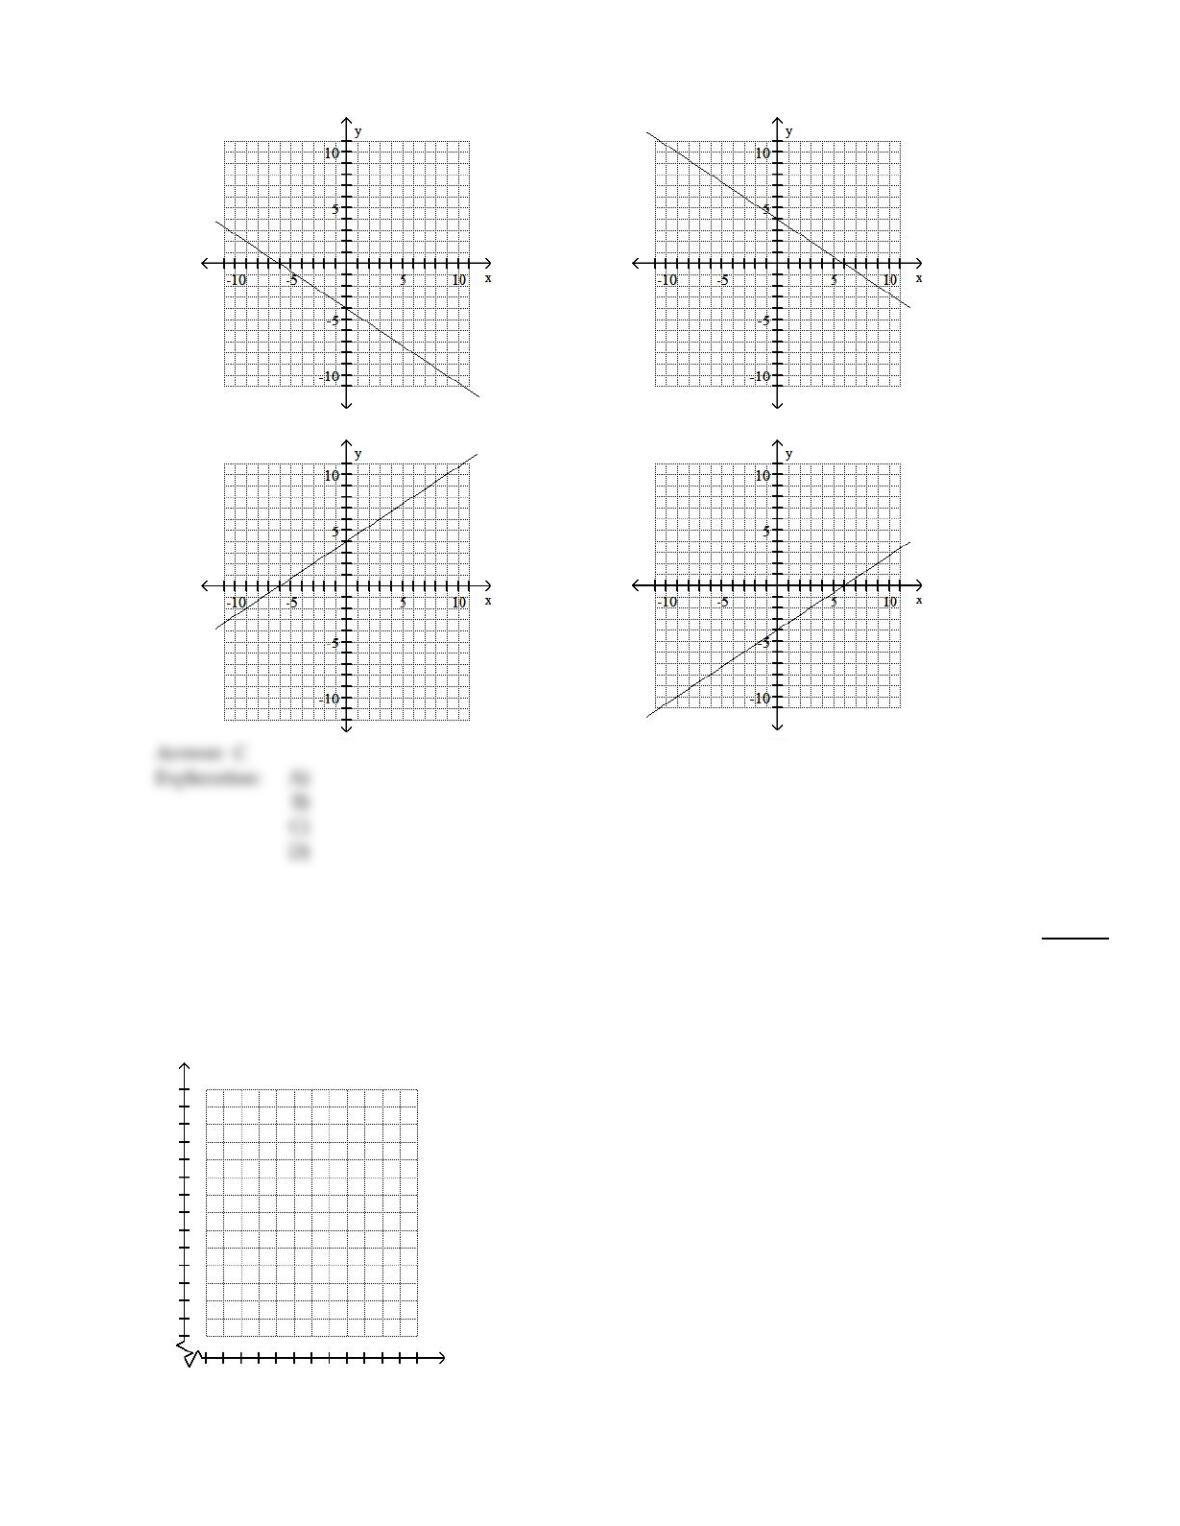
Graph the line through the given point with the given slope.
70)
(–6, 0) , m =2
3
70)
36
A)
B)
C)
D)
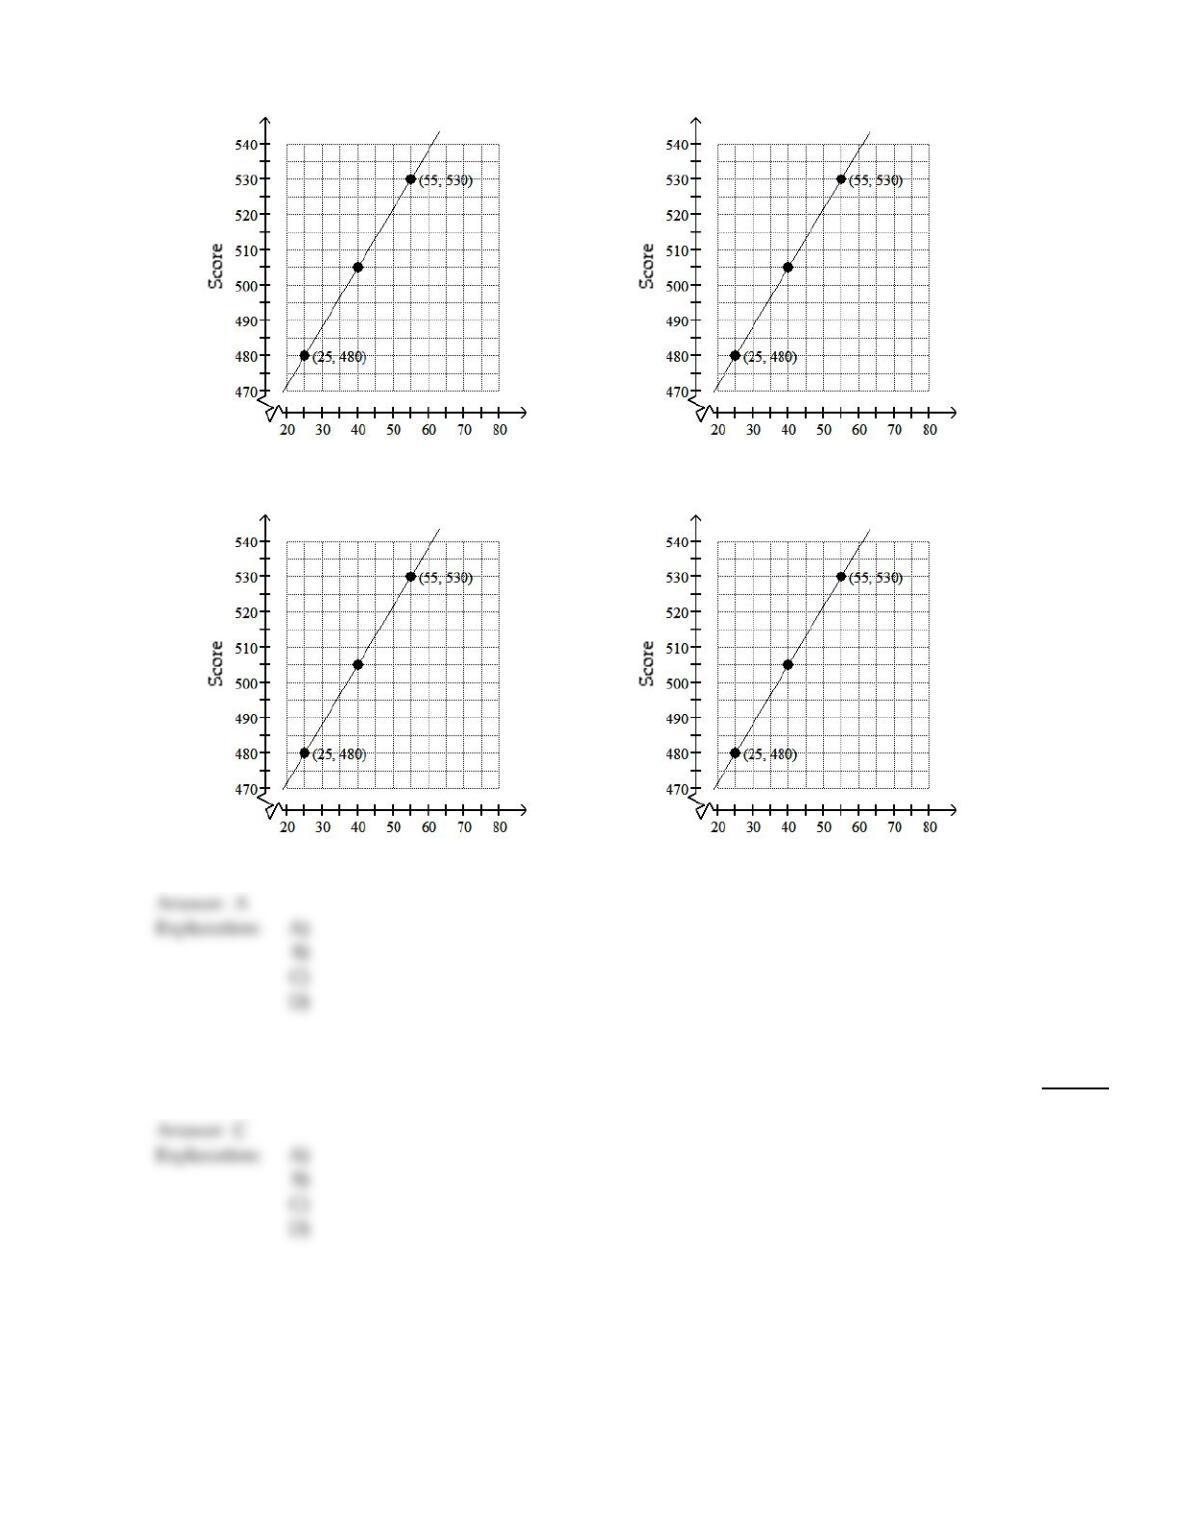
Solve by graphing. Label the axes and show where the solution is located on the graph.
71)
The graph depicts a relationship between scores achieved on an unspecified standardized test and
family income. Suppose the score for a test is 480 when the family income is $25,000 and is 530
when the family income is $55,000. Let x be the income and y be the score of the test. Graph the two
given pairs of incomes and scores. Assume that the relationship is linear. Draw a line though the
two previous points. From your graph, estimates the score if the family income is $40,000.
71)
37
A)
Income (in $1000’s)
505
B)
Income (in $1000’s)
580
C)
Income (in $1000’s)
530
D)
Income (in $1000’s)
555
Complete the ordered pair for the given equation.
72)
y = – x + 1 (–1, )
72)
A)
(–1, –3)
B)
(–1, –2)
C)
(–1, 2)
D)
(–1, 3)
38
Decide whether or not the ordered pair is a solution to the equation.
73)
5x – 4y =40; (4, 5)
73)
A)
No
B)
Yes
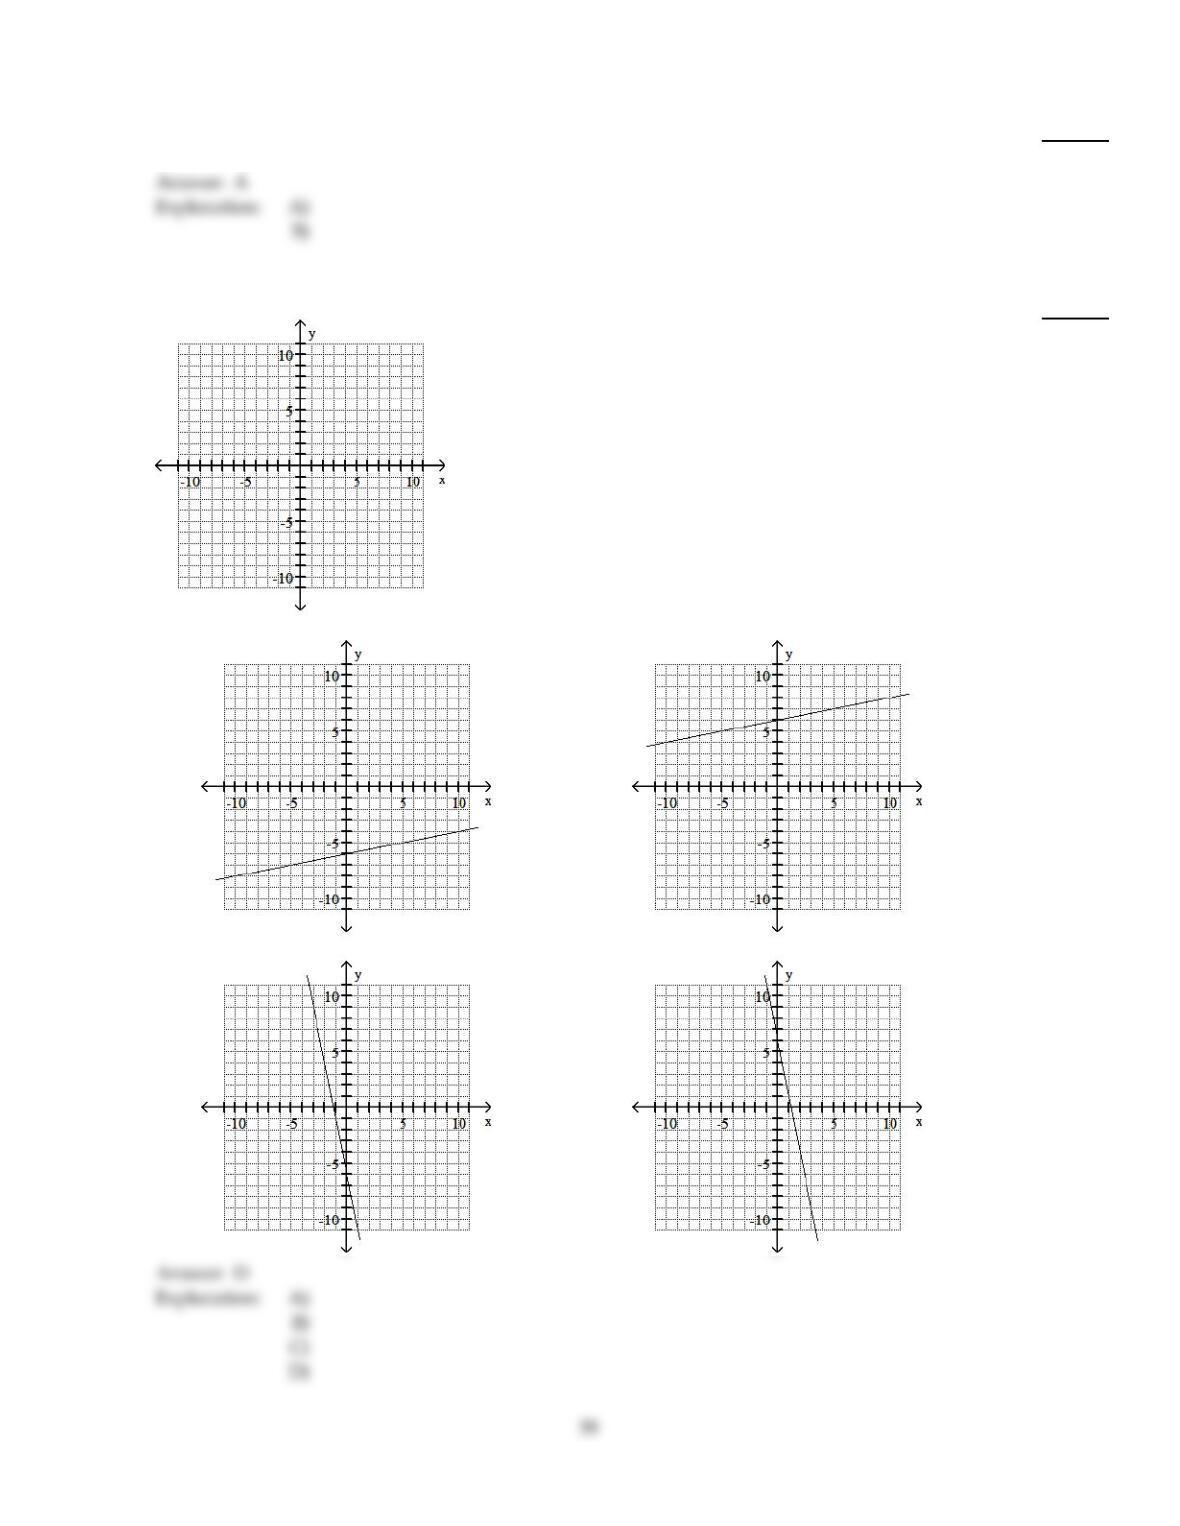
Graph the line through the given point with the given slope.
74)
(0, 6), m = – 5
74)
A)
B)
C)
D)
Answer the question.
75)
True or False: An equation of the type y = k (k is a constant) produces a line parallel to the x–axis.
75)
A)
True
B)
False
Write an equation of the line through the given point with the given slope. Write the equation in slope–intercept form.
76)
(3, 5); m = – 8
76)
A)
y = – 1
8x +29
B)
y = – 8x –29
C)
y = – 8x +29
D)
y = – 8x +1
29
C
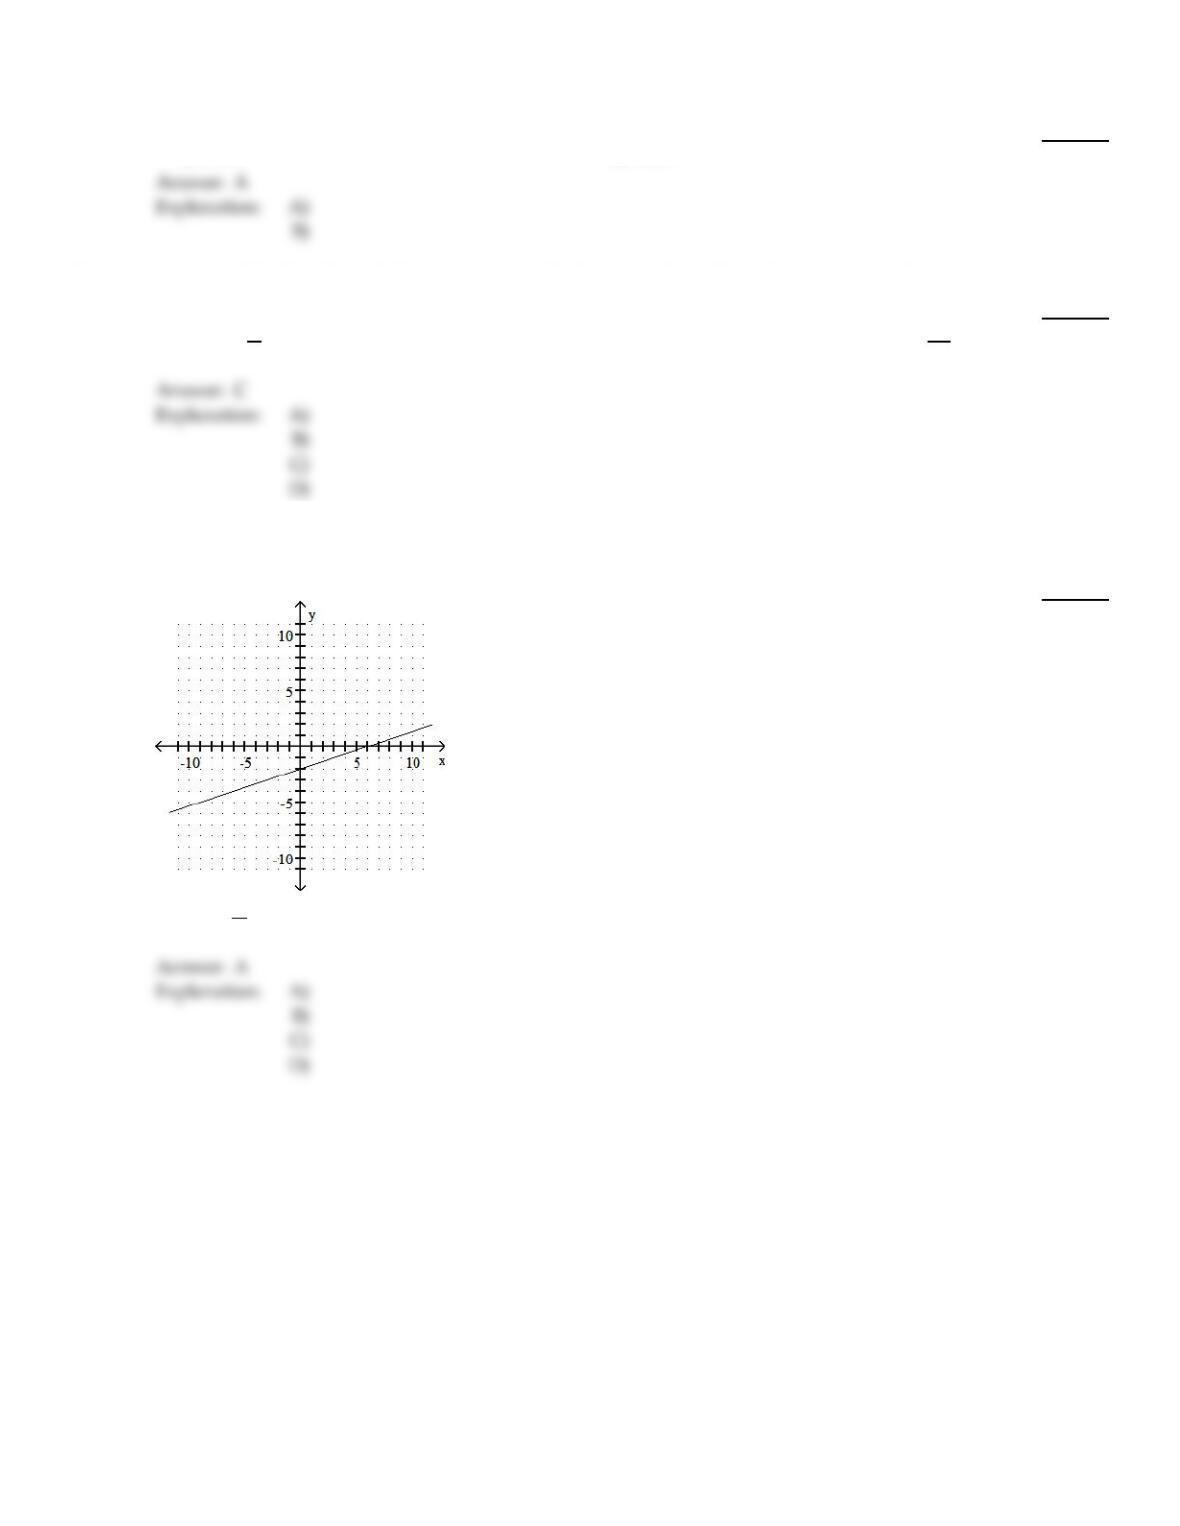
Use the geometric interpretation of slope (rise divided by run) to find the slope of the line. Then, by identifying the
y–intercept from the graph, write the slope–intercept form of the equation of the line.
77)
77)
A)
y =1
3x – 2
B)
y = – 6x – 2
C)
y =3x + 6
D)
y =6x – 2
A
Graph the equation by using the slope and y–intercept.
40
A