18) If the quantity of a product demanded is greater than the quantity of a product supplied, there
is pressure in the market to push the price downward.
19) Governments sometime create an excess demand for a product by setting a maximum price
that is less than the equilibrium price, resulting in a permanent excess demand for the product.
This is known as a price floor.
20) Excess demand in an unregulated market will cause the price of a product to fall.
21) Excess supply in an unregulated market will cause the price of a product to fall.
22) Governments sometime create an excess supply of a product by setting a minimum price that
is greater than the equilibrium price, resulting in a permanent excess supply of the product. This
is known as a price ceiling.
3.4 Market Effects of Changes in Demand
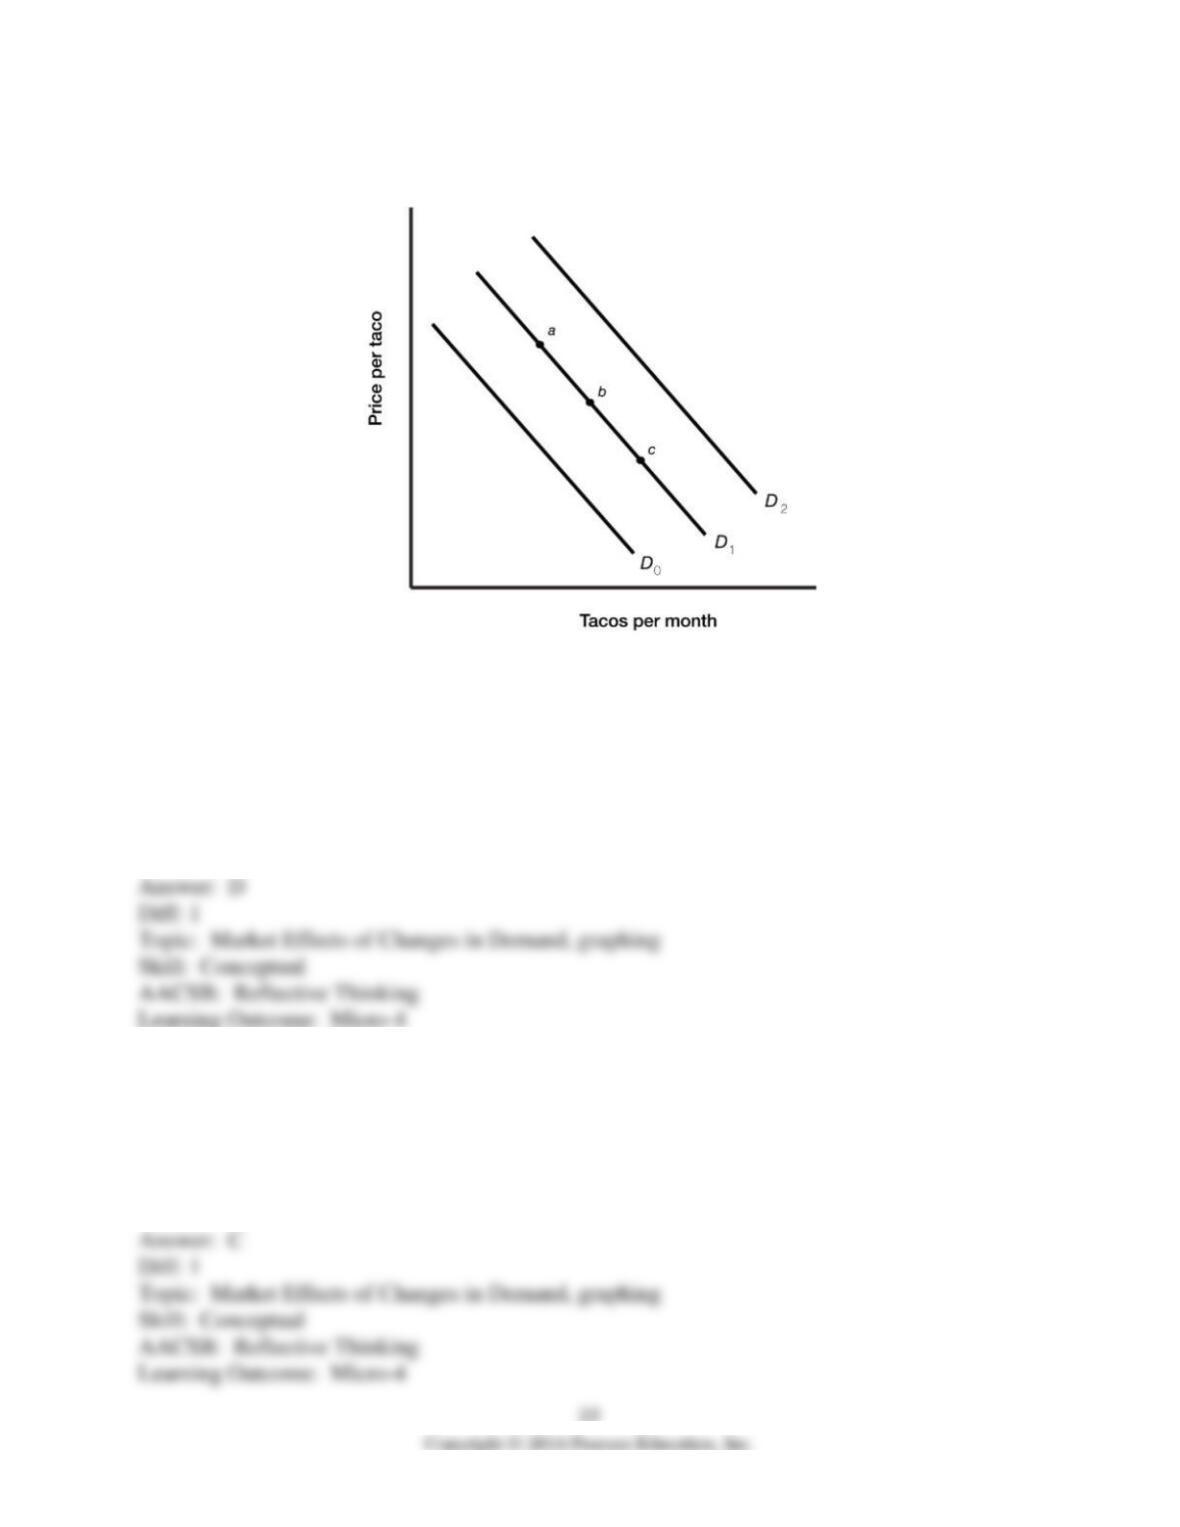
Figure 3.3
1) Figure 3.3 illustrates the demand for tacos. An increase in the demand for tacos is represented
by the movement from
A) point a to point b.
B) point c to point b.
C) D2 to D1.
D) D0 to D1.
2) Figure 3.3 illustrates the demand for tacos. A decrease in the demand for tacos is represented
by the movement from
A) point a to point b.
B) point c to point b.
C) D2 to D1.
D) D0 to D1.
3) Figure 3.3 illustrates the demand for tacos. Assume tacos are a normal good. An increase in
income would bring about a movement from
A) point a to point b.
B) point c to point b.
C) D2 to D1.
D) D0 to D1.
4) Figure 3.3 illustrates the demand for tacos. Assume tacos are an inferior good. An increase in
income would bring about a movement from
A) point a to point b.
B) point c to point b.
C) D2 to D1.
D) D0 to D1.
5) Figure 3.3 illustrates the demand for tacos. Assume that tacos and beer are complements. An
increase in the price of beer would bring about a movement from
A) point a to point b.
B) point c to point b.
C) D2 to D1.
D) D0 to D2.
6) Figure 3.3 illustrates the demand for tacos. Assume that tacos and beer are complements. A
decrease in the price of beer would bring about a movement from
A) point a to point c.
B) point c to point a.
C) D2 to D0.
D) D0 to D2.
7) Figure 3.3 illustrates the demand for tacos. Assume that tacos and burritos are substitutes. A
decrease in the price of burritos would bring about a movement from
A) point a to point c.
B) point c to point b.
C) D2 to D0.
D) D1 to D2.
8) Figure 3.3 illustrates the demand for tacos. An increase in the number of consumers in the
market would bring about a movement from
A) point a to point b.
B) point c to point a.
C) D2 to D1.
D) D0 to D2.
9) Figure 3.3 illustrates the demand for tacos. An increase in price of tacos would bring about a
movement from
A) point a to point c.
B) point c to point a.
C) D2 to D0.
D) D0 to D1.
10) Figure 3.3 illustrates the demand for tacos. A decrease in price of tacos would bring about a
movement from
A) point a to point c.
B) point c to point a.
C) D2 to D0.
D) D0 to D2.
11) Figure 3.3 illustrates the demand for tacos. A successful advertising campaign to sell tacos
would bring about a movement from
A) point a to point b.
B) point c to point b.
C) D2 to D1.
D) D0 to D1.
12) Figure 3.3 illustrates the demand for tacos. If people expect the price of tacos to decrease in
the near future, this would most likely bring about a movement from
A) point a to point b.
B) point c to point a.
C) D2 to D0.
D) D0 to D1.
13) When the price of apples goes up
A) the demand for apples will decrease, ceteris paribus.
B) the demand for apples will increase, ceteris paribus.
C) the quantity of apples demanded will decrease, ceteris paribus.
D) the quantity of apples demanded will increase, ceteris paribus.
14) When the price of almonds falls
A) the demand for almonds decreases, ceteris paribus.
B) the demand for almonds increases, ceteris paribus.
C) the quantity of almonds demanded decreases, ceteris paribus.
D) the quantity of almonds demanded increases, ceteris paribus.
15) Landon demands more sushi as his income increases. From this we can conclude that, for
Landon,
A) sushi is a normal good.
B) sushi is an inferior good.
C) sushi is a complementary good.
D) sushi is a substitute good.
16) Assume that coffee and tea are substitutes. When the price of coffee increases
A) the demand for tea decreases.
B) the demand for tea increases.
C) the supply of tea increases.
D) the supply of tea decreases.
17) Suppose that a product benefits from a successful advertising campaign. The result is that
A) the demand for the product increases.
B) the demand for the product decreases.
C) the supply of the product increases.
D) the supply of the product decreases.
18) Suppose that consumers expect that the price of a product will increase in the future. The
result is that
A) the current demand for the product increases.
B) the current demand for the product decreases.
C) the current supply of the product increases.
D) the current supply of the product decreases.
19) Assume that tortilla chips and salsa are complements. When the price of tortilla chips
decreases
A) the demand for salsa increases.
B) the demand for salsa decreases.
C) the supply of salsa decreases.
D) the demand for tortilla chips decreases.
20) If the population increases, the market demand for most products will
A) not change.
B) decrease.
C) increase.
D) depend on supply.
21) Suppose that in October the price of a cup of cafe latte was $2.50 and 400 lattes were
consumed. In November the price of a latte was $2.00 and 300 lattes were consumed. What
might have caused this change?
A) The price of tea (a substitute for cafe lattes) fell.
B) The price of tea (a substitute for cafe lattes) rose.
C) The price of coffee beans (an input of production of cafe lattes) rose.
D) The price of coffee beans (an input of production of cafe lattes) fell.
22) If demand for a product increases, ceteris paribus, the equilibrium
A) price increases.
B) price decreases.
C) price remains unchanged.
D) quantity decreases.
23) A good for which demand decreases when income decreases is known as a(n) ________
good.
A) normal
B) inferior
C) complementary
D) substitute
24) If the demand for one good decreases when the price of another good decreases, the two
goods are ________ goods.
A) normal
B) inferior
C) complementary
D) substitute
25) If the demand for one good decreases when the price of another good increases, the two
goods are ________ goods.
A) normal
B) inferior
C) complementary
D) substitute
26) Suppose that consumers expect the price of a product to decrease in the future. The result is
that
A) the current demand for the product increases.
B) the current demand for the product decreases.
C) the current supply of the product increases.
D) the current supply of the product decreases.
27) A good for which demand decreases when income increases is known as a(n) ________
good.
A) normal
B) inferior
C) complementary
D) substitute
28) Suppose that in 2011, 4 million plasma TVs were purchased at $950 each, while in 2012, 3
million plasma TVs were purchased at $800 each. What might have caused this change?
A) The price of LCD TVs (a substitute for plasma TVs) fell.
B) The price of LCD TVs (a substitute for plasma TVs) rose.
C) Plasma TV manufacturing technology increased.
D) Plasma TV manufacturing technology decreased.
29) If the equilibrium price of a good decreases and the equilibrium quantity of the good
decreases, we can conclude that
A) demand increased.
B) demand decreased.
C) supply increased.
D) supply decreased.
Recall the Application about the increase in Chinese demand for pecans to answer the
following question(s). Between 2006 and 2009, Chinese imports of U.S. pecans increased
from 9 million pounds per year to 88 million pounds per year, and as a result of the
increase in demand, the equilibrium price increased by about 50%. The increase in
demand was caused in part by widespread reports in the Chinese media extolling the
health benefits of pecans.
30) Recall the Application. The equilibrium price of pecans increased because the demand curve
shifted
A) up and to the right.
B) down and to the left.
C) down and to the right.
D) up and to the left.
31) Recall the application. One reason for the increase in Chinese demand for pecans was
A) a decrease in income.
B) the expectation of higher future prices.
C) an increase in consumer preferences.
D) an increase in the price of walnuts, a substitute good.
32) Recall the Application. Between 2006 and 2009, Chinese demand for pecans increased by
roughly ________%.
A) 79
B) 90
C) 456
D) 877
33) Recall the Application. If consumer income in China increased and as a result the demand
for pecans decreased, this would indicate that in China, pecans would be considered ________
goods.
A) normal
B) inferior
C) substitute
D) complementary
34) Two goods are complements if an increase in the price of one good leads to an increase in
demand for the other.
35) People will buy more of an inferior good when their income decreases.
36) Two goods are substitutes if an increase in the price of one good leads to a decrease in
demand for the other.
37) An increase in demand will cause the equilibrium price and quantity to rise, ceteris paribus.
38) If consumer preference for a product increases, this will cause the equilibrium price of the
product to go down, and the equilibrium quantity of the product to go up.
39) People will buy more of a normal good when their income decreases.
40) A decrease in population would shift the demand curve to the left.
41) A decrease in demand will cause the equilibrium price and quantity of a good to fall, ceteris
paribus.
42) Explain the difference between a change in quantity demanded and a change in demand.
43) Describe the changes in the variables that will cause demand for a product to increase,
shifting the demand curve to the right.
44) Describe the changes in the variables that will cause demand for a product to decrease,
shifting the demand curve to the left.
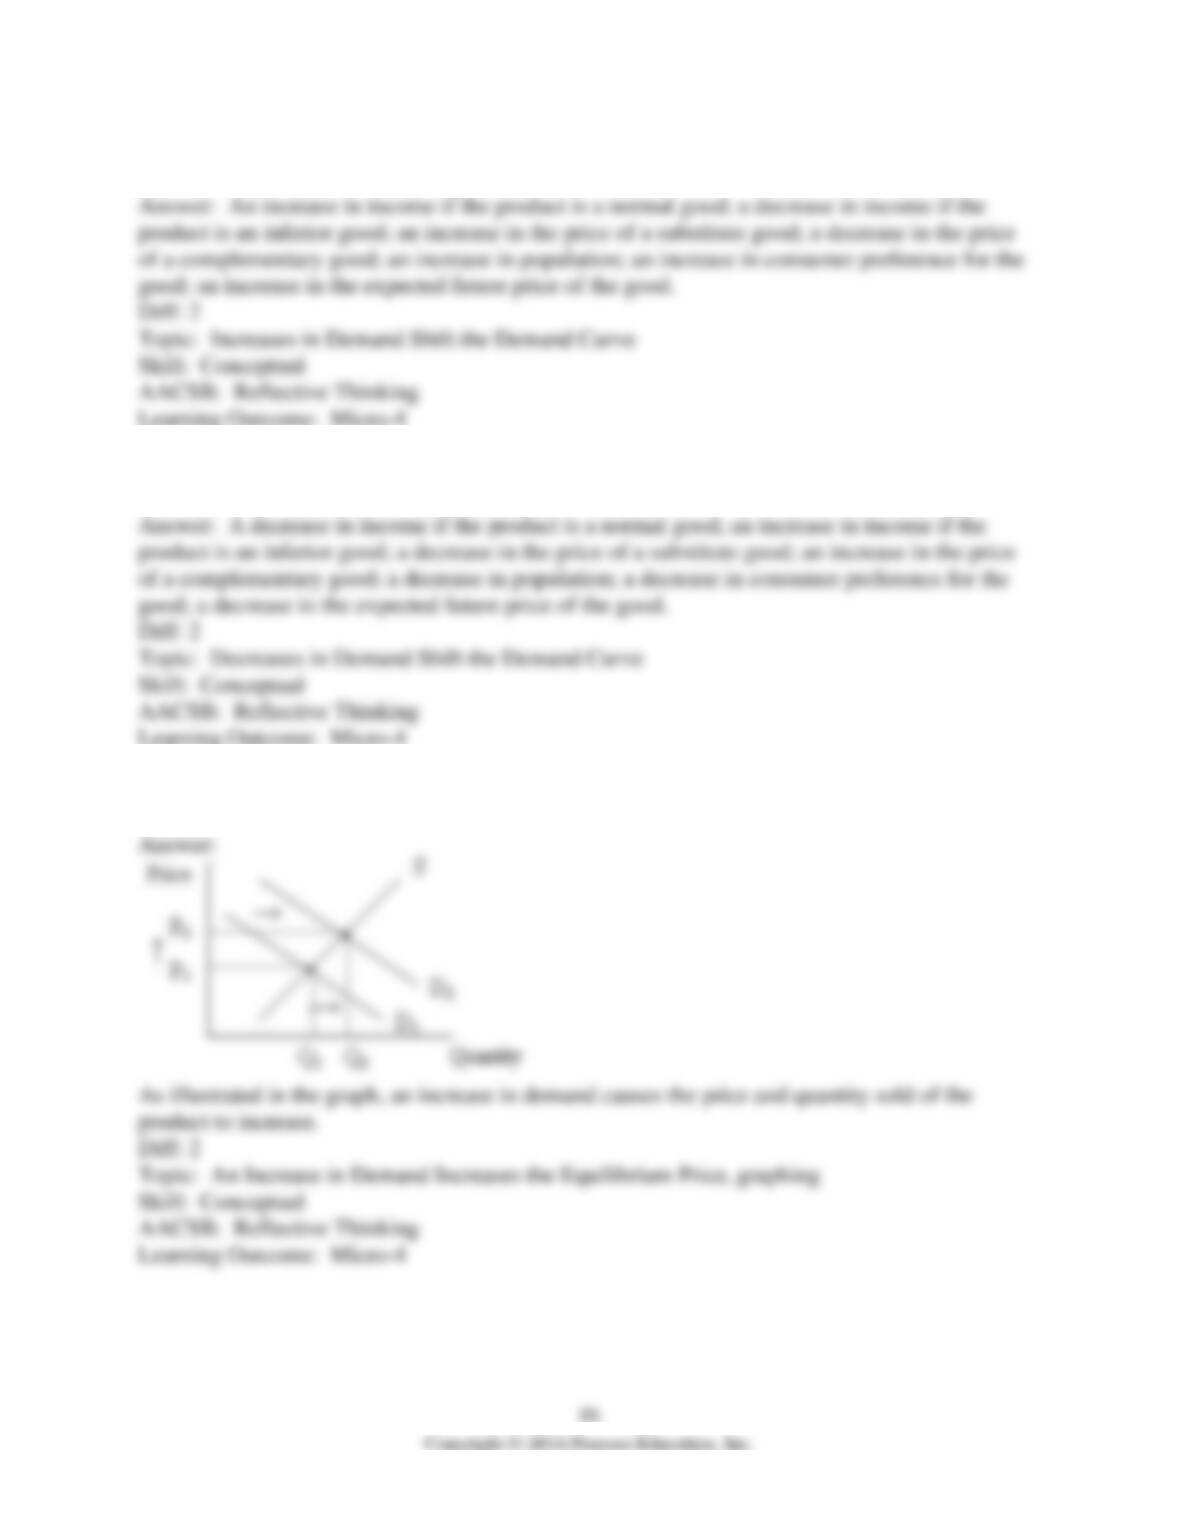
45) Draw a graph to illustrate the effect of an increase in demand on the price and quantity in a
market.
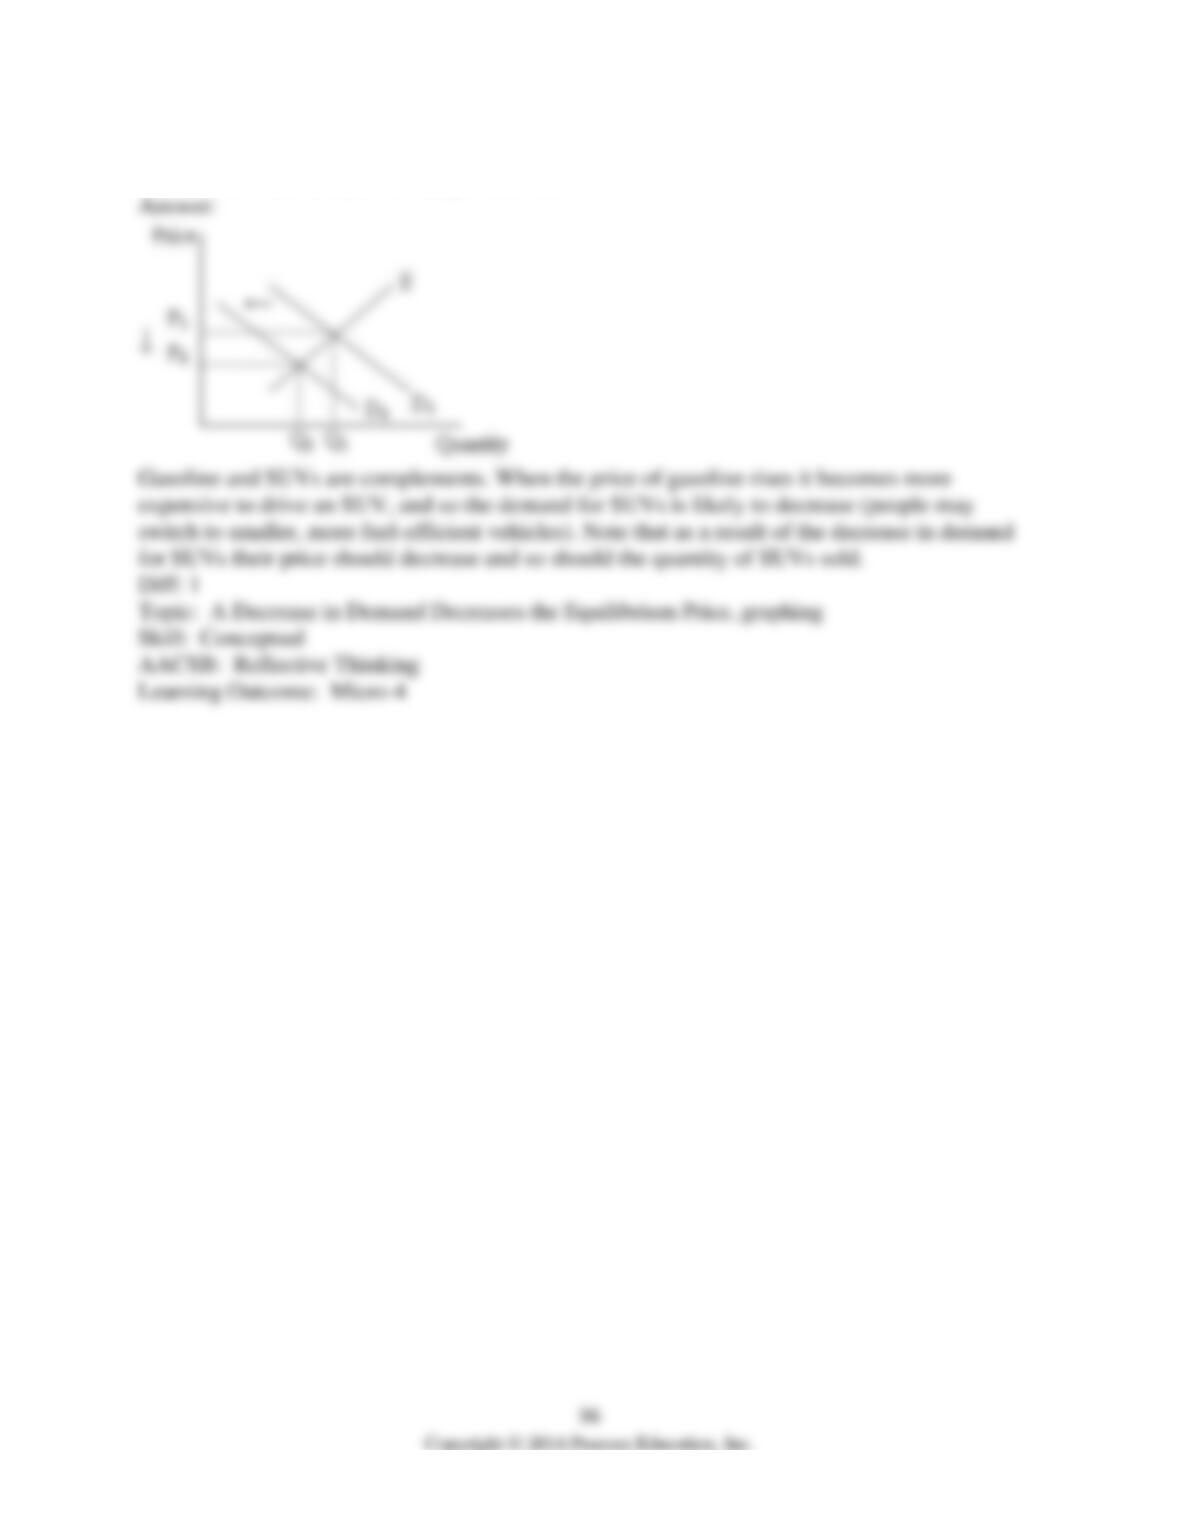
46) Draw a graph to illustrate the effect of higher gasoline prices on the demand for large SUVs.
What is the relationship between gasoline and SUVs?
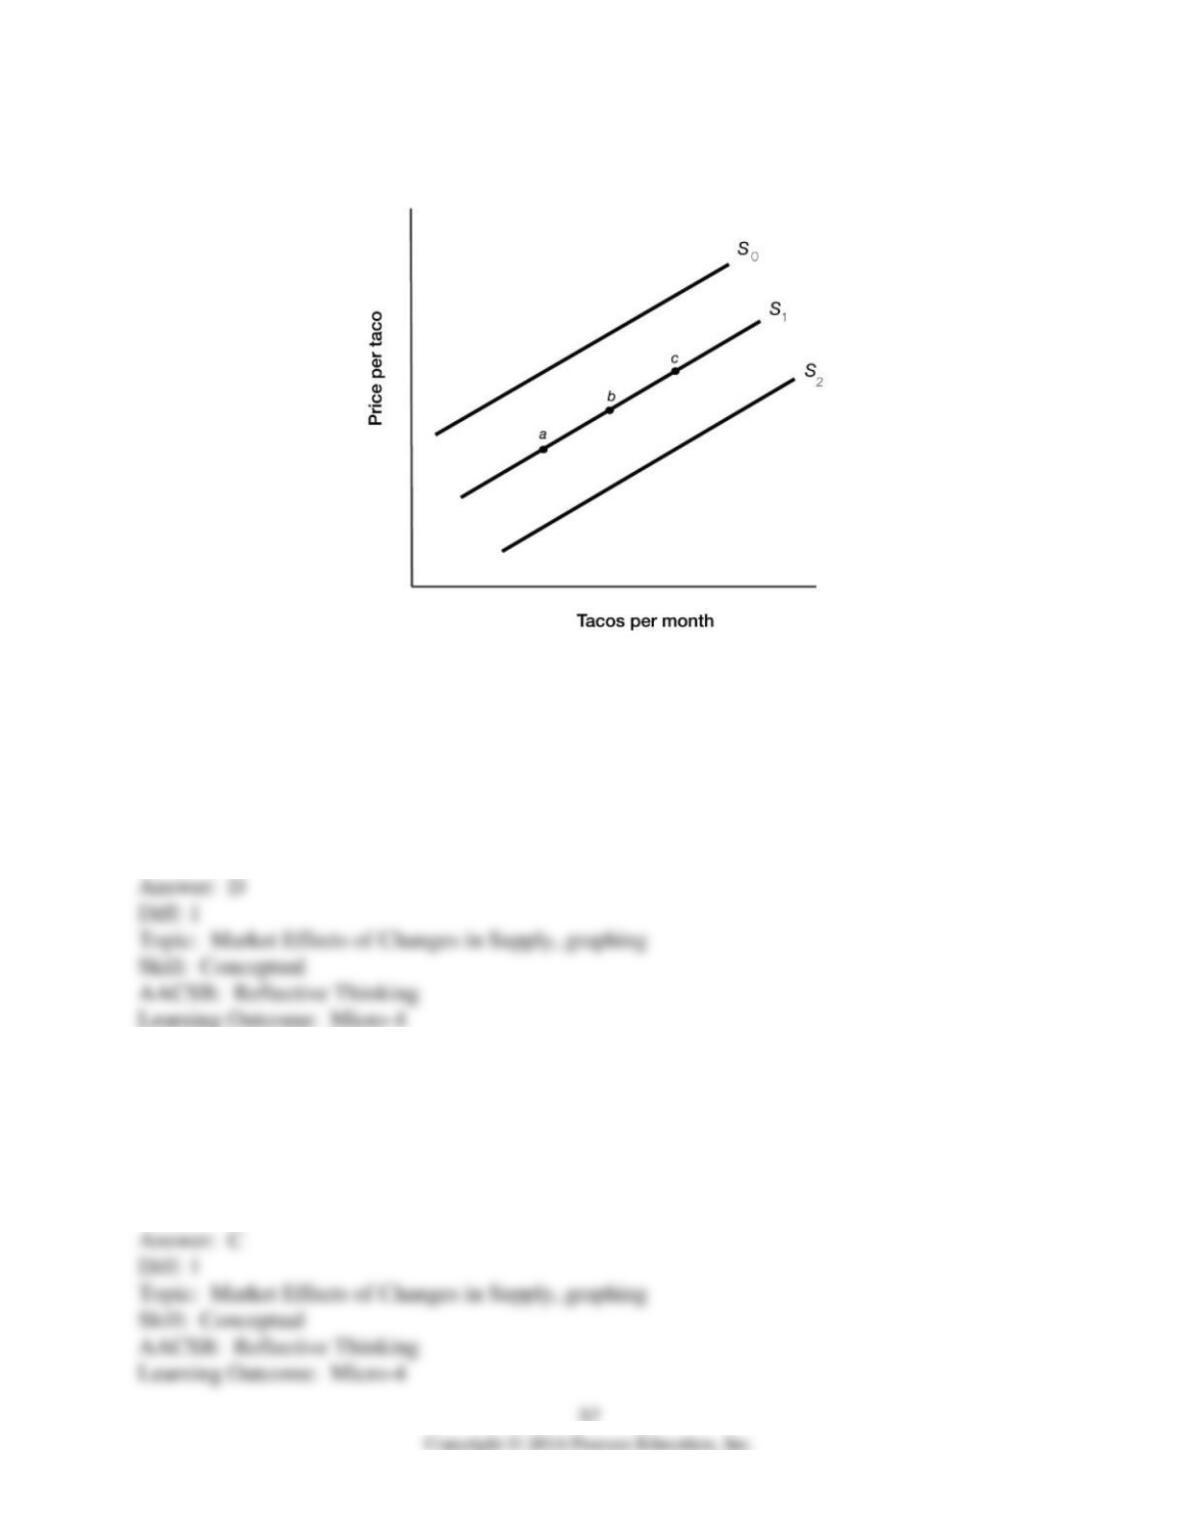
3.5 Market Effects of Changes in Supply
Figure 3.4
1) Figure 3.4 illustrates the supply of tacos. An increase in the supply of tacos is represented by a
movement from
A) point a to point b.
B) point c to point b.
C) S2 to S1.
D) S0 to S1.
2) Figure 3.4 illustrates the supply of tacos. A decrease in the supply of tacos is represented by a
movement from
A) point a to point b.
B) point c to point b.
C) S2 to S1.
D) S0 to S1.
3) Figure 3.4 illustrates the supply of tacos. An increase in the price of ground beef, which is
used to make tacos, would most likely cause a movement from
A) point a to point b.
B) point c to point b.
C) S2 to S1.
D) S0 to S1.
4) Figure 3.4 illustrates the supply of tacos. A technological advancement which makes tacos
cheaper to produce would most likely cause a movement from
A) point a to point c.
B) point c to point a.
C) S2 to S0.
D) S0 to S2.
5) Figure 3.4 illustrates the supply of tacos. An increase in the number of Mexican food
producers would most likely cause a movement from
A) point a to point c.
B) point c to point a.
C) S2 to S0.
D) S0 to S2.
6) Figure 3.4 illustrates the supply of tacos. If the government offered a subsidy to Mexican
restaurants for each taco they produce, this would most likely cause a movement from
A) point a to point c.
B) point c to point b.
C) S2 to S1.
D) S0 to S1.
7) The price of pineapples has risen dramatically. Which of the following is likely to happen?
A) The quantity of pineapples supplied will increase.
B) The quantity of pineapples supplied will decrease.
C) The supply of pineapples will decrease.
D) The supply of pineapples will increase.
8) The price of iPhones has fallen dramatically. Which of the following is likely to happen?
A) The quantity of iPhones supplied will decrease.
B) The quantity of iPhones supplied will increase.
C) The supply of iPhones will decrease.
D) The supply of iPhones will increase.