Exam
Name___________________________________
MULTIPLE CHOICE. Choose the one alternative that best completes the statement or answers the question.
Use the Leading Coefficient Test to determine the end behavior of the polynomial function. Then use this end behavior
to match the function with its graph.
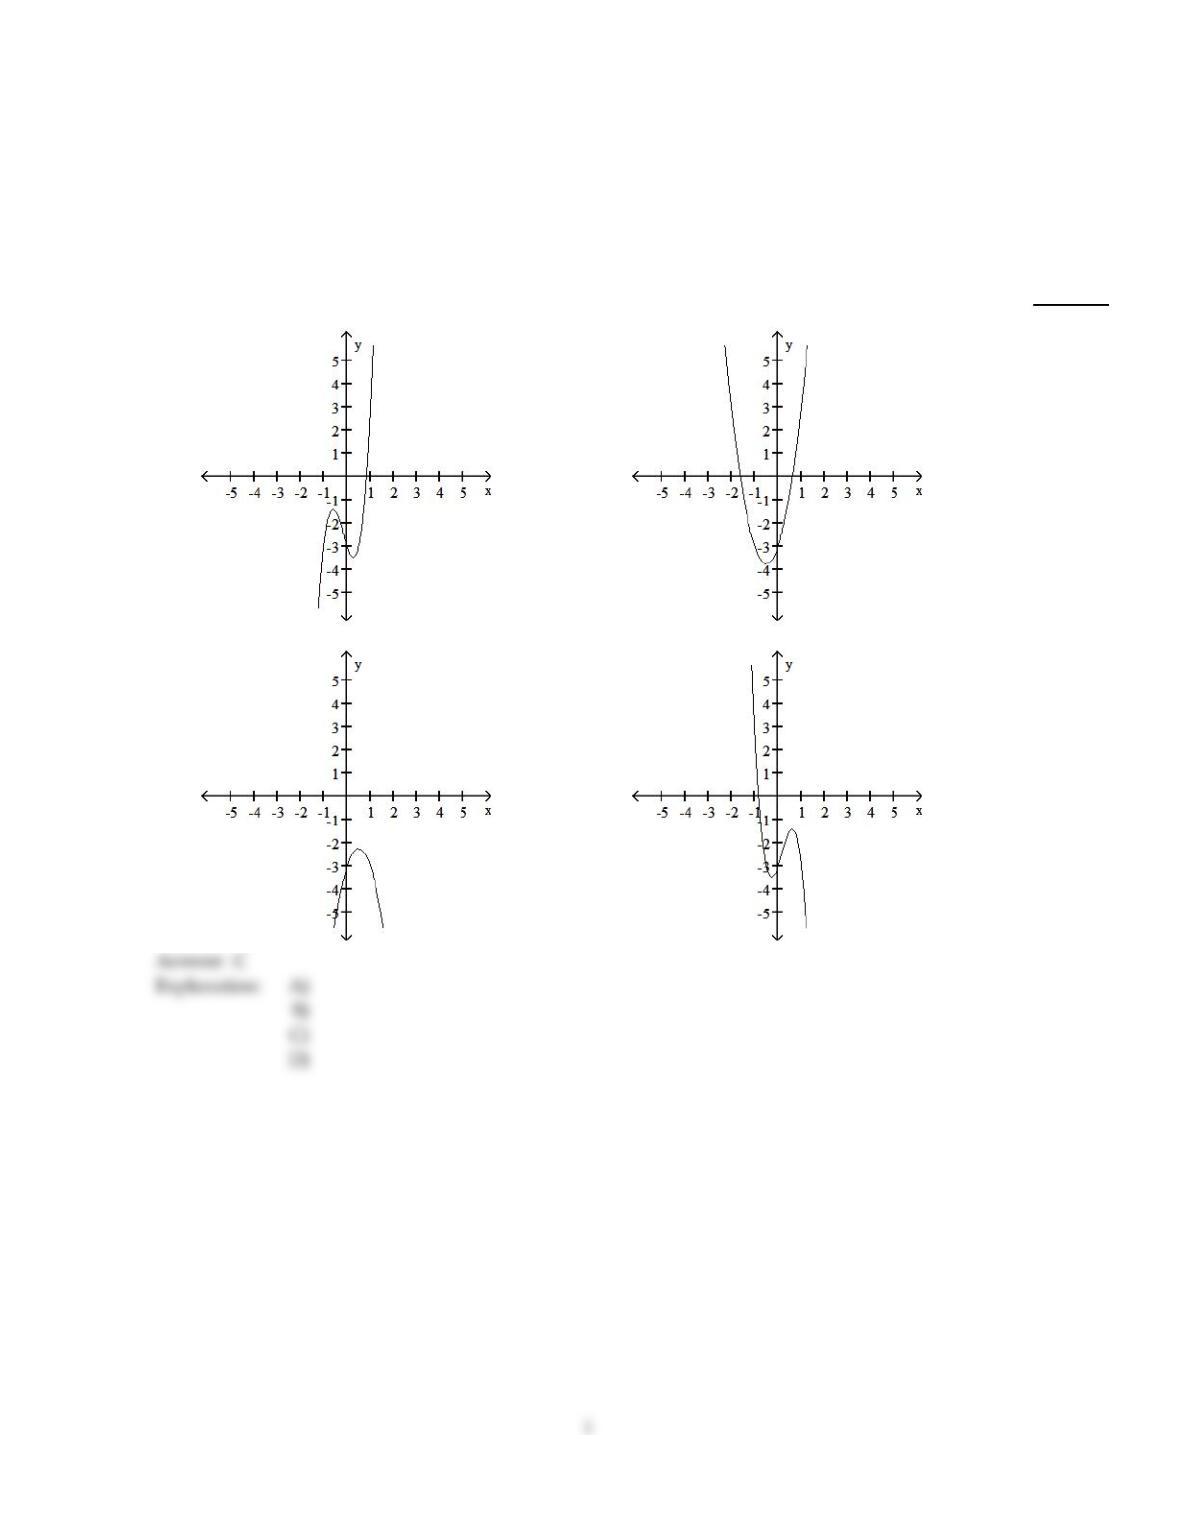
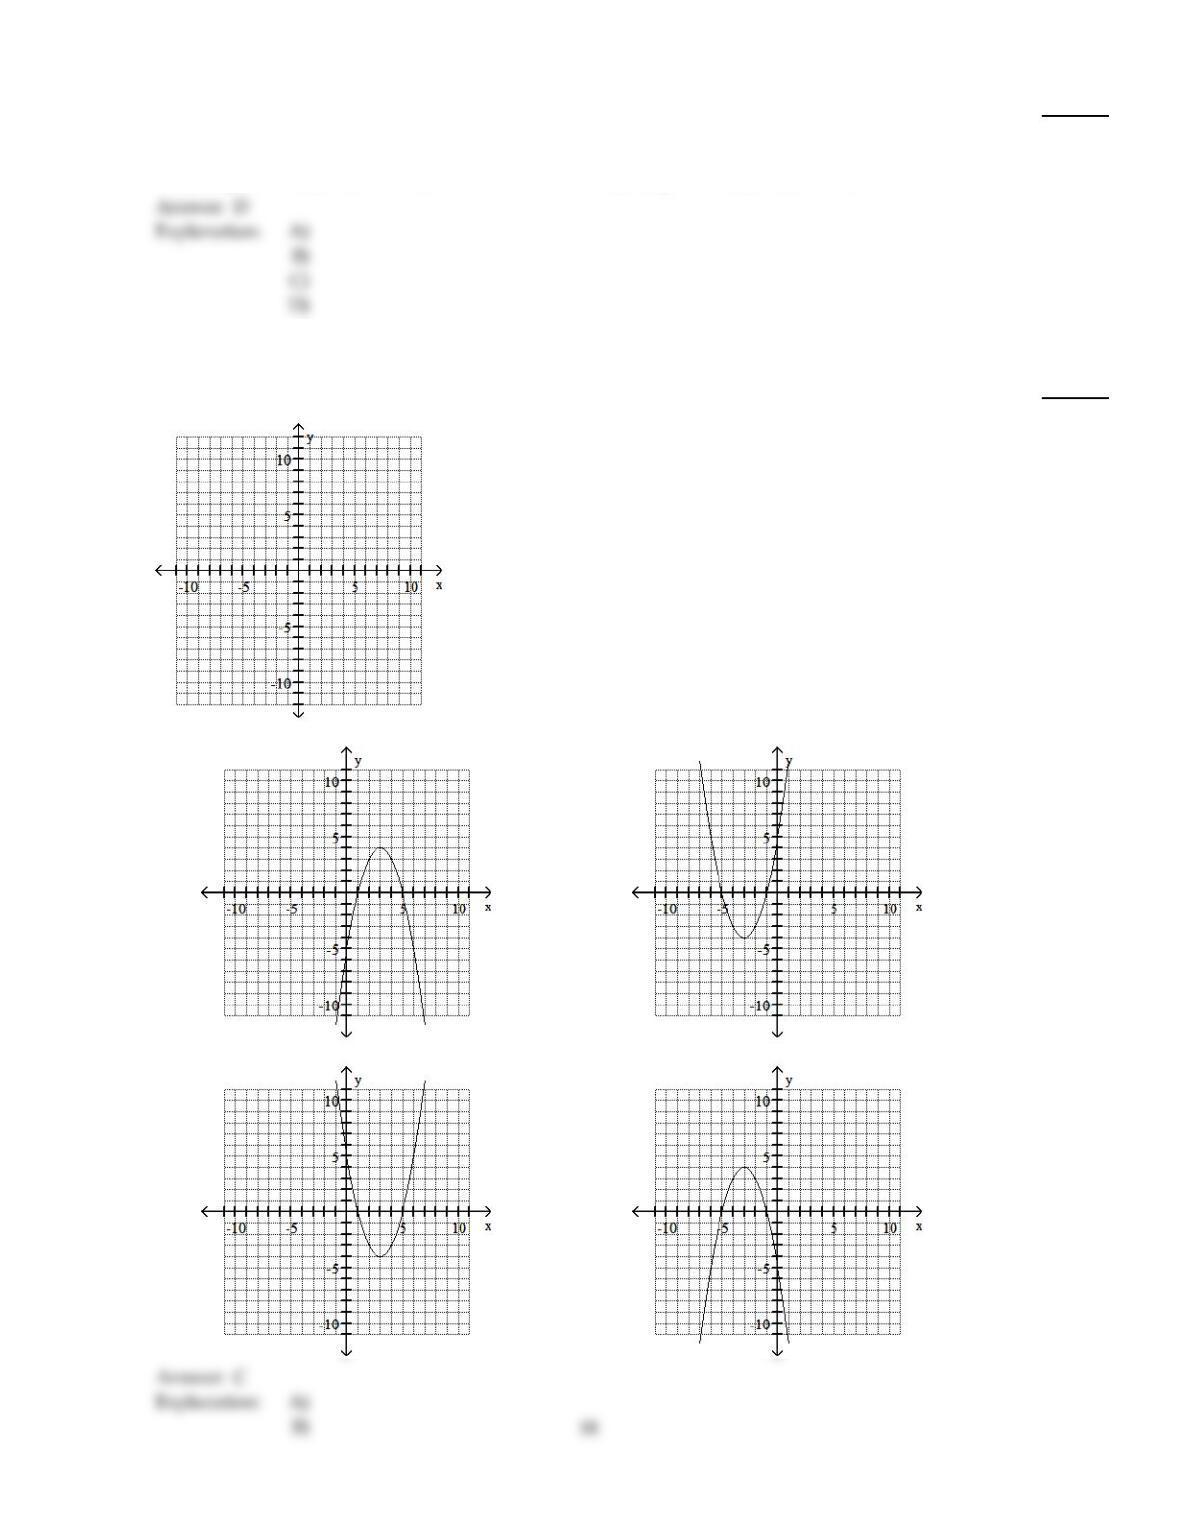
1)
f(x) = – 3x2+ 3x – 3
1)
A)
falls to the left and rises to the right
B)
rises to the left and rises to the right
C)
falls to the left and falls to the right
D)
rises to the left and falls to the right
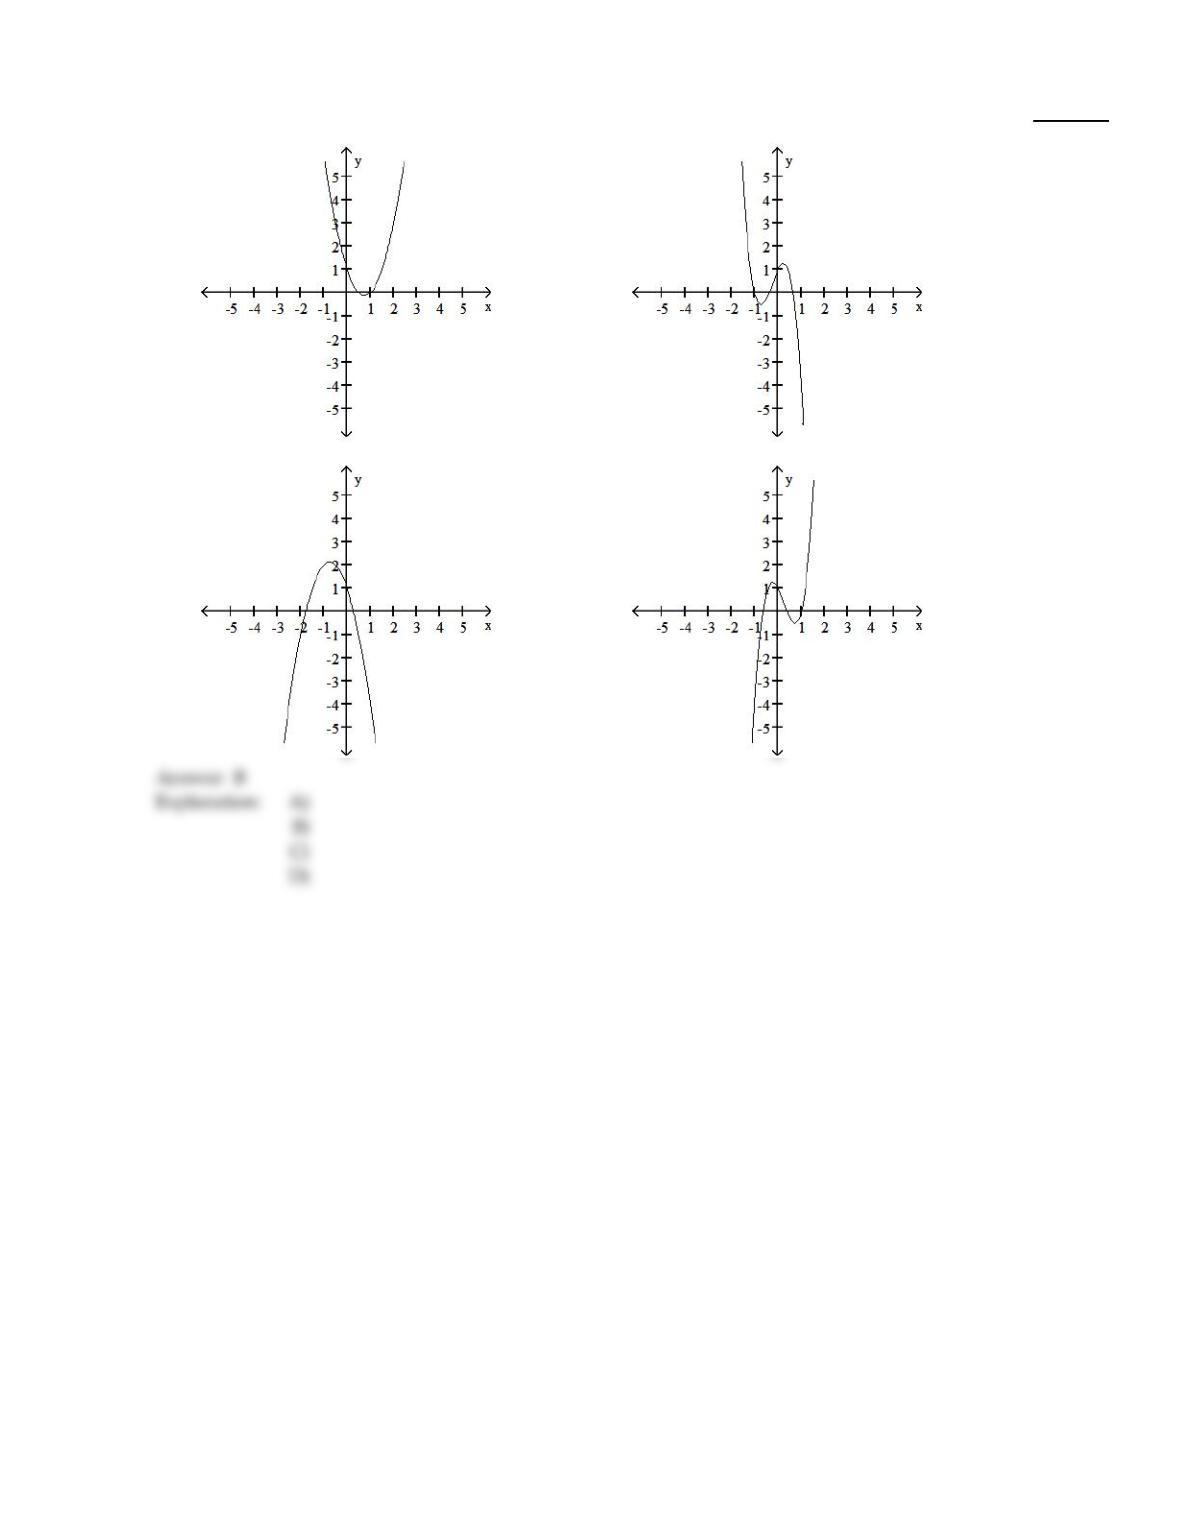
2)
f(x) = – 4x3– 3x2+ 2x + 1
2)
A)
rises to the left and rises to the right
B)
rises to the left and falls to the right
C)
falls to the left and falls to the right
D)
falls to the left and rises to the right
2

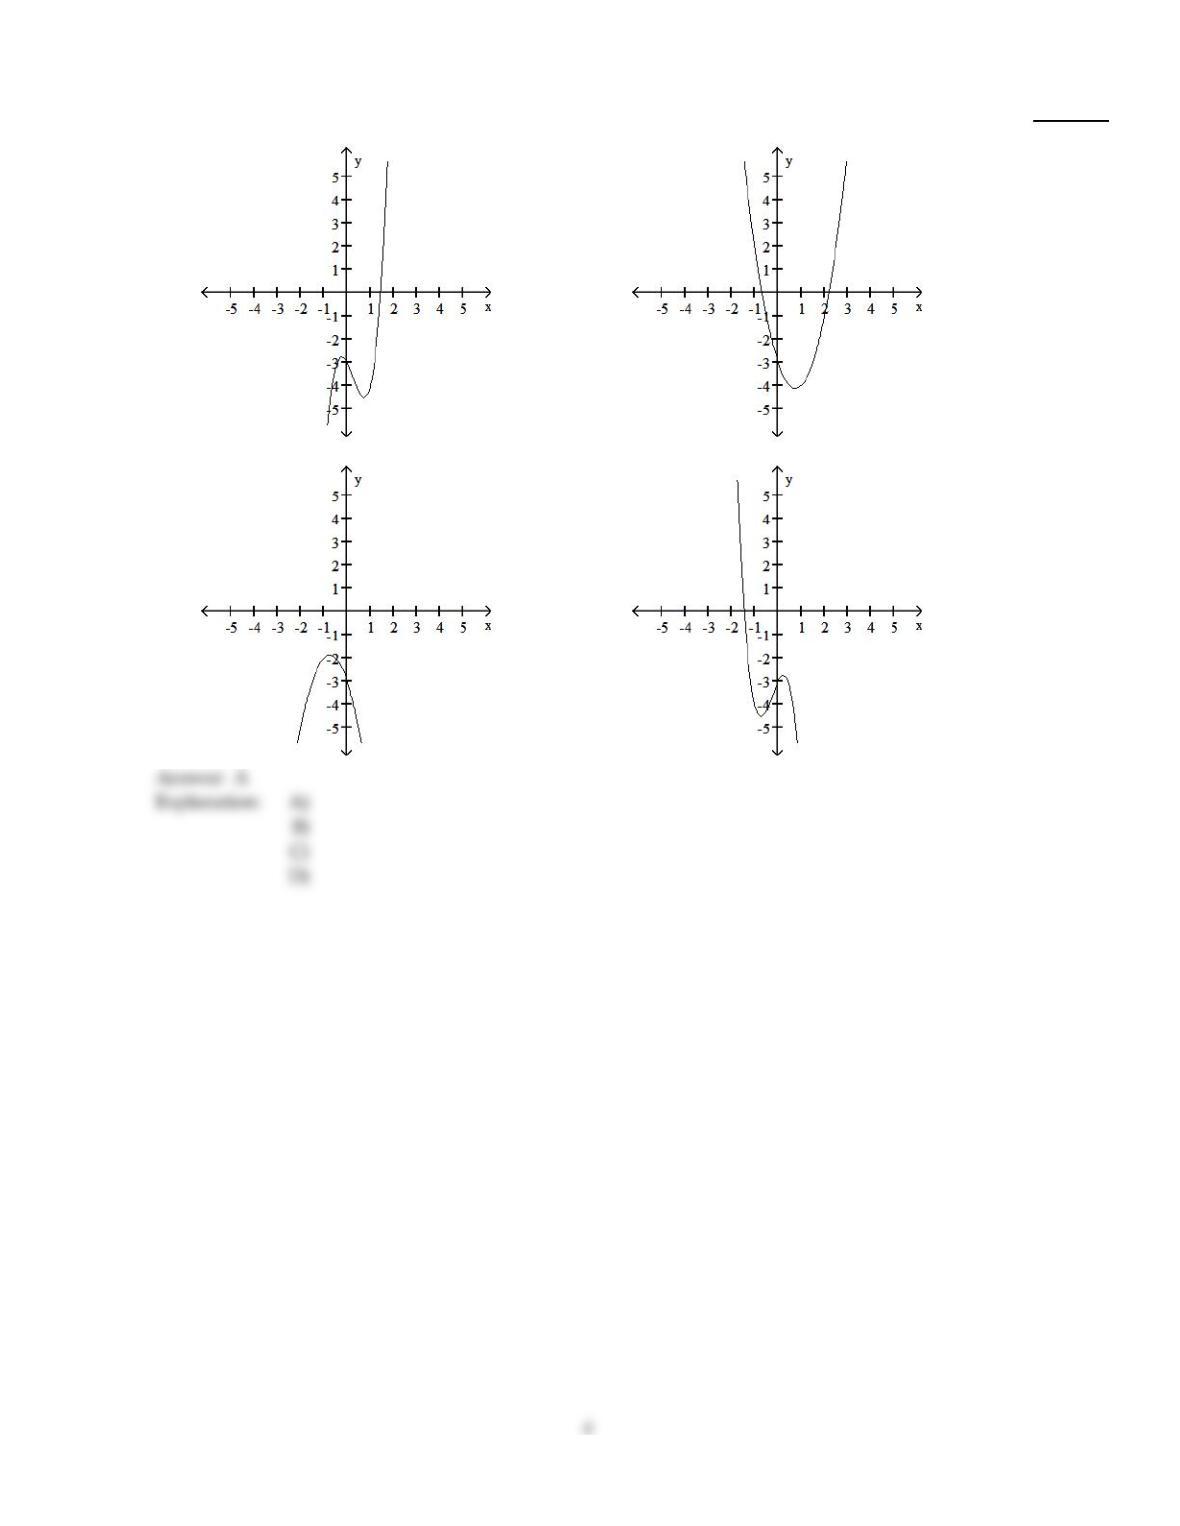
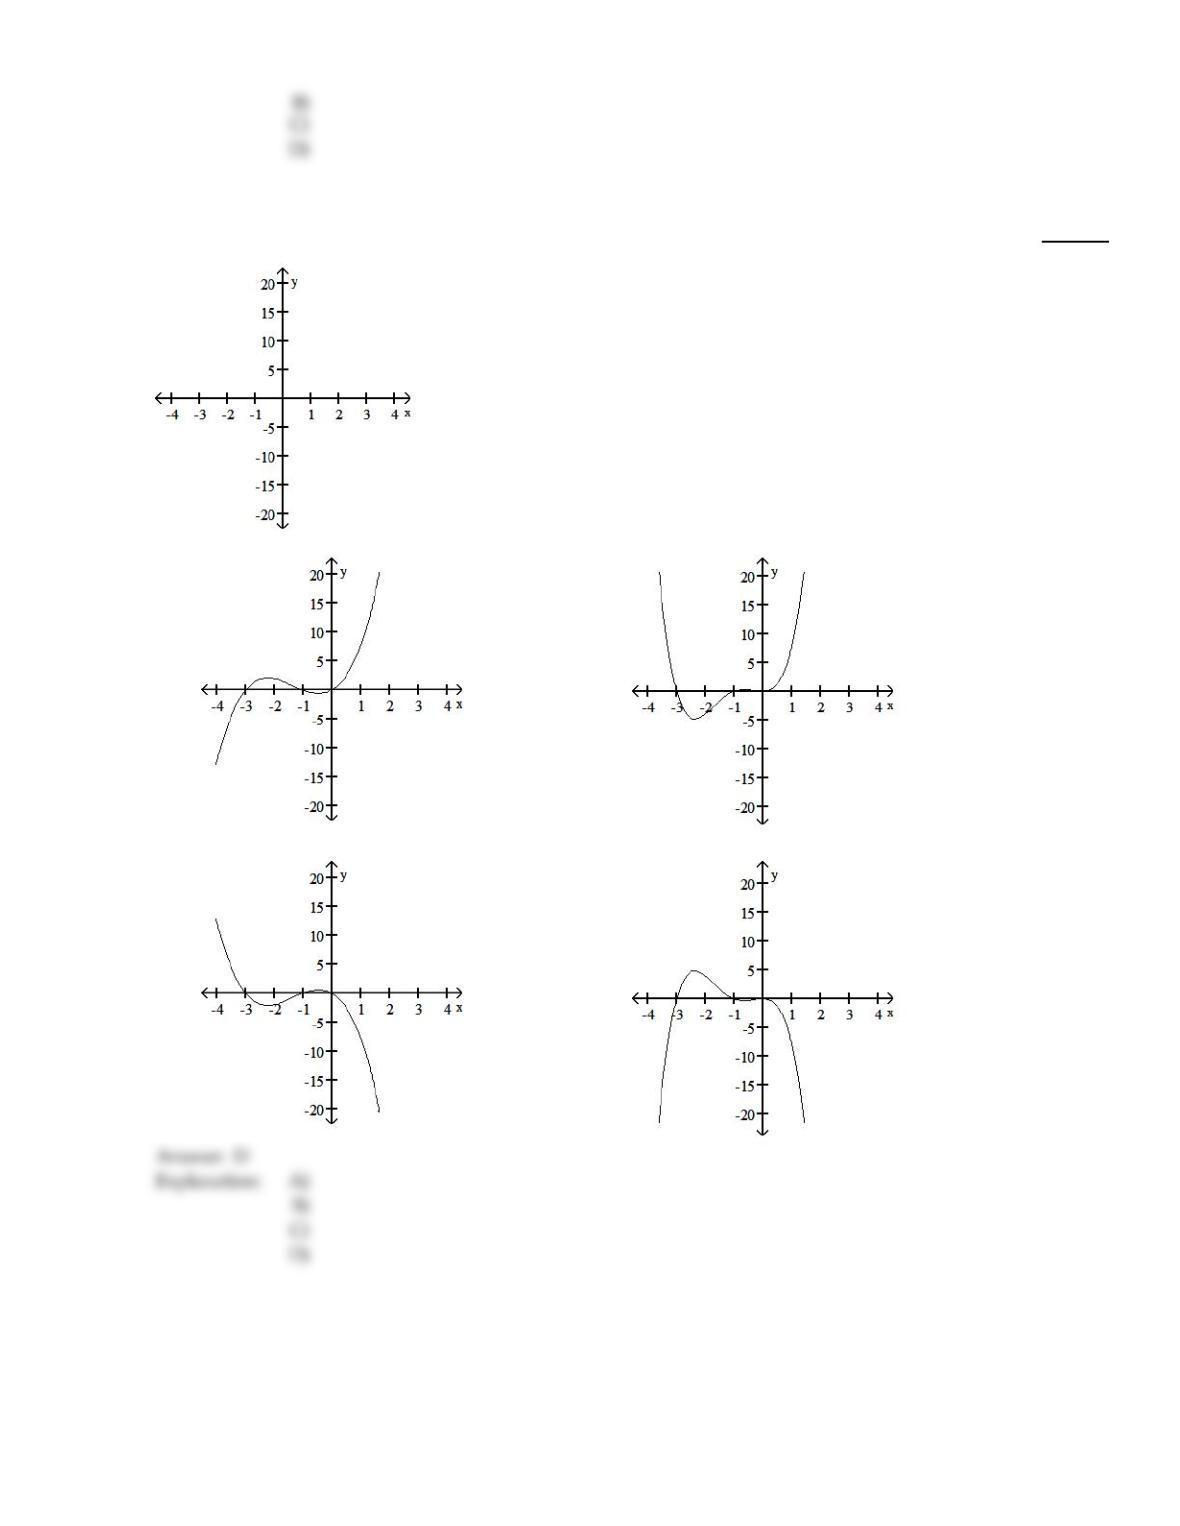
3)
f(x) =3x2+ 2x – 2
3)
A)
falls to the left and falls to the right
B)
falls to the left and rises to the right
C)
rises to the left and falls to the right
D)
rises to the left and rises to the right
3
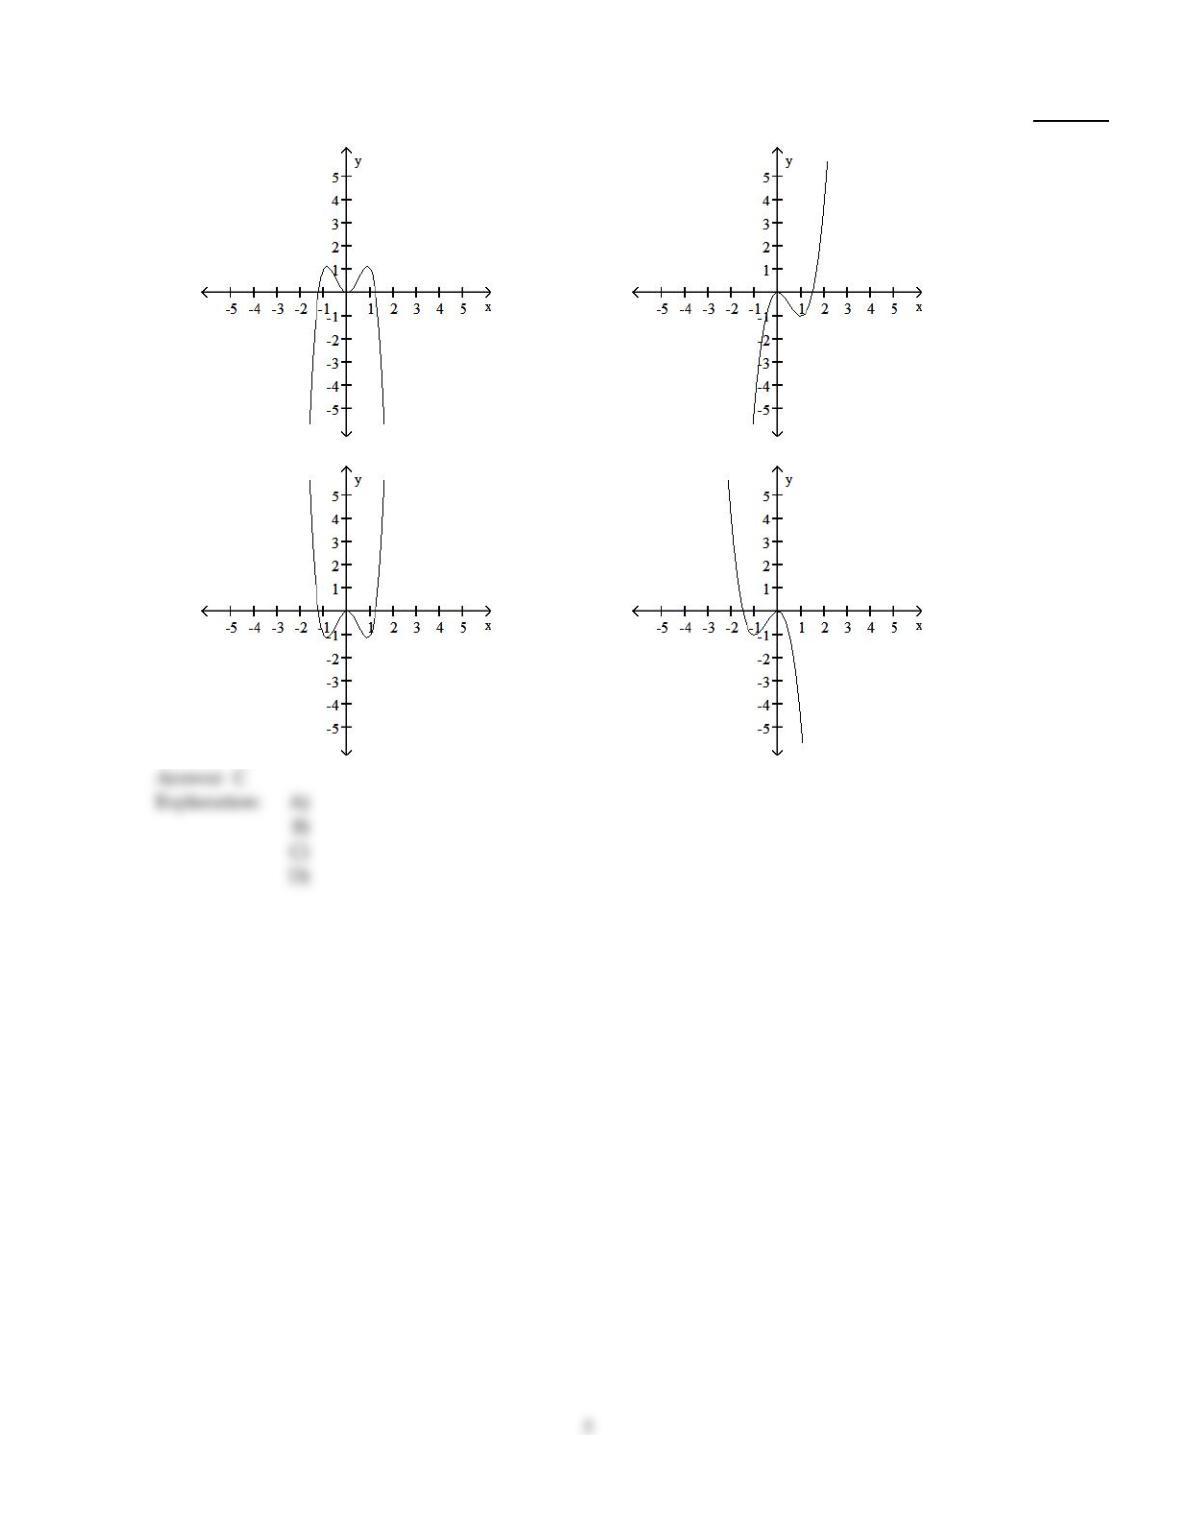
4)
f(x) =4x3– 3x2– 2x – 3
4)
A)
falls to the left and rises to the right
B)
rises to the left and rises to the right
C)
falls to the left and falls to the right
D)
rises to the left and falls to the right
5)
f(x) =2x4–3x2
5)
A)
falls to the left and falls to the right
B)
falls to the left and rises to the right
C)
rises to the left and rises to the right
D)
rises to the left and falls to the right
Solve.
6)
The profits (in millions) for a company for 8 years were as follows:
Year, x Profits, P
1993, 1
1994, 2
1995, 3
1996, 4
1997, 5
1998, 6
1999, 7
2000, 8
1.1
1.7
2.0
1.4
1.3
1.5
1.8
2.1
Which of the following polynomials is the best model for this data?
6)
A)
P(x) =0.03x3–0.3x2+ 1.3x + 0.17
B)
P(x) = – 0.03x4–0.3x2+ 1.3x + 0.17
C)
P(x) = – 0.08x3+7x2+ 1.3x – 0.18
D)
P(x) =0.05x2– 0.8x + 6
SHORT ANSWER. Write the word or phrase that best completes each statement or answers the question.
Complete the following:
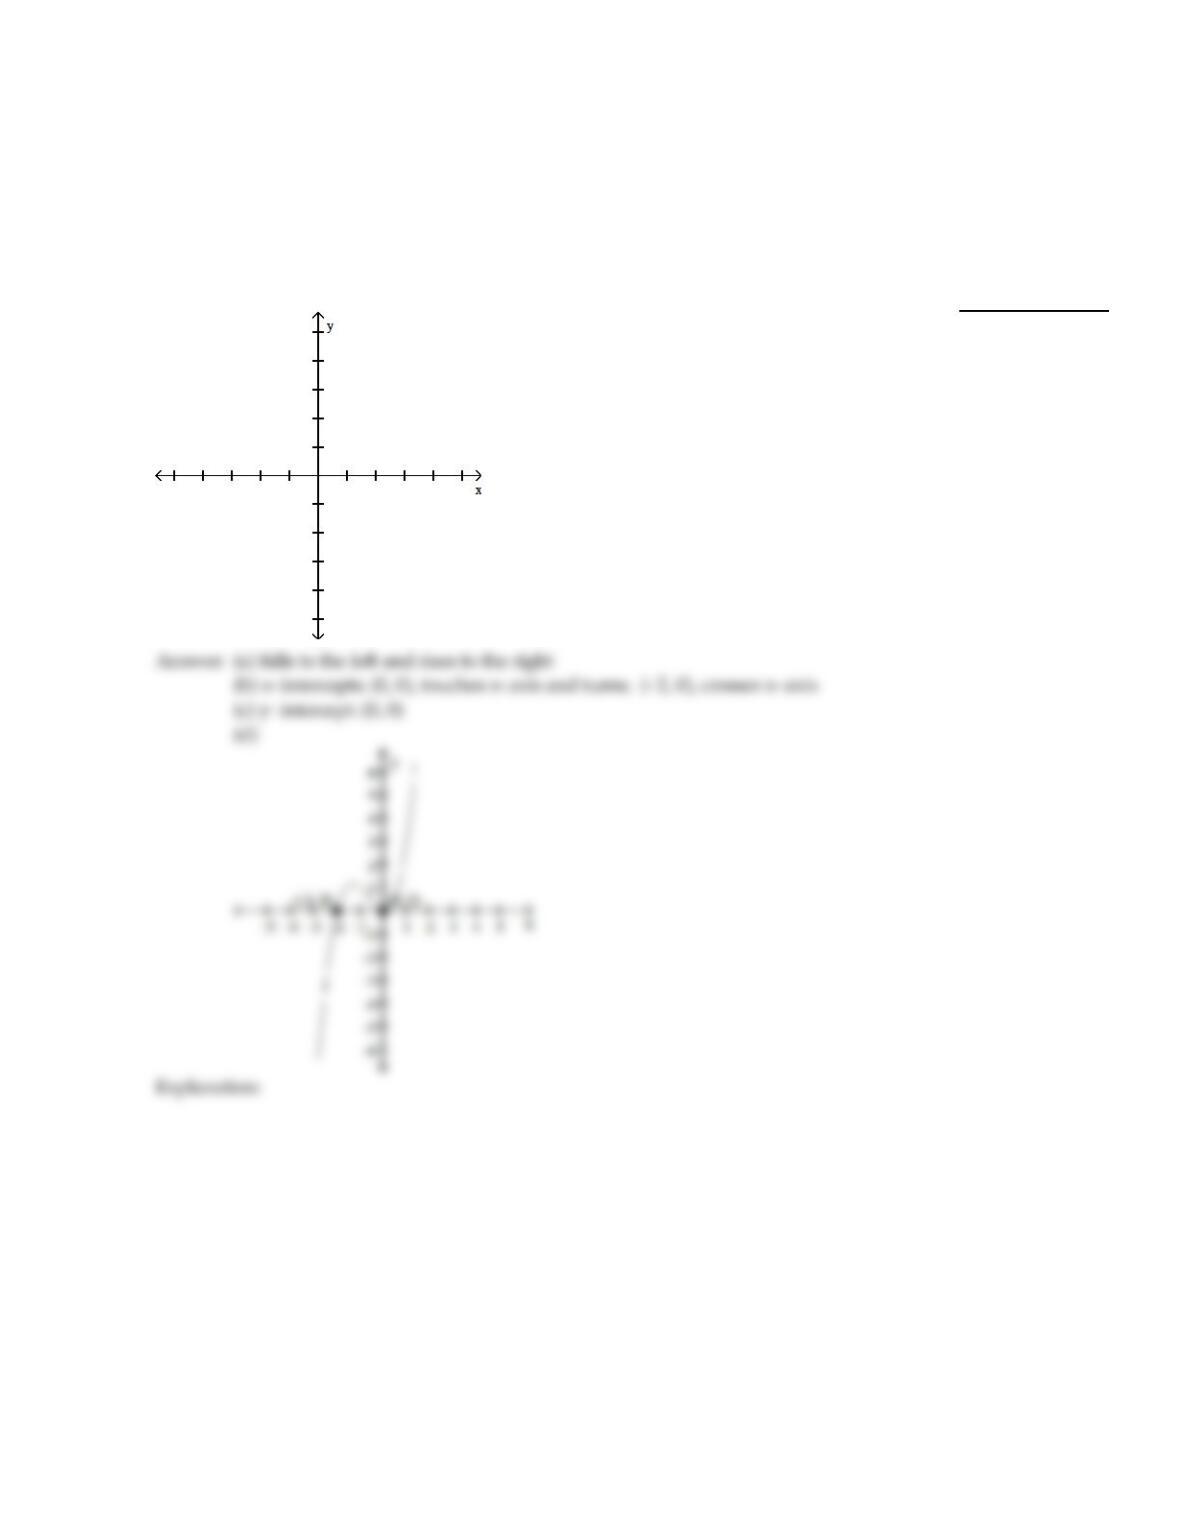
(a) Use the Leading Coefficient Test to determine the graph’s end behavior.
(b) Find the x–intercepts. State whether the graph crosses the x–axis or touches the x–axis and turns around at each
intercept.
(c) Find the y–intercept.
(d) Graph the function.
7)
f(x) =x2(x +2)
7)
7
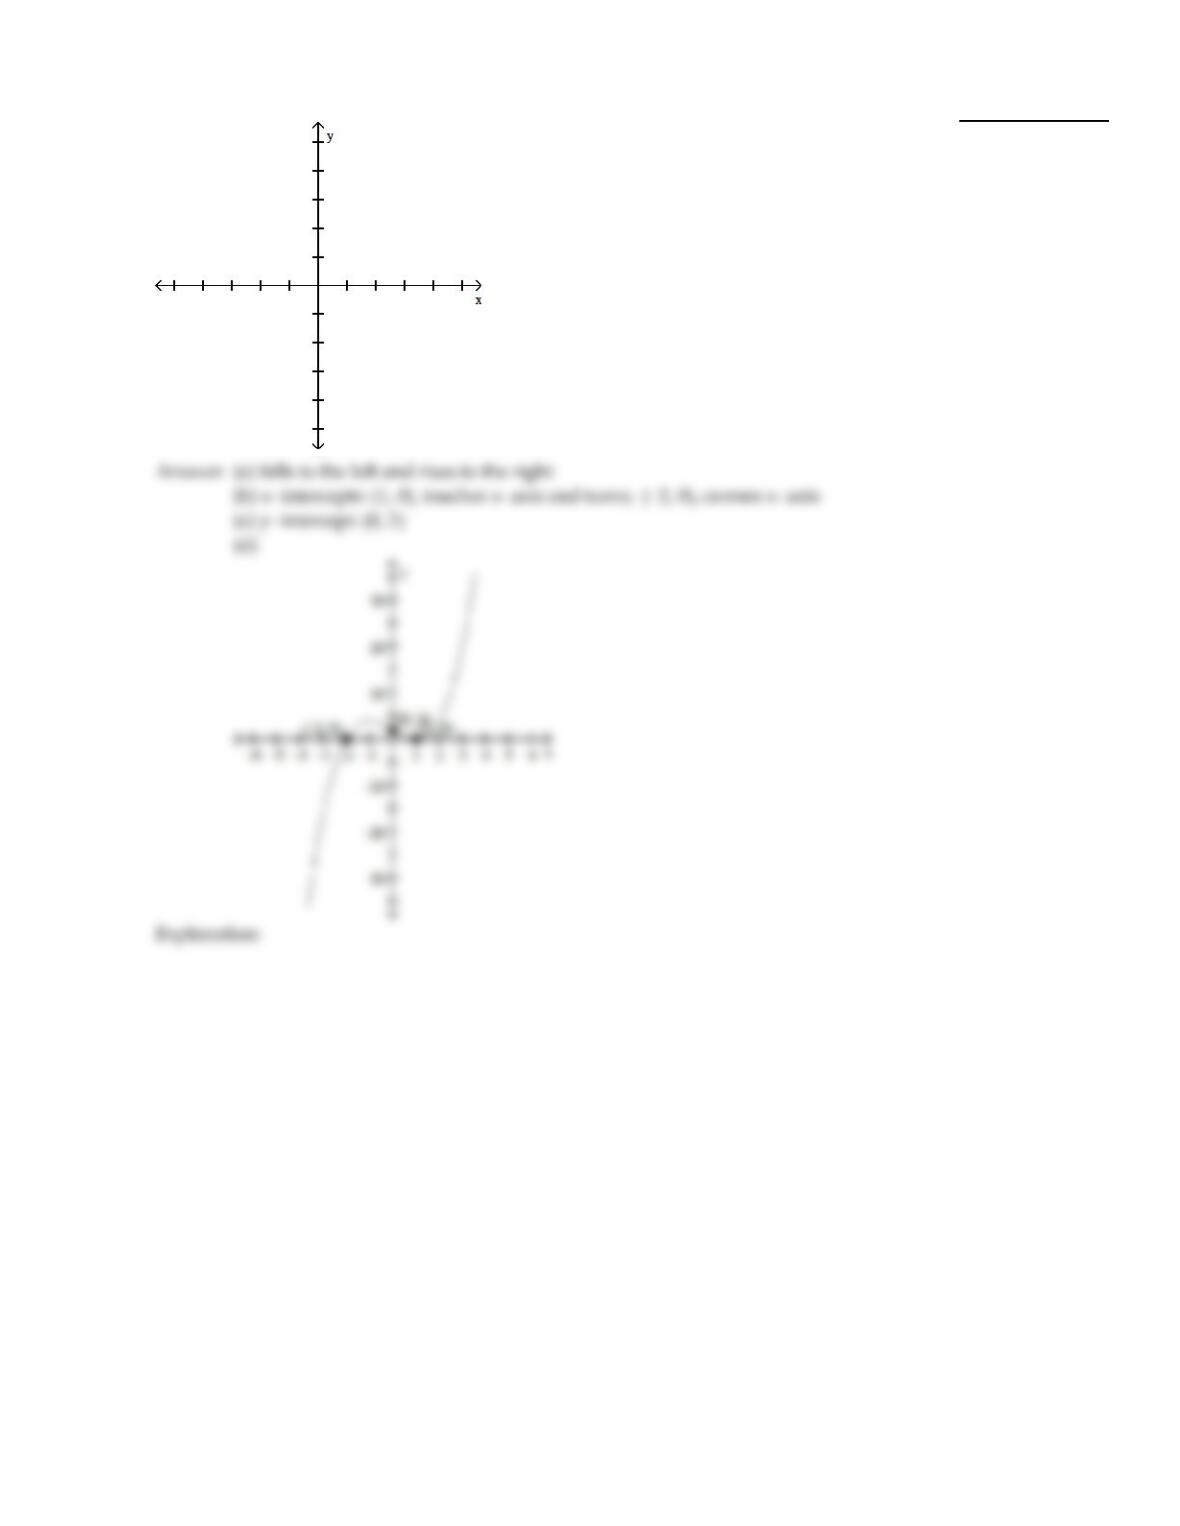
8)
f(x) = (x +2)(x –1)2
8)
8
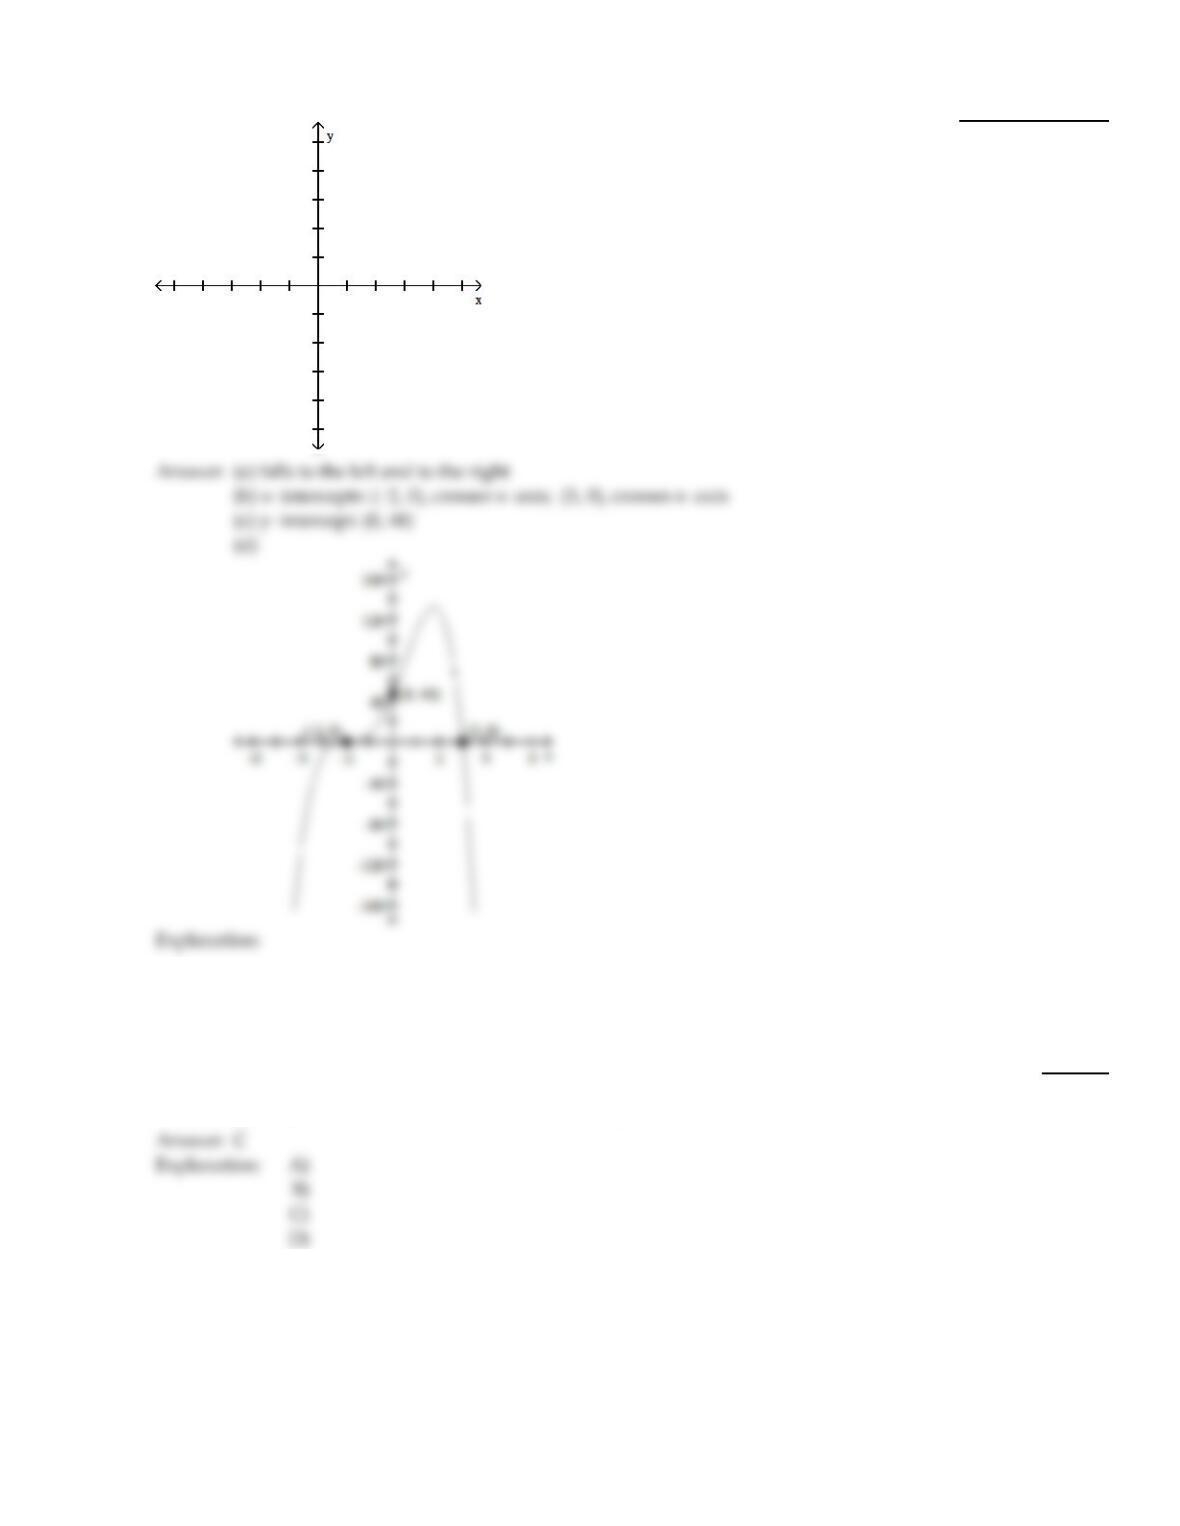
9)
f(x) = – 2(x –3)(x +2)3
9)
MULTIPLE CHOICE. Choose the one alternative that best completes the statement or answers the question.
Find the x–intercepts (if any) for the graph of the quadratic function.
10)
f(x) =(x + 1)2–1
10)
A)
(0, 0) and (2, 0)
B)
(0, 0) and (–1, 0)
C)
(0, 0) and (–2, 0)
D)
(2, 0) and (–2, 0)
C
Use the vertex and intercepts to sketch the graph of the quadratic function.
9
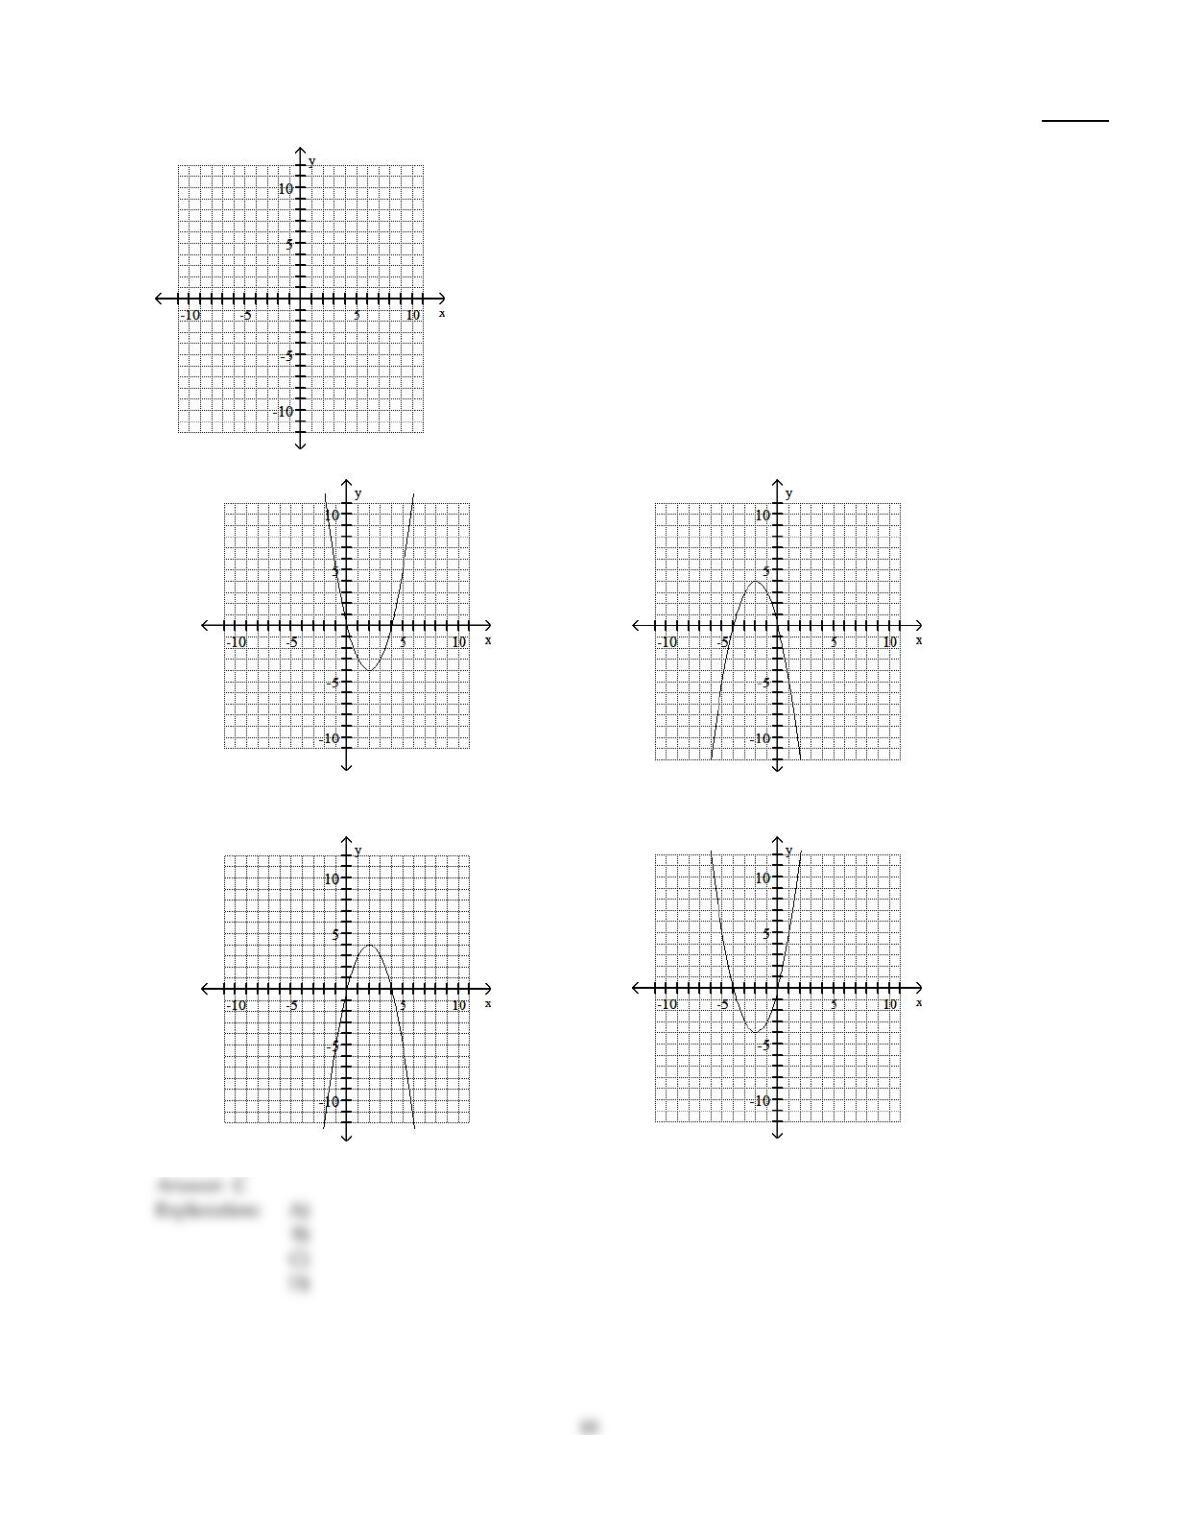
11)
f(x) =4– (x – 2)2
11)
A)
B)
C)
D)
Solve the problem.
12)
The time in hours it takes a satellite to complete an orbit around the earth varies directly as the
radius of the orbit (from the center of the earth) and inversely as the orbital velocity. If a satellite
completes an orbit 710 miles above the earth in 12 hours at a velocity of 22,000 mph, how long
would it take a satellite to complete an orbit if it is at 1300 miles above the earth at a velocity of
30,000 mph? (Use 3960 miles as the radius of the earth.) Round your answer to the nearest
hundredth of an hour.
12)
A)
16.11 hours
B)
99.12 hours
C)
2.45 hours
D)
9.91 hours
Find an nth degree polynomial function with real coefficients satisfying the given conditions.
13)
n = 4; 2i, 3, and –3 are zeros; leading coefficient is 1
13)
A)
f(x) = x4+ 4x2–3x – 36
B)
f(x) = x4– 5x2– 36
C)
f(x) = x4+ 4x3– 5x2– 36
D)
f(x) = x4+ 4x2– 36
Divide using long division.
14)
(4x5–x3+ 5x2– 89x – 25) ÷ (x2– 5)
14)
A)
4x3+ 19x + 5 +6x – 50
x2– 5
B)
4x3+ 19x + 5 –6x
x2– 5
C)
4x3+ 19x – 5 +6x
x2– 5
D)
4x3+ 19x + 5 +6x
x2– 5
11
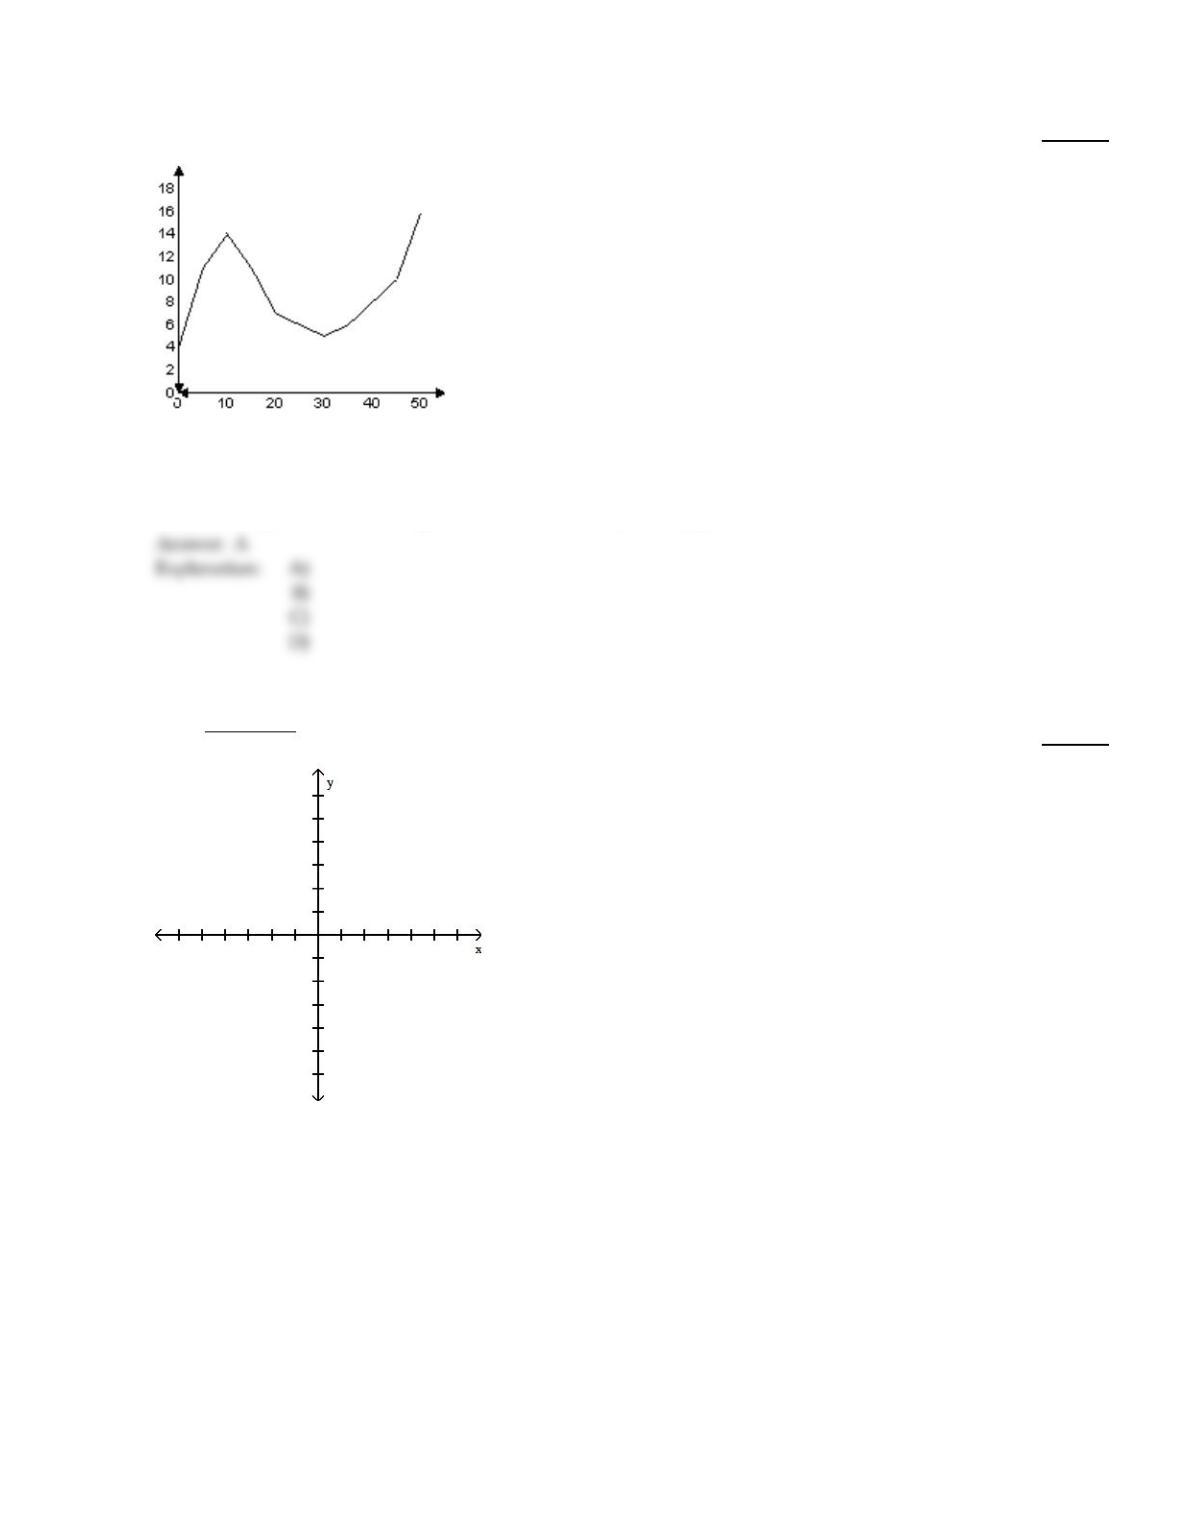
Solve.
15)
Suppose that a polynomial function is used to model the data shown in the graph below.
For what intervals is the function increasing?
15)
A)
0 through 10 and 30 through 50
B)
0 through 20 and 30 through 50
C)
0 through 10 and 40 through 50
D)
0 through 50
Graph the rational function.
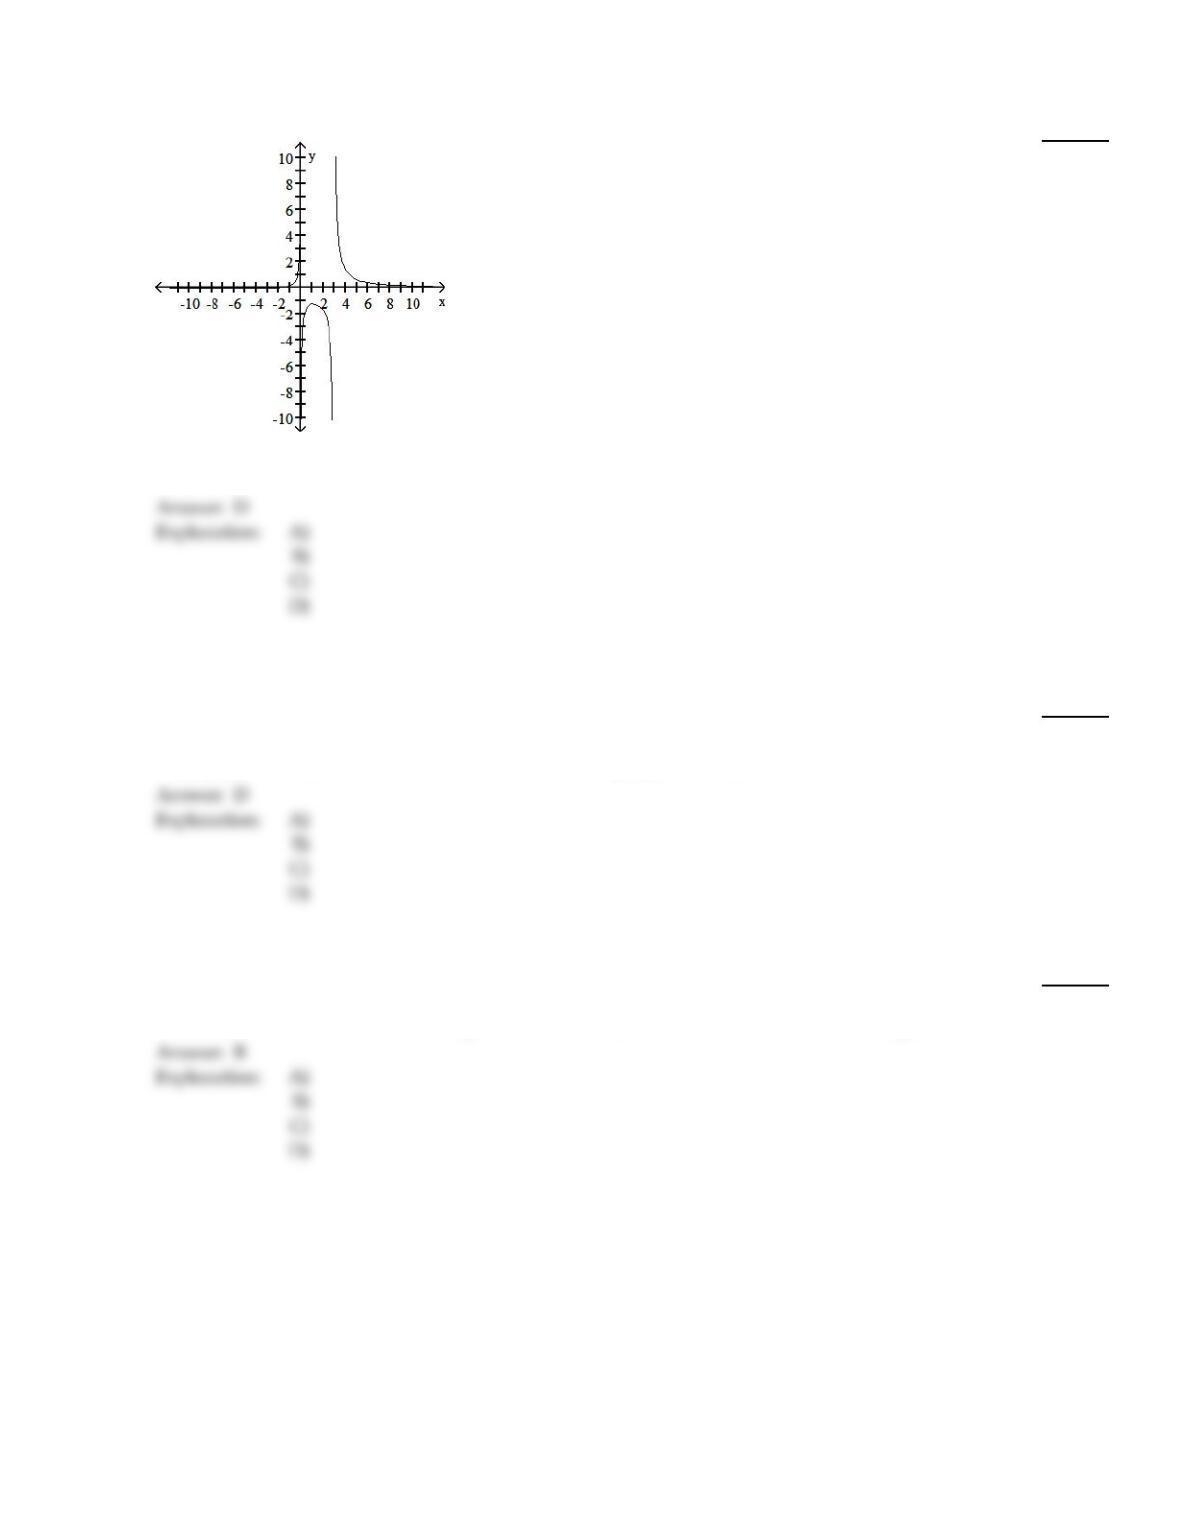
16)
f(x) =x2– x – 56
x2– 1
16)
12
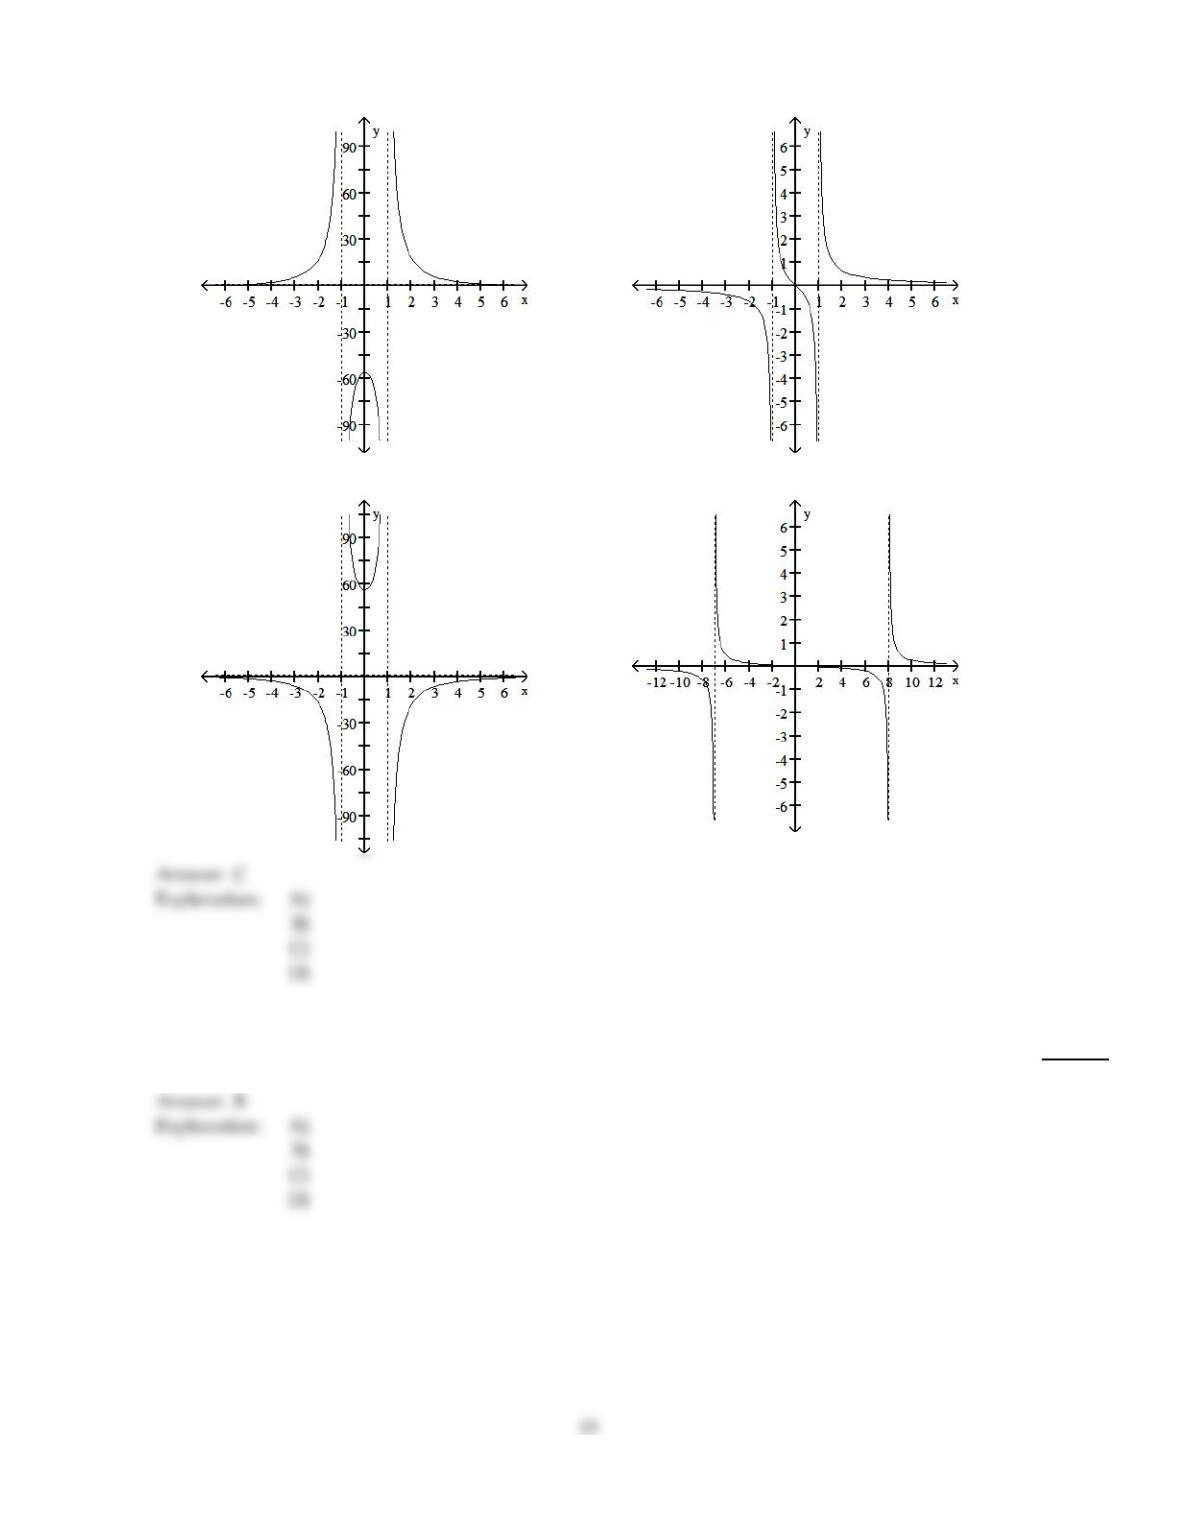
A)
B)
C)
D)
Solve the problem.
17)
y varies jointly as x and z. y =2.7 when x =45 and z =6. Find y when x =30 and z =6.
17)
A)
18
B)
1.8
C)
3.6
D)
180
B
C
18)
April shoots an arrow upward into the air at a speed of 64 feet per second from a platform that is 21
feet high. The height of the arrow is given by the function h(t) = – 16t2+64t +21, where t is the time
is seconds. What is the maximum height of the arrow?
18)
A)
64 ft
B)
85 ft
C)
21 ft
D)
17 ft
Find the domain and range of the quadratic function whose graph is described.
19)
The vertex is (1, 0) and the graph opens down.
19)
A)
Domain: (–, 1]
Range: (–, 0]
B)
Domain: (–, )
Range: (–, 0]
C)
Domain: (–, )
Range: [0, )
D)
Domain: (–, )
Range: (–, 1]
B
Solve the problem.
20)
A rain gutter is made from sheets of aluminum that are 18 inches wide by turning up the edges to
form right angles. Determine the depth of the gutter that will maximize its cross–sectional area and
allow the greatest amount of water to flow.
20)
A)
4.5 inches
B)
5 inches
C)
4 inches
D)
5.5 inches
A
B
Use the graph of the rational function shown to complete the statement.
21)
As x
3–, f(x)
?
21)
A)
–3
B)
0
C)
+
D)
–
Write the equation of a polynomial function with the given characteristics. Use a leading coefficient of 1 or –1 and make
the degree of the function as small as possible.
22)
Touches the x–axis at 0 and crosses the x–axis at 3; lies below the x–axis between 0 and 3.
22)
A)
f(x) =x3+3x2
B)
f(x) = – x3+3x2
C)
f(x) = – x3–3x2
D)
f(x) =x3–3x2
Use the Leading Coefficient Test to determine the end behavior of the polynomial function.
23)
f(x) =2x3+ 5x2+ 5x + 5
23)
A)
rises to the left and rises to the right
B)
falls to the left and rises to the right
C)
falls to the left and falls to the right
D)
rises to the left and falls to the right
15
Find the degree of the polynomial function.
24)
f(x) =x4+ 7x3+ 3
24)
A)
4
B)
1
C)
3
D)
Find the range of the quadratic function.
25)
f(x) =x2– 4x – 5
25)
A)
[–2, )
B)
(–, –9]
C)
[–9, )
D)
(–, –17]
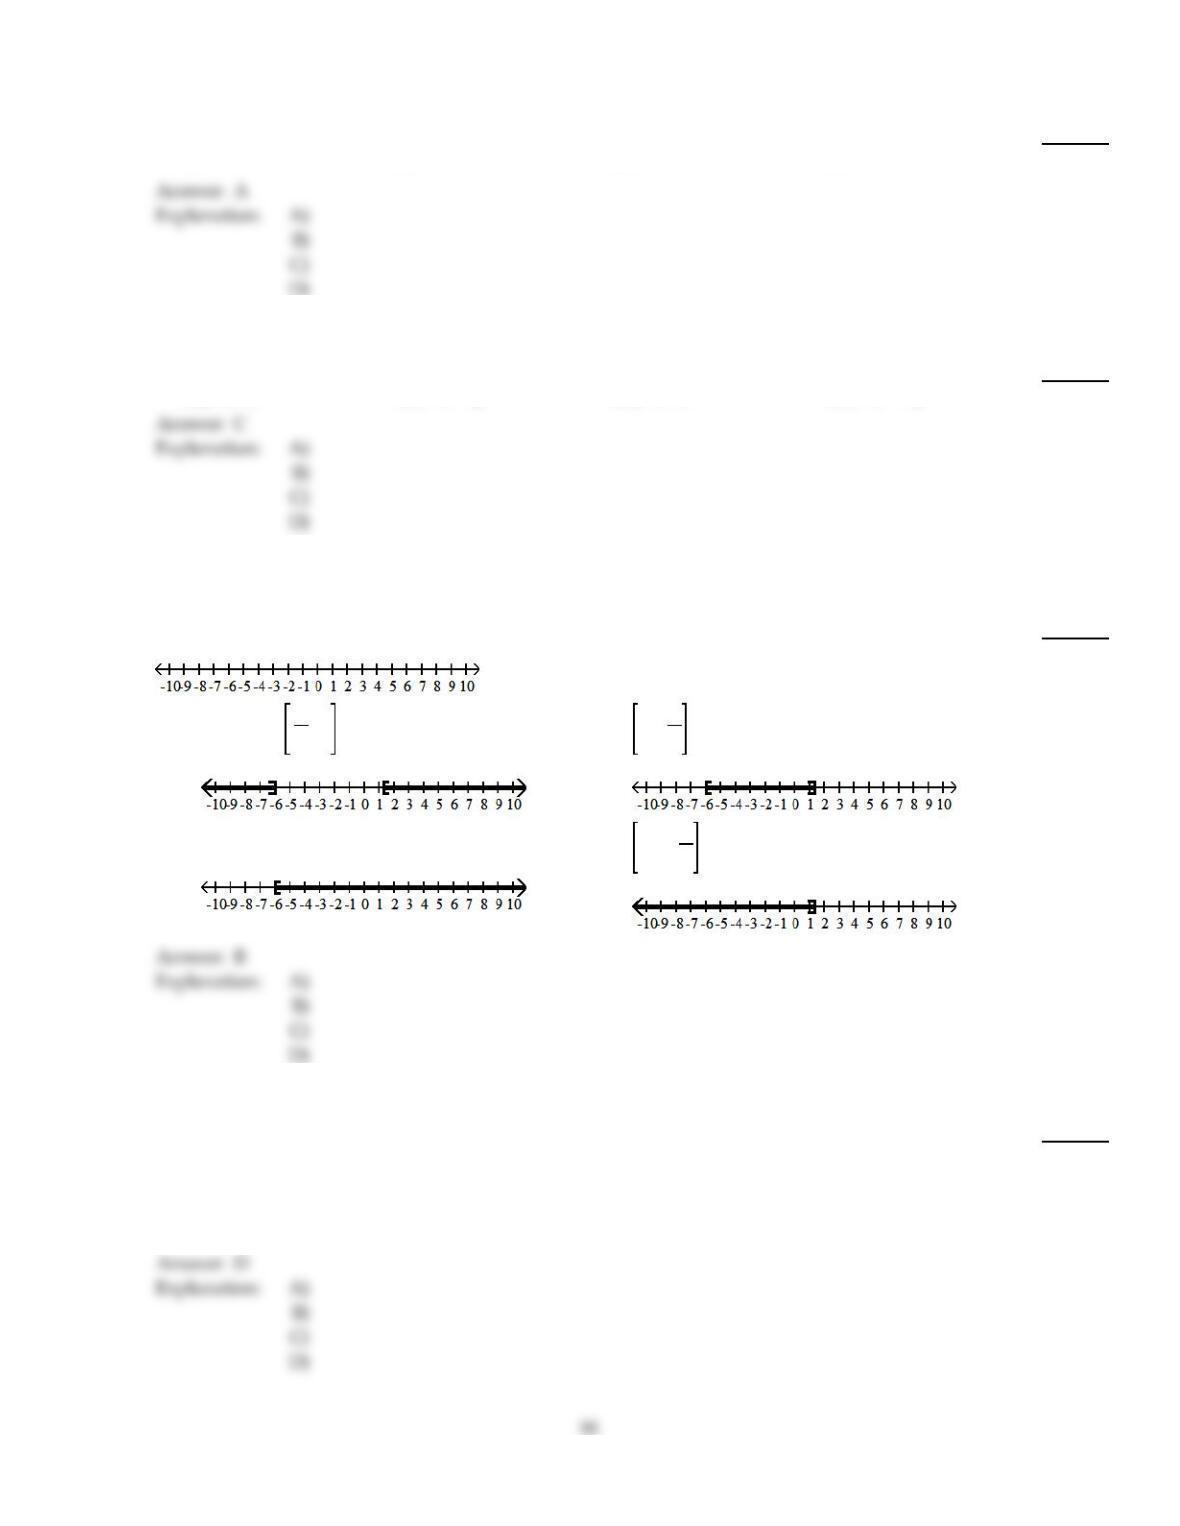
Solve the polynomial inequality and graph the solution set on a number line. Express the solution set in interval
notation.
26)
3x2+ 14x –24 0
26)
A)
(–, –6] 4
3,
B)
–6, 4
3
C)
[–6, )
D)
–, 4
3
Solve the problem.
27)
An object is propelled vertically upward from the top of a 32–foot building. The quadratic function
s(t) = – 16t2+160t +32 models the ball’s height above the ground, s(t), in feet, t seconds after it was
thrown. How many seconds does it take until the object finally hits the ground? Round to the
nearest tenth of a second if necessary.
27)
A)
5 seconds
B)
2 seconds
C)
0.2 seconds
D)
10.2 seconds
28)
The amount of water used to take a shower is directly proportional to the amount of time that the
shower is in use. A shower lasting 20 minutes requires 8 gallons of water. Find the amount of
water used in a shower lasting 5 minutes.
28)
A)
32 gallons
B)
12.5 gallons
C)
1.6 gallons
D)
2 gallons
Find the coordinates of the vertex for the parabola defined by the given quadratic function.
29)
f(x) = – 7(x –2)2–6
29)
A)
(–2, –6)
B)
(2, –6)
C)
(–7, –2)
D)
(–6, 2)
Find the zeros of the polynomial function.
30)
f(x) =x3+5x2– x –5
30)
A)
x = 1, x = – 5, x =5
B)
x =25
C)
x = – 5, x =5
D)
x = – 1, x = 1, x = – 5
Determine whether the graph of the polynomial has y–axis symmetry, origin symmetry, or neither.
31)
f(x) =4x2–x3
31)
A)
y–axis symmetry
B)
origin symmetry
C)
neither
Solve the problem.
32)
The width of a rectangle is x –3
4 feet and its area is 4x3+21x2+14x – 24 square feet. Write a
polynomial that represents the length of the rectangle.
32)
A)
4x2–24x +32 ft
B)
4x2+24x –32 ft
C)
4x2+24x +32 ft
D)
4x2+18x +1
2 ft
33)
You have 64 feet of fencing to enclose a rectangular plot that borders on a river. If you do not fence
the side along the river, find the length and width of the plot that will maximize the area.
33)
A)
length: 16 feet, width: 16 feet
B)
length: 32 feet, width: 32 feet
C)
length: 48 feet, width: 16 feet
D)
length: 32 feet, width: 16 feet
Use the vertex and intercepts to sketch the graph of the quadratic function.
34)
f(x) =x2– 6x + 5
34)
A)
B)
C)
D)
Graph the polynomial function.
35)
f(x) = – x2(x + 1)(x + 3)
35)
A)
B)
C)
D)
19
Find the vertical asymptotes, if any, of the graph of the rational function.
36)
g(x) =x
x + 3
36)
A)
x = 0 and x =3
B)
x = – 3
C)
x = 0 and x = – 3
D)
no vertical asymptote
Find the coordinates of the vertex for the parabola defined by the given quadratic function.
37)
f(x) = x2– 5
37)
A)
(5, 0)
B)
(0, 5)
C)
(0, –5)
D)
(1, 0)
Determine the maximum possible number of turning points for the graph of the function.
38)
f(x) = – x2– 8x + 15
38)
A)
3
B)
0
C)
1
D)
2
Solve the problem.
39)
If y varies directly as the cube of x, and y =10 when x =4, find y when x =10.
39)
A)
625
4
B)
4
C)
16
25
D)
25
Use the Leading Coefficient Test to determine the end behavior of the polynomial function.
40)
f(x) = (x – 1)(x + 1)(x + 3)3
40)
A)
falls to the left and rises to the right
B)
rises to the left and falls to the right
C)
falls to the left and falls to the right
D)
rises to the left and rises to the right
20