Chapter 3
Chapter Focus
This chapter presents the basic statistical concepts that are used in interpreting information from
standardized assessment.
Check Your Understanding
Activity 3.1
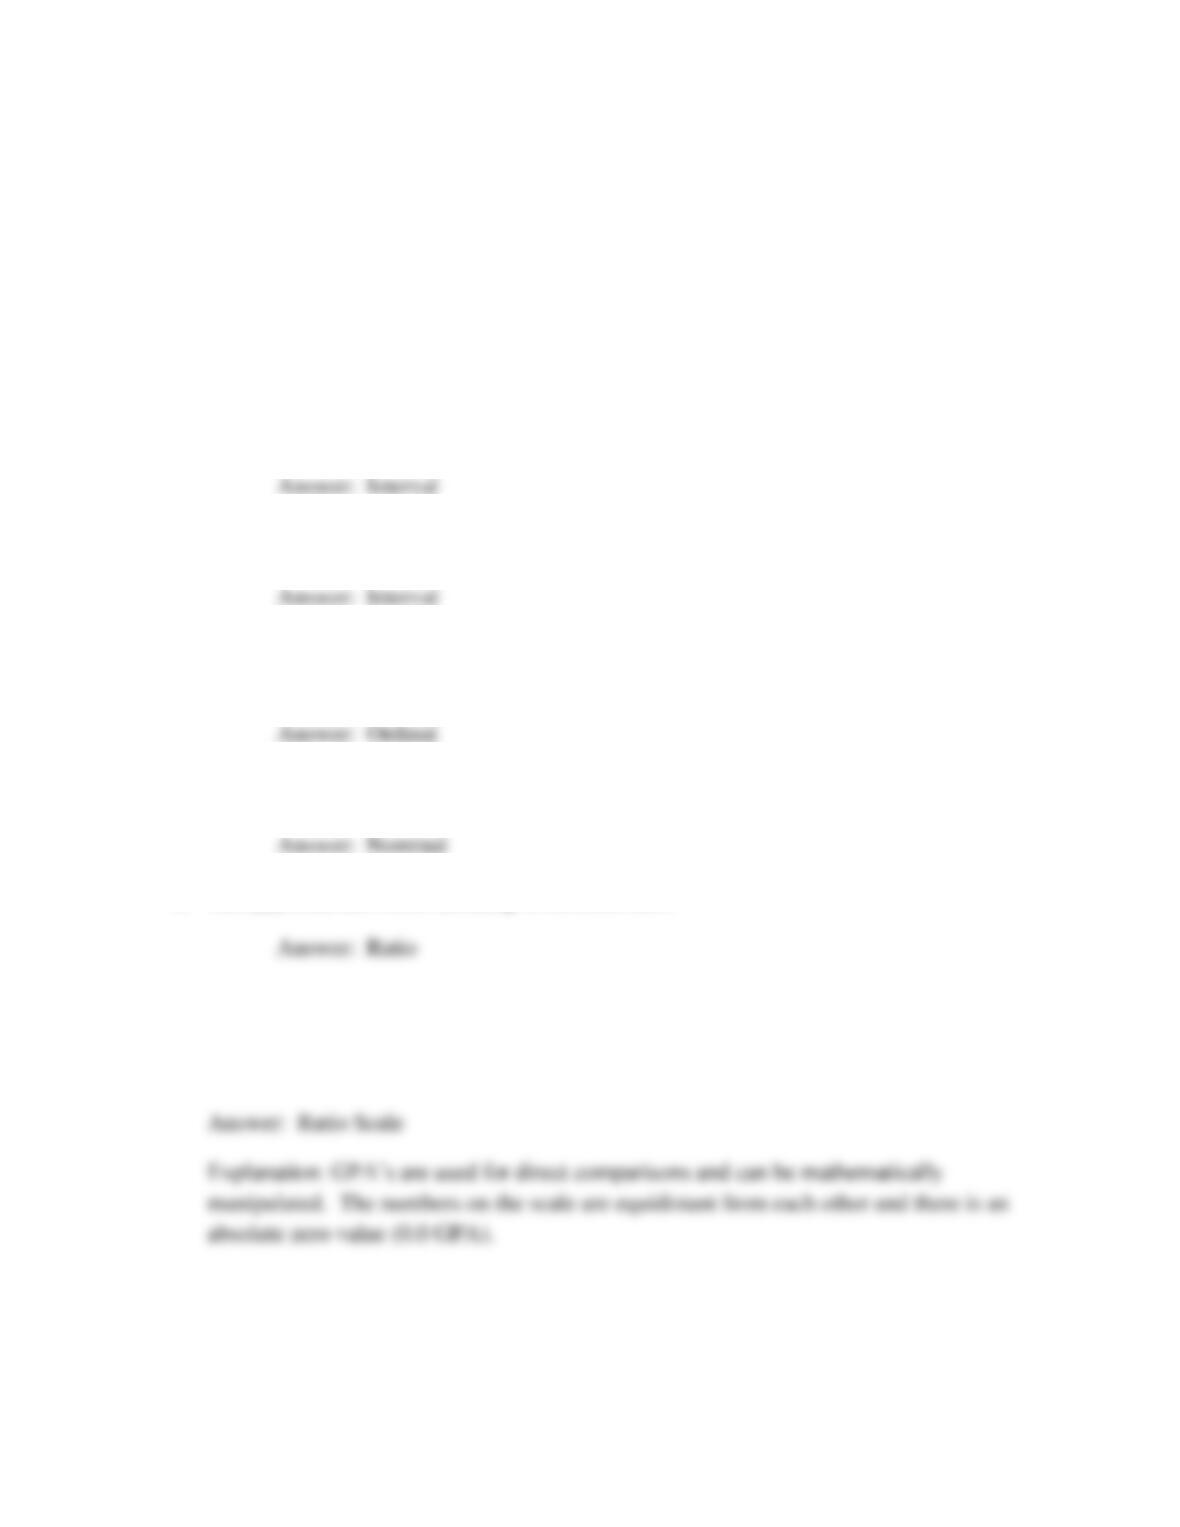
1. Measuring with a thermometer is an example of using numbers on the ___scale.
2. Which scale(s) can be added and subtracted but not multiplied?
3. The ribbons awarded in a painting contest illustrate which scale?
4. Numbers pinned on the shirts of runners in a marathon are numbers used on the ___
scale.
5. The ___ scale has a true meaning of absolute zero.
Apply Your Knowledge
Which of the numerical scales is used to determine your semester GPA?
Activity 3.2
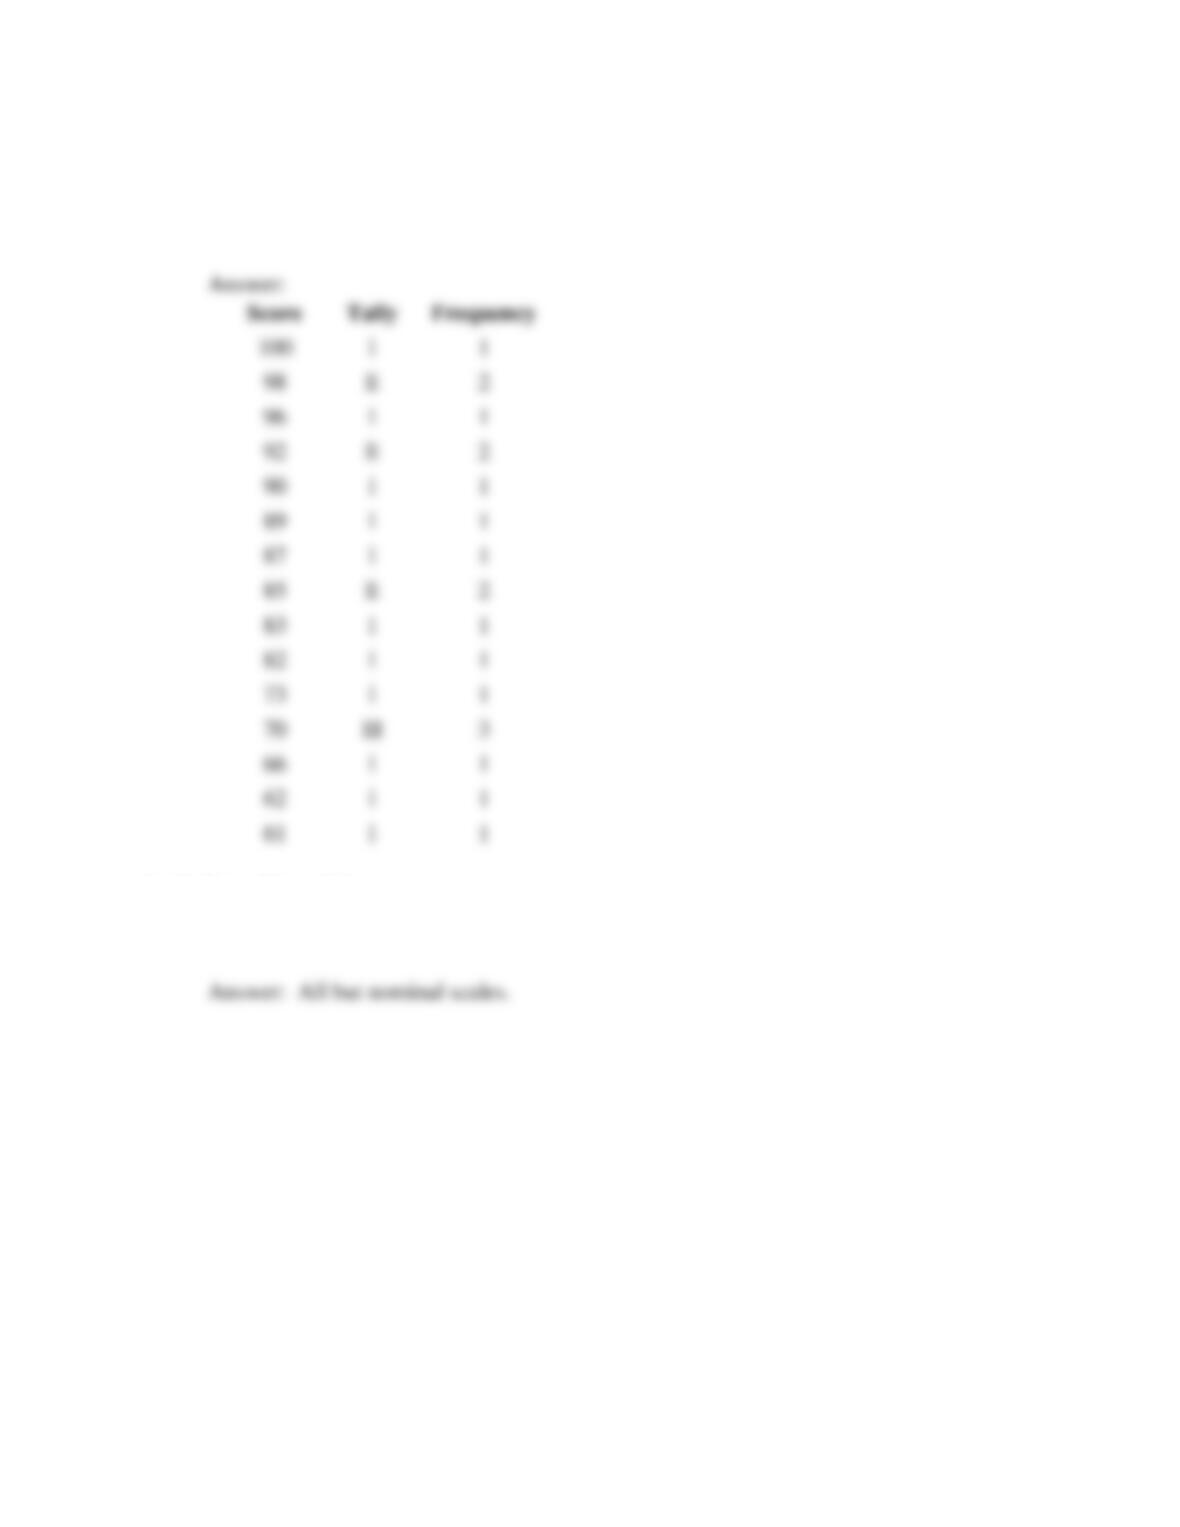
Place the following set of data in rank order and complete a frequency count.
Data Set B
92, 98, 100, 98, 92, 83, 73, 96, 90, 61, 70, 89, 87, 70, 85, 70, 66, 85, 62, 82
Apply Your Knowledge
Which of the numerical scales can be rank ordered?
Activity 3.3
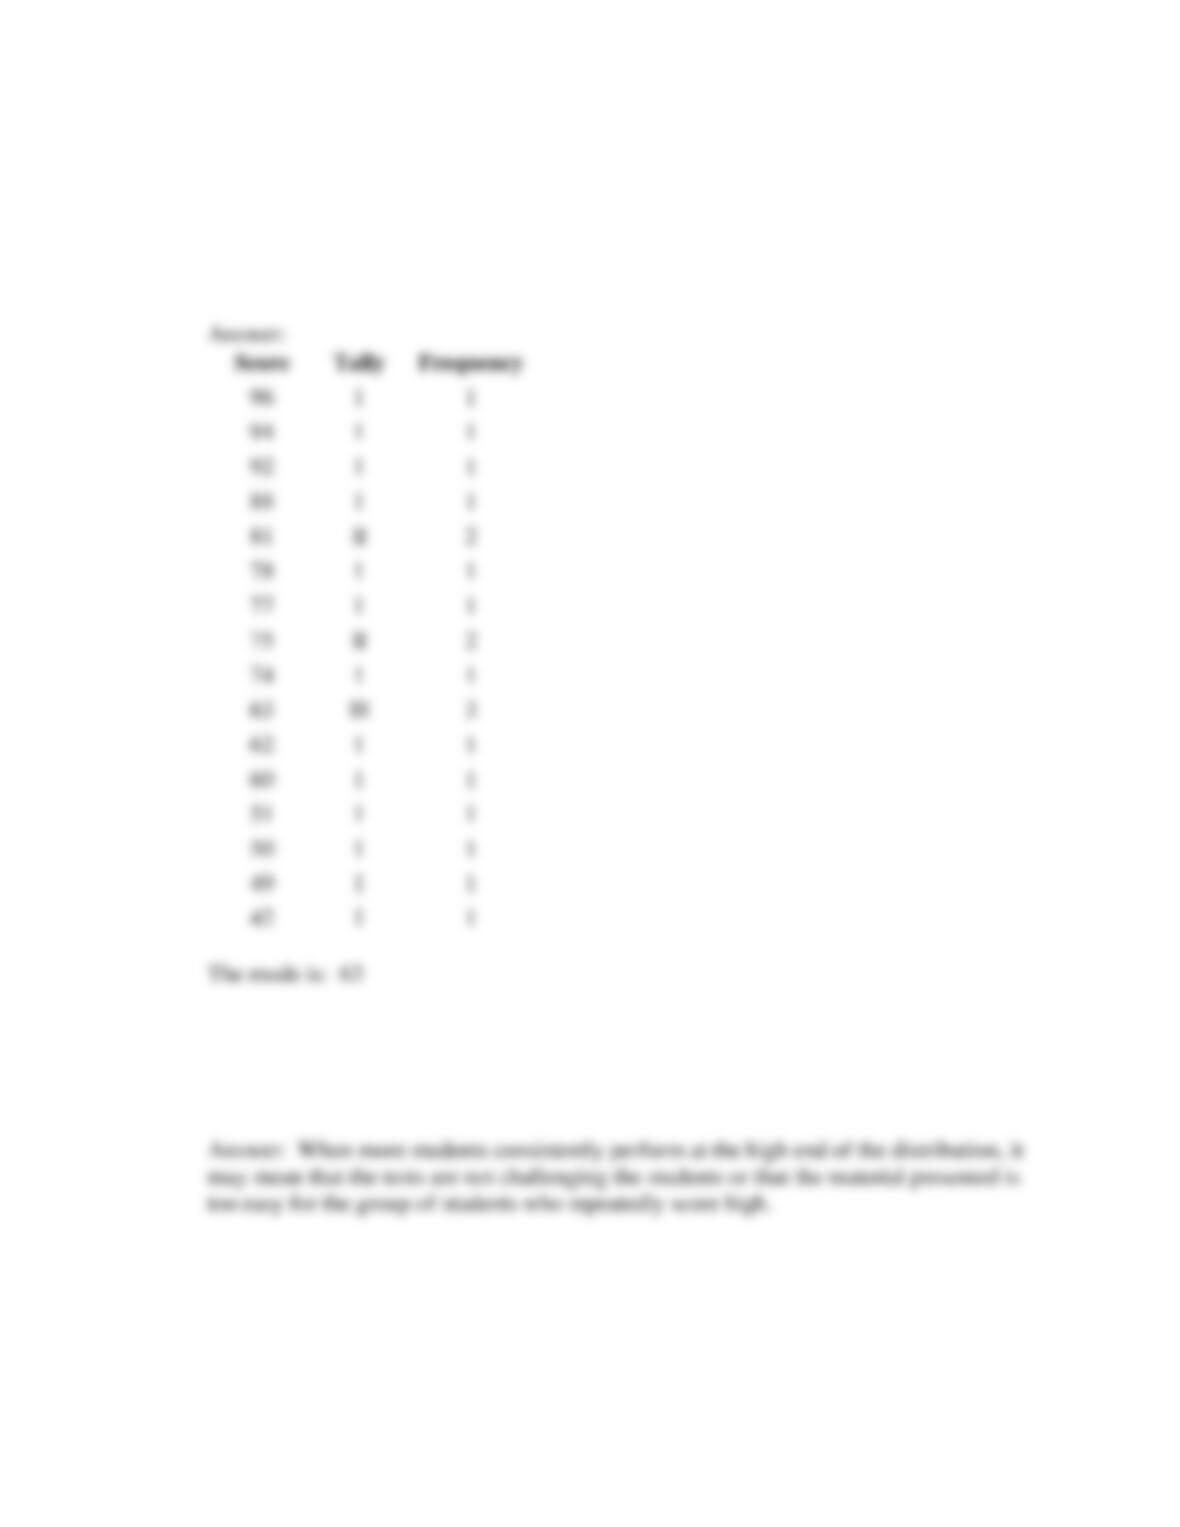
Rank order the following set of data, complete a frequency count, and determine the mode.
Data Set C
62, 63, 51, 42, 78, 81, 81, 63, 75, 92, 94, 77, 63, 75, 96, 88, 60, 50, 49, 74
Apply Your Knowledge
What would it suggest to the teacher if the data of three sets of exams were distributed so that the
mode always occurred at the high end of the scores?
Activity 3.4
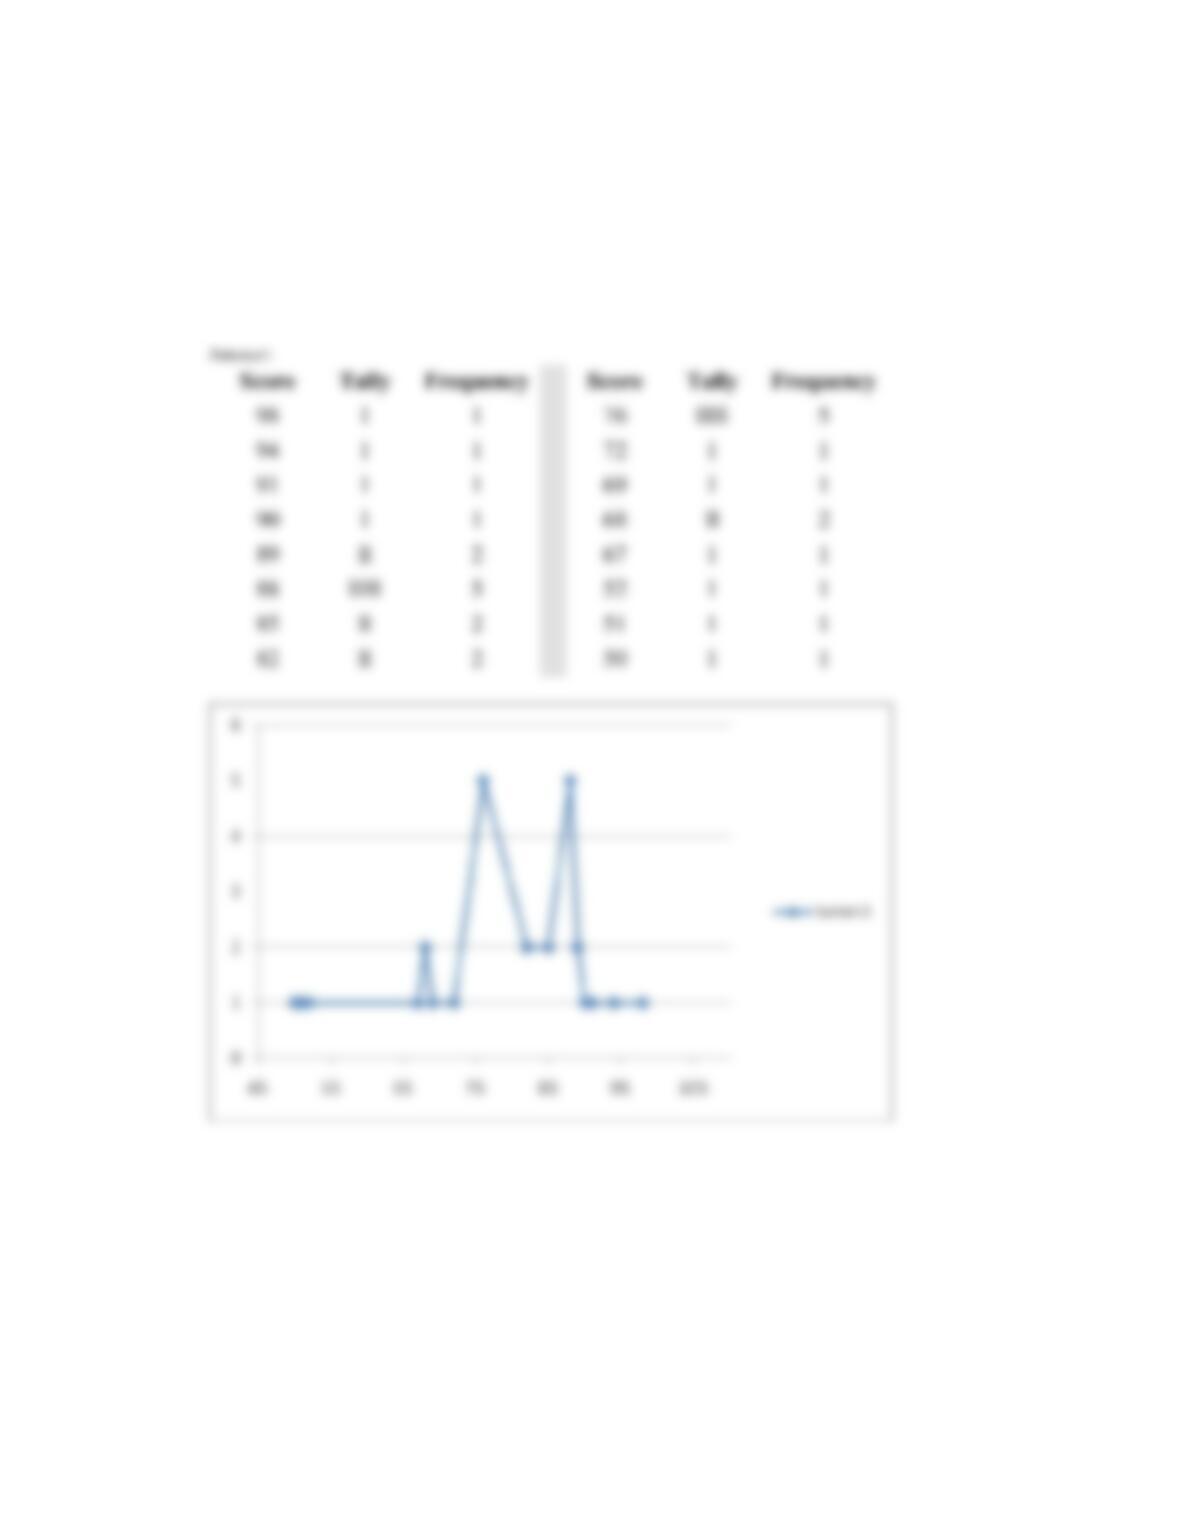
Rank order the data, complete a frequency count, and construct a frequency polygon.
Data Set D
50, 52, 68, 67, 51, 89, 88, 76, 76, 88, 88, 68, 90, 91, 98, 69, 89, 88, 76, 76, 82, 85, 72, 85, 88, 76,
94, 82
Apply Your Knowledge
What type of distribution did you plat using Data Set D?
Answer: The distribution is bimodal (78 & 88 occurred 5 times each).
Activity 3.5
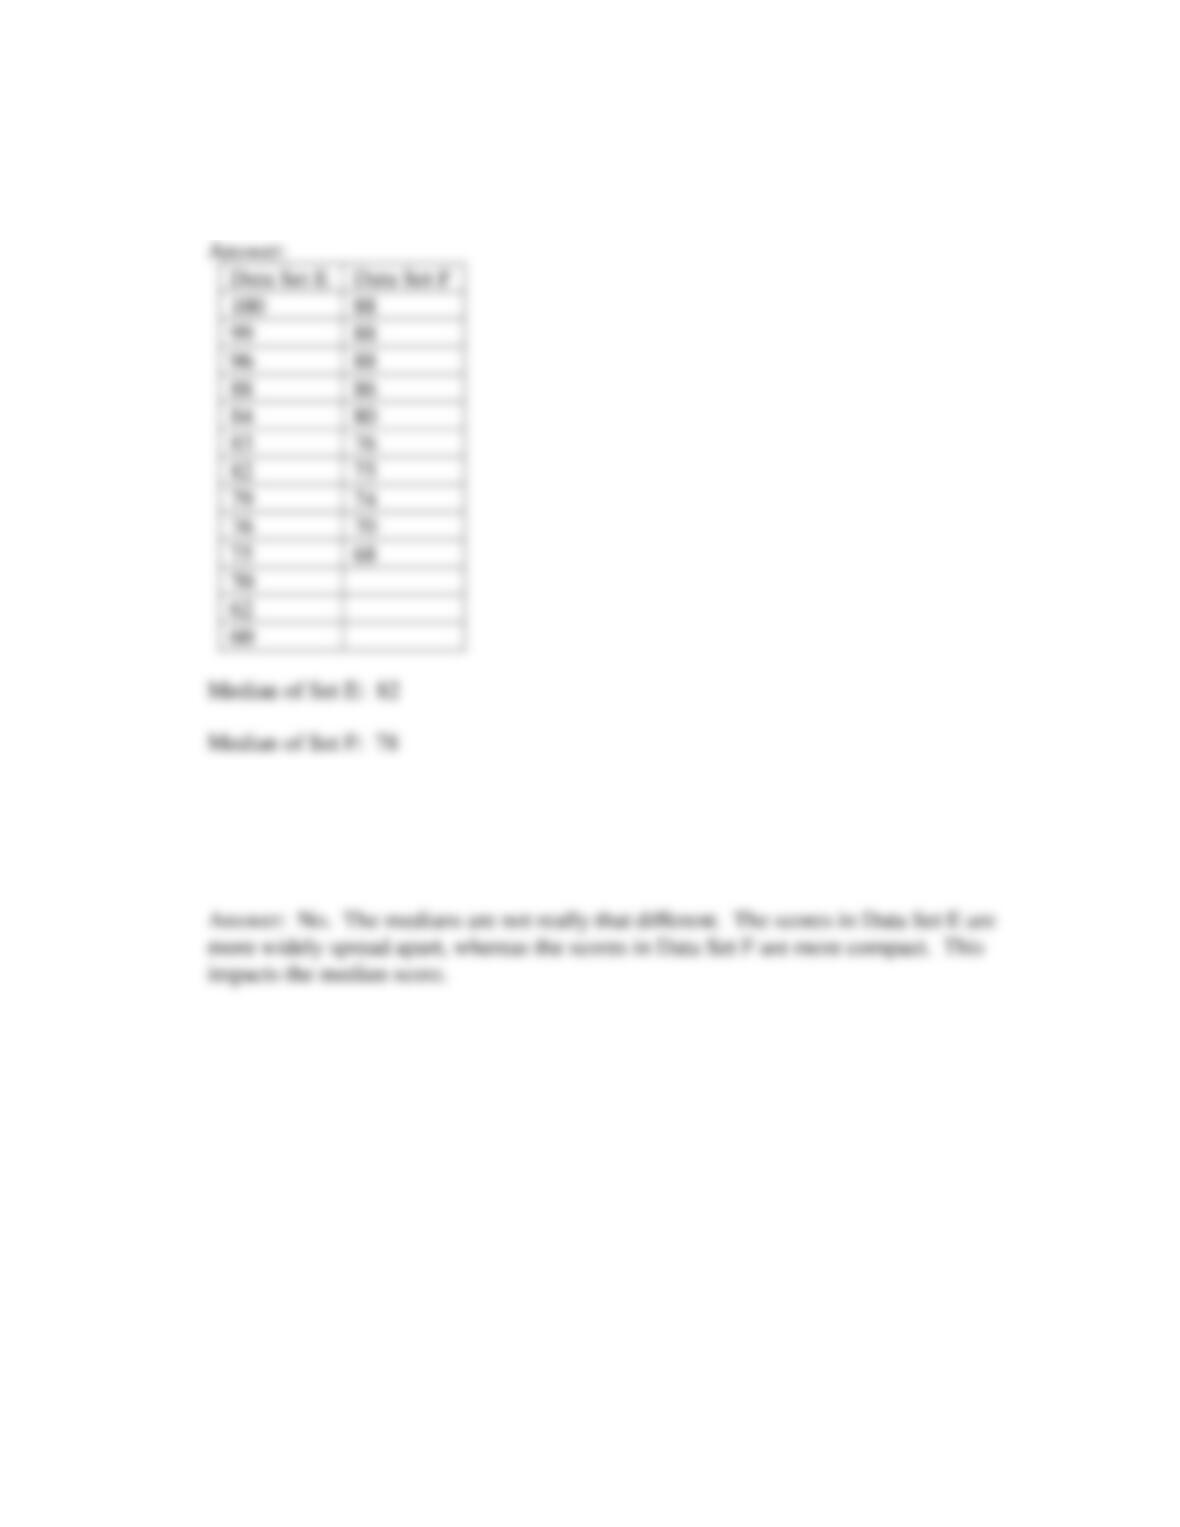
Find the median for the following sets of data.
Apply Your Knowledge
Data Set E has a higher median. Did the students represented by Data Set E perform significantly
better than the students represented by Data Set F? Explain your answer.
Activity 3.6
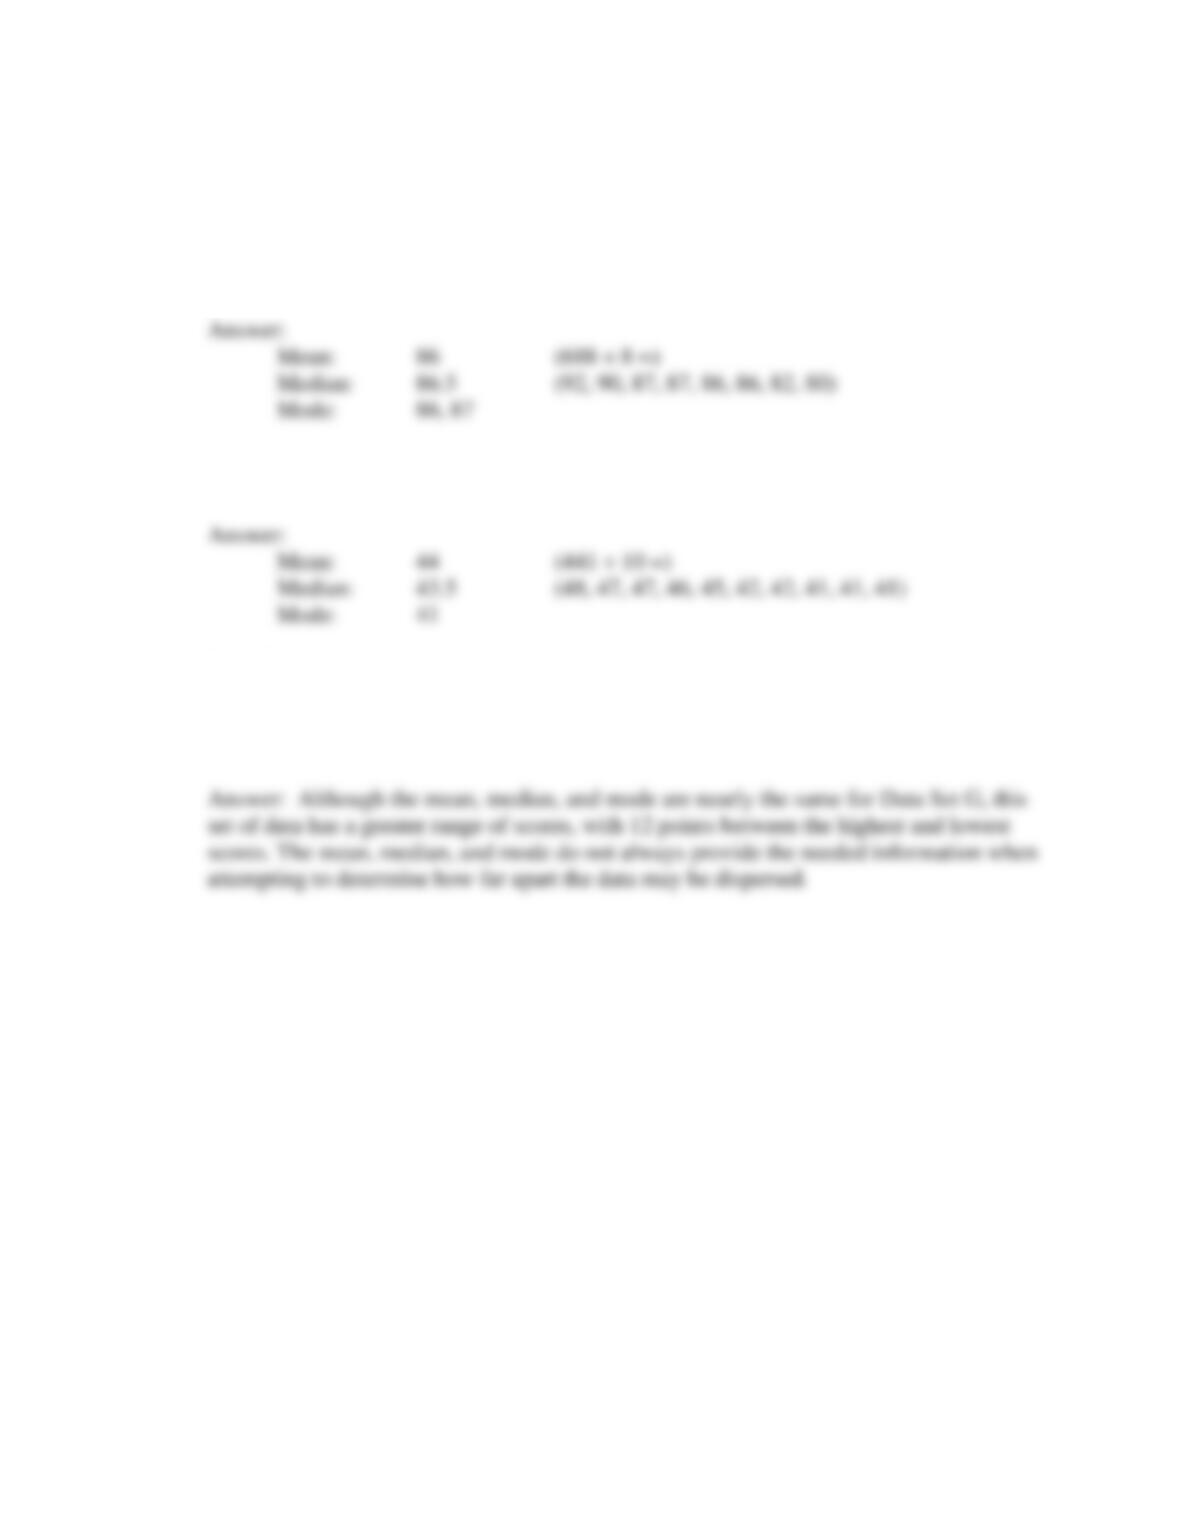
Find the mean, median, and mode for each set of data.
Data Set G
90, 86, 80, 87, 86, 82, 87, 92
Data Set H
41, 42, 45, 42, 46, 47, 48, 47, 41, 41
Apply Your Knowledge
Using the mean, median, and mode you obtained for Data Sets G and H, can you determine
which group of students performed in a more similar manner as a group? Explain your answer.
Activity 3.7
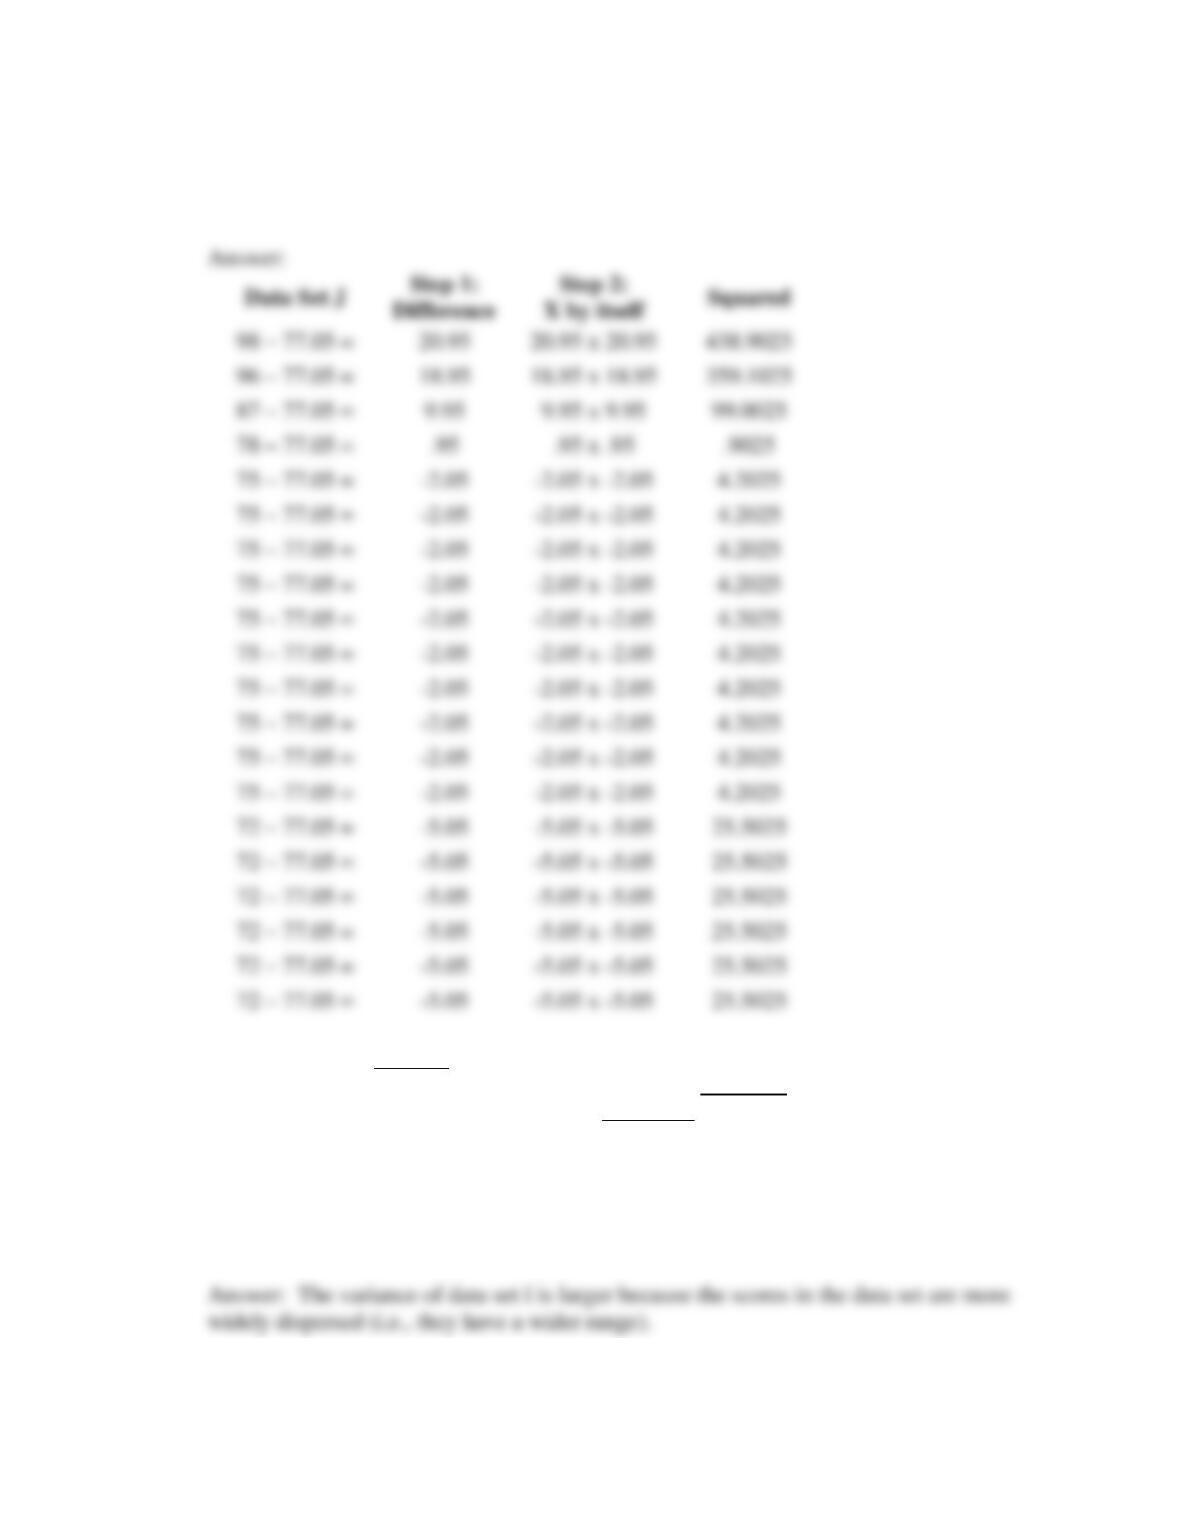
Calculate the variance for Data Set J and compare it with that of Data Set I.
Step 3: Sum of squares: 1092.95
Step 4: Divide the sum of squares by the number of scores: 54.6475 (1092.95 ÷ 20 =)
Which set of data, J or I, has the larger variance? Data Set I
Apply Your Knowledge
Data Sets I and J have means that are very similar. Why do you think there is such a large
difference between the variance of I and the variance of J?
Activity 3.8
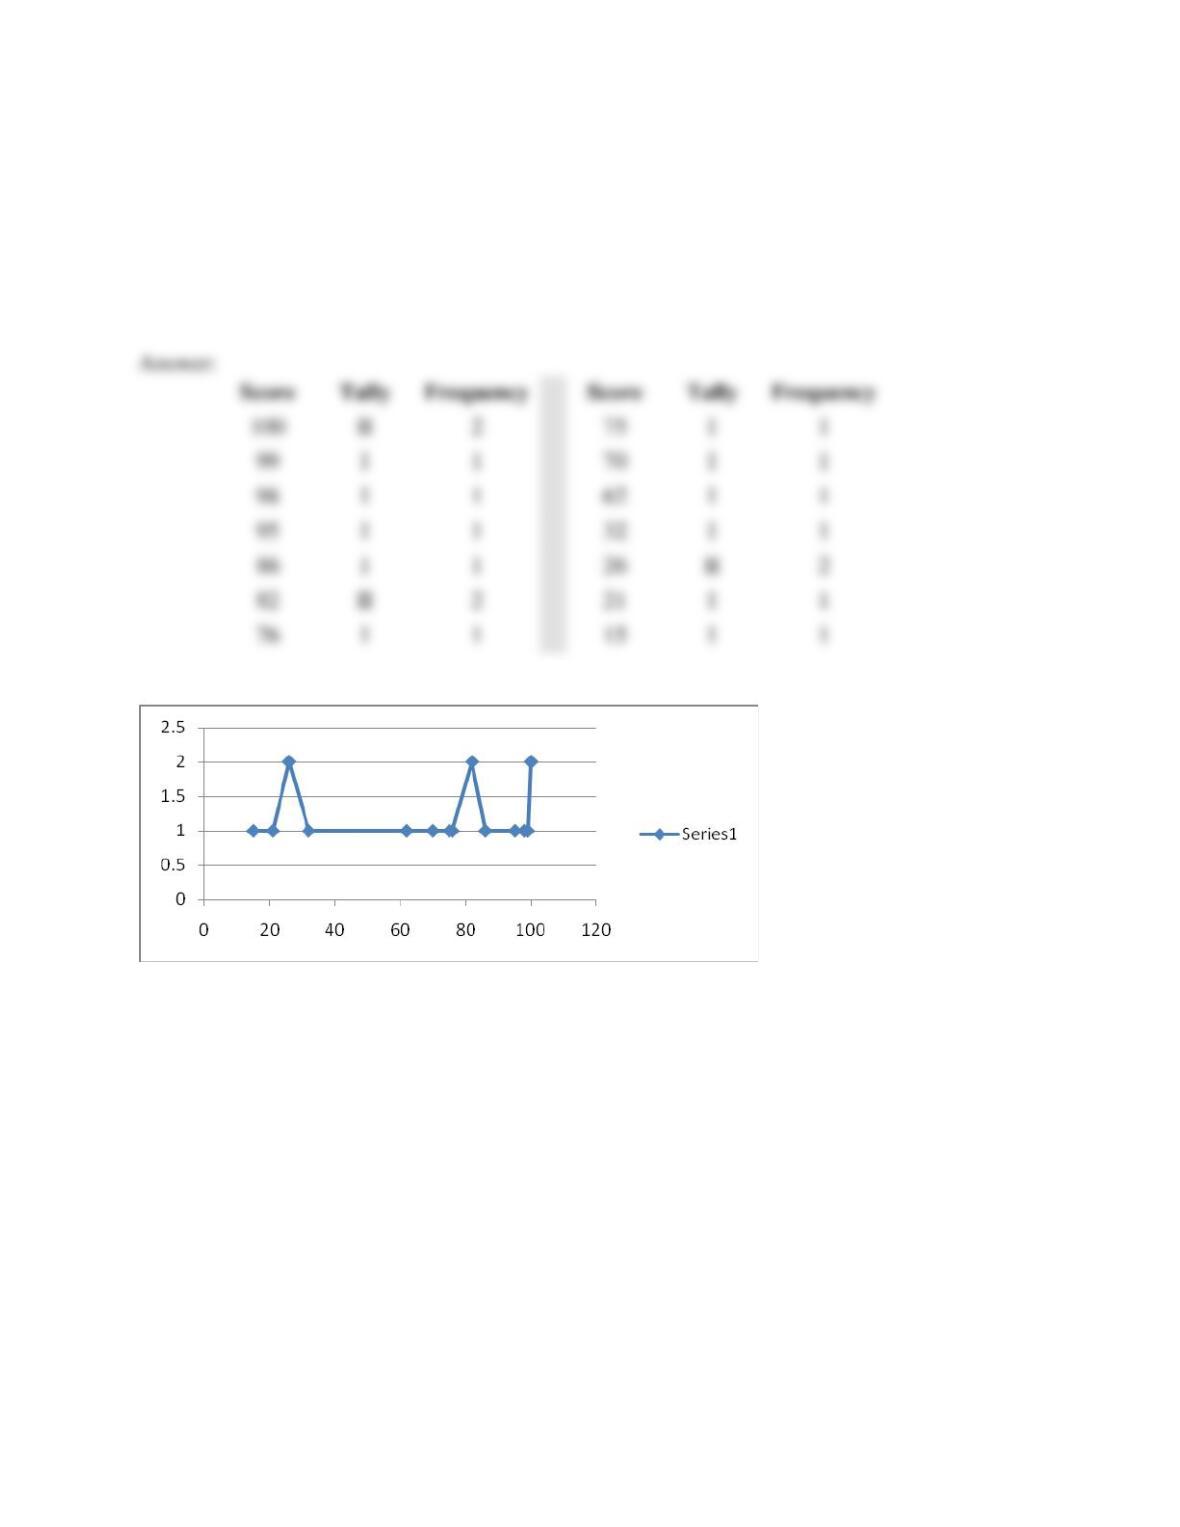
Using the following sets of data, complete a frequency count and a frequency polygon.
Calculate the mean, median, and mode. Calculate the range, variance, and standard deviation.
List the scores that are a significant distance from the mean.
Ms. Jones’s Class Data
95, 82, 76, 75, 62, 100, 32, 15, 100, 98, 99, 86, 70, 26, 21, 26, 82
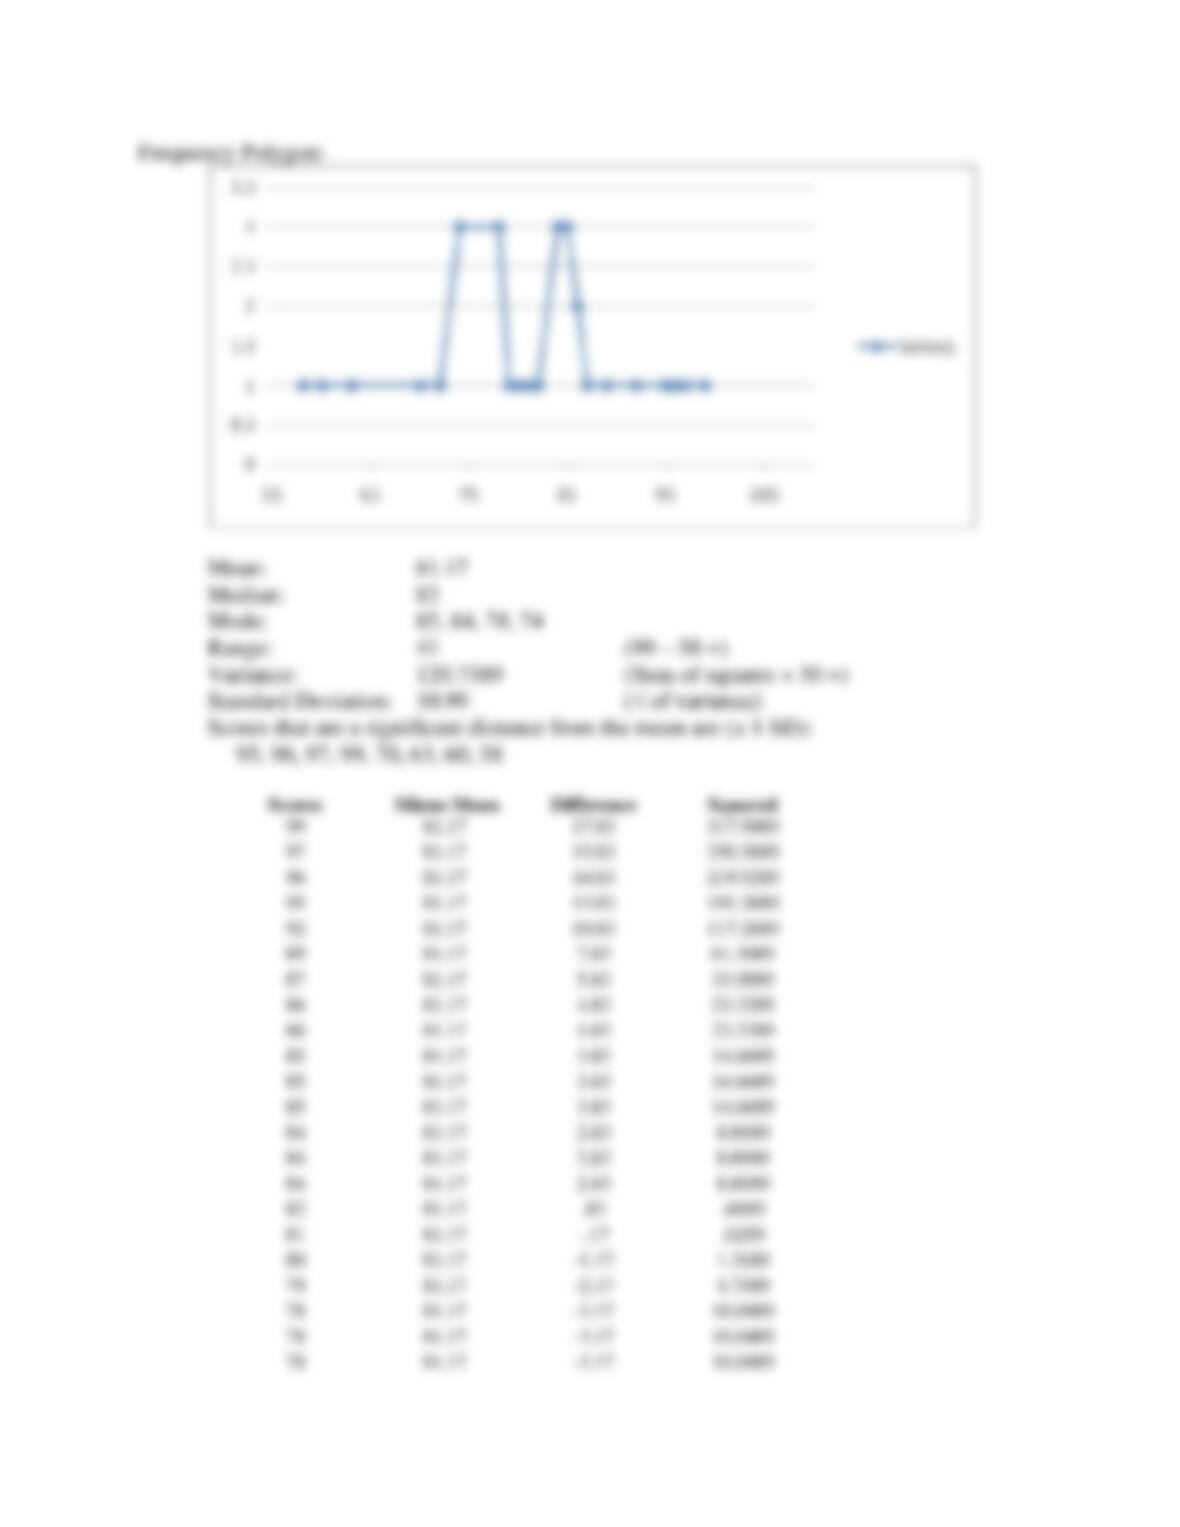
Frequency Polygon:
Mean: 67.35
Median: 76
Mode: 100, 82, 26
Range: 85
Variance: 902.46
Standard Deviation: 30.04
Test scores that are a significant distance from the mean are (± 1 SD):
100, 99, 98, 32, 26, 21, 15
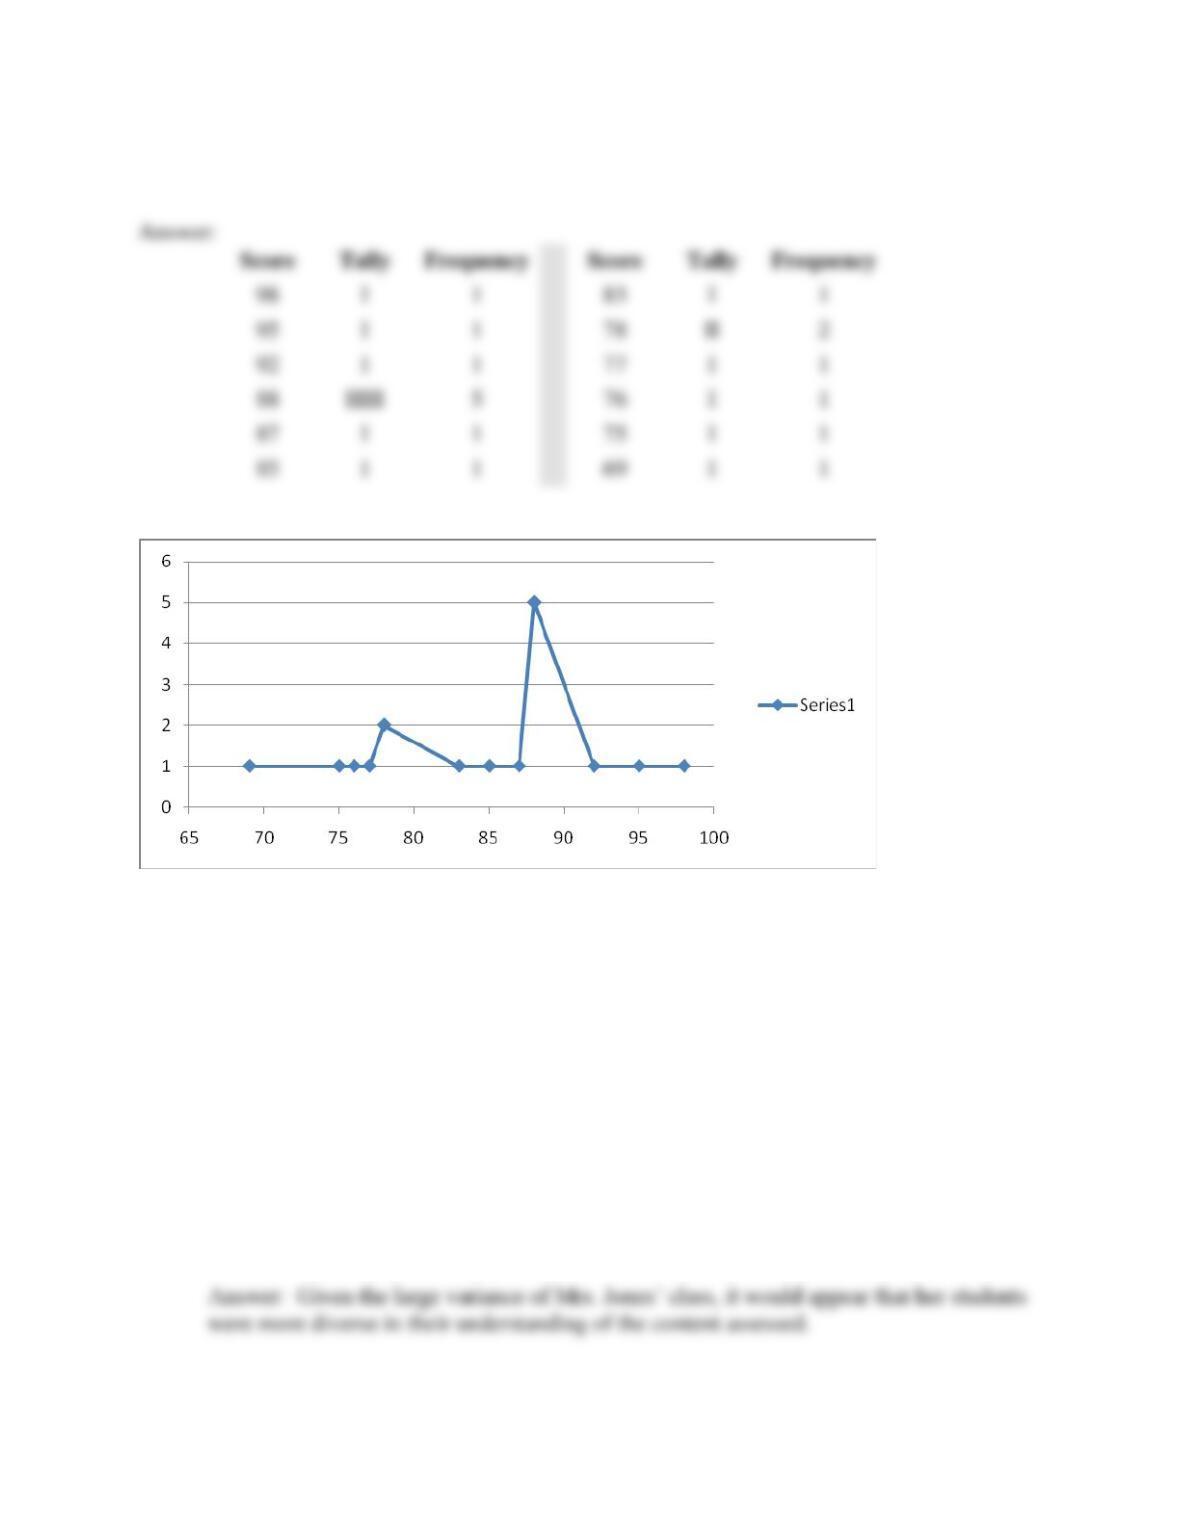
Mrs. Smith’s Class Data
76, 75, 83, 92, 85, 69, 88, 87, 88, 88, 88, 88, 77, 78, 78, 95, 98
Frequency Polygon
Mean: 84.29
Median: 88
Mode: 88
Range: 29
Variance: 56.56
Standard Deviation: 7.52
Test scores that are a significant distance from the mean are (± 1 SD): 92, 95. 98, 75, 69
Apply Your Knowledge
Using the information you obtained through your calculations, what can you say about the
performance of the students in Ms. Jones’s class compared with the performance of the students
in Mrs. Smith’s class?

Think Ahead Exercises
Part I
1. In this set of data, what measures of central tendency are represented by the number 77?
65, 66, 82, 95, 77.
2. If the heights of all fifth-grade elementary students in one large city were measured, in
what manner would the resulting data be displayed?
3. Why is the following set of data interesting? 22, 47, 88, 62, 65, 22, 63, 89, 55, 74, 88, 99,
44, 65, 100.
4. In a university, all students are given a new student identification number upon
registration. These numbers are on what scale?
5. All fourth-grade students in a Little City School were asked to participate in a reading
contest to see which students could read the most books in a three-month period. At the
end of the three months, the winners were determined. The ten students who read the
most books were awarded prizes. On the final day of the contest, the students anxiously
looked at the list where the names were in___, from the highest number of books read to
the lowest.
6. The mean, median, and mode make up ___.
7. A seventh-grade pre-algebra class completed the first test of the new school year. Here
are the data resulting from the first test: 100, 99, 95, 90, 89, 85, 84, 82, 81, 80, 79, 78, 77,
76, 70, 68, 65, 62, 60, 59, 55. In this set of data, what does the number 45 represent?
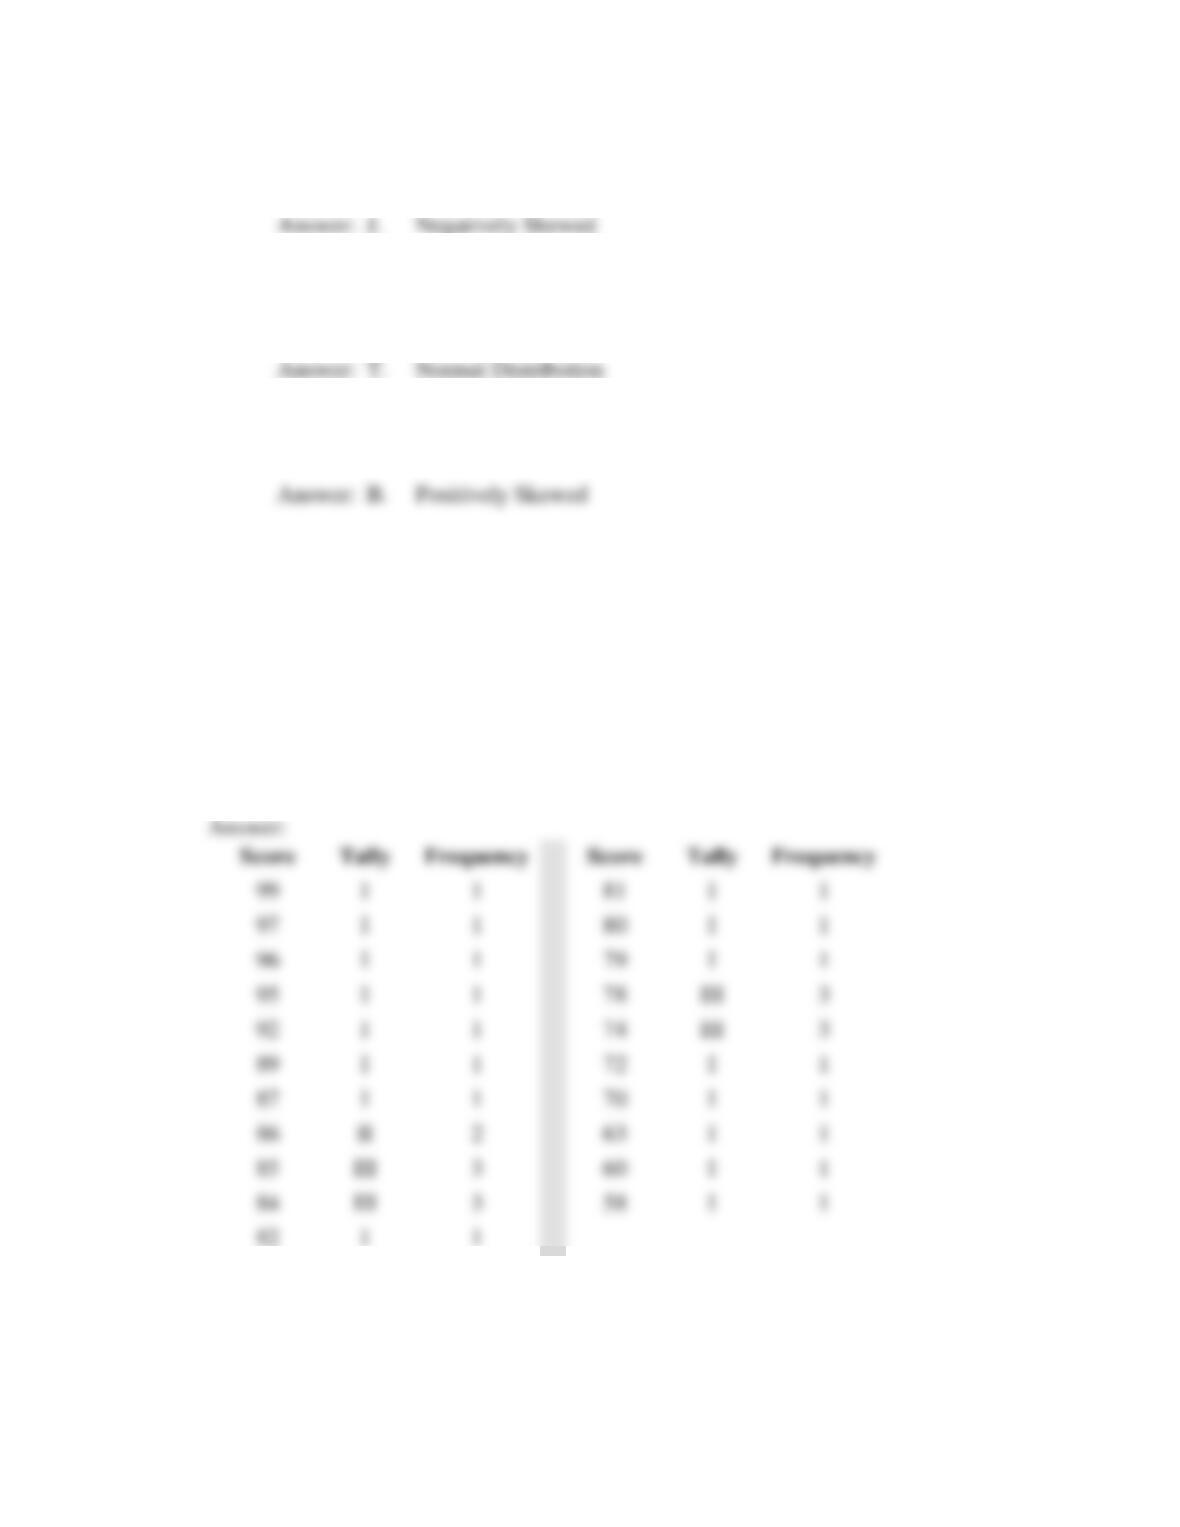
8. The following set of data has what type of distribution? 88, 33, 78, 56, 44, 37, 90, 99, 76,
78, 77, 62, 90?
9. A set of data has a symmetrical distribution of scores with the mean, median, and mode
represented by the number 82. This set of data represents a ___.
10. What term describes a set of data in which the mean is less than the most frequently
occurring scores?
Part II
1. Rank order the following data. Complete a frequency distribution and a frequency
polygon. Calculate the mean, median, and mode. Find the range, variance, and standard
deviation. Identify scores that are significantly above or below the mean.
Data Set:
85, 85, 99, 63, 60, 97, 96, 95, 58, 70, 72, 92, 89, 87, 74, 74, 74, 85, 84, 78, 84, 78, 84, 78,
86, 82, 79, 81, 80, 86