Chapter 3: Displaying and Describing Quantitative Data – Quiz A
Name_________________________
3.1.1 Find summary statistics; create displays; describe distributions; determine
appropriate measures.
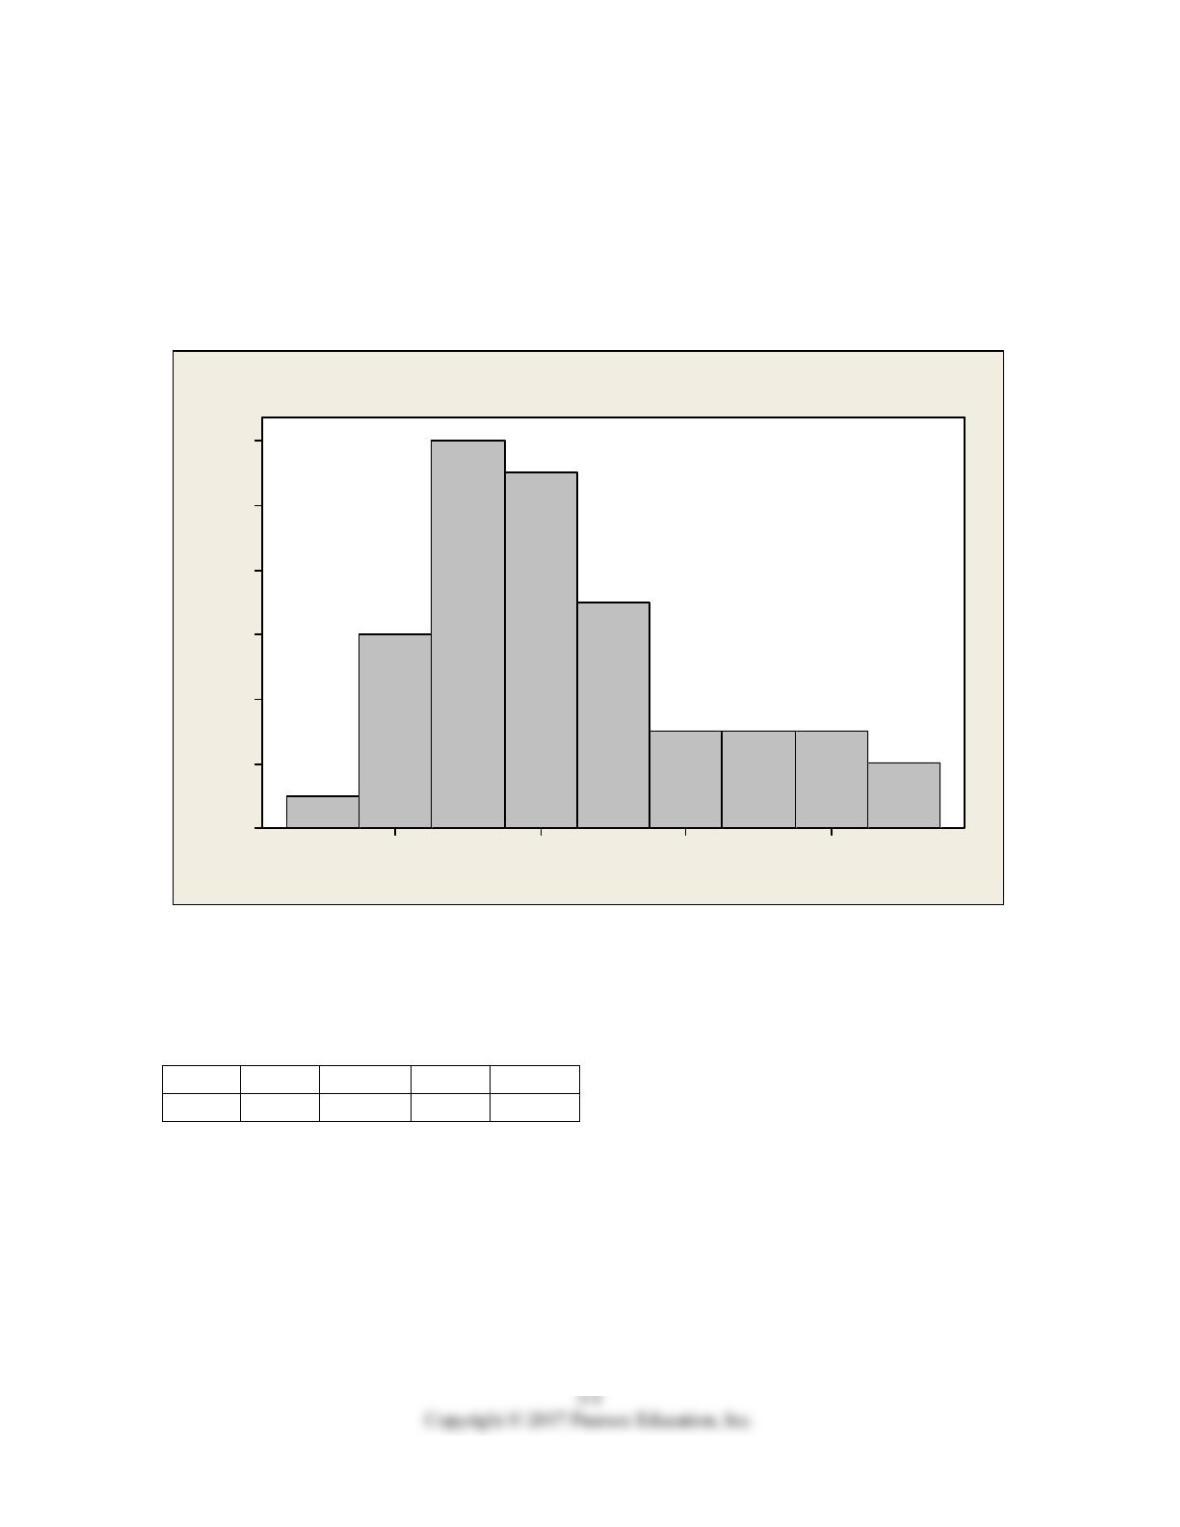
1. Following is a histogram of salaries (in $) for a sample of U.S. marketing managers.
Comment on the shape of the distribution.
1200001000008000060000
12
10
8
6
4
2
0
Mktg Manager Salaries
Fr e que nc y
Histogram of Mktg Manager Salaries
3.7.1 Find summary statistics; create displays; describe distributions; determine
appropriate measures.
2. Following is the five-number summary of salaries (in $) for a sample of U.S.
marketing managers displayed in question 1.
Min Q1 Median Q3 Max
46360 69693 77020 91750 129420
a. Would you expect the mean salary for this sample of marketing managers to be higher
or lower than the median? Explain.
b. Which would be a more appropriate measure of central tendency for these data, the
mean or median? Explain.
c. Calculate the range.
d. Calculate the IQR.

3-2 Chapter 3 Displaying and Describing Quantitative Data
3.1.1 Find summary statistics; create displays; describe distributions; determine
appropriate measures.
3. Suppose the marketing manager who was earning $129,420 got a raise and is now
earning $140,000. Indicate how this change would affect the following summary
statistics (increase, decrease, or stay about the same):
a. Mean
b. Median
c. Range
d. IQR
e. Standard deviation
3.1.1 Find summary statistics; create displays; describe distributions; determine
appropriate measures.
4. The following table shows data on total assets ($ billion) for a small sample of U.S.
banks. Prepare a stem and leaf display. Comment on the shape of the distribution.
BANK ASSETS ($ billion)
State Street Bank and Trust 160.5
Discover Bank 63.9
BancWest 72.8
Citizens Bank 130.0
Northern Trust 83.8
Huntington Bank 53.8
Key Bank 91.8
People’s United 27.9
3.6.2 Standardize values and use them for comparisons of otherwise disparate variables.
5. For the data on total assets ($ billion) for a small sample of U.S. banks provided in the
previous question:
a. Calculate the mean.
b. Calculate the standard deviation.
c. Standardize the asset value of State Street Bank and Trust (find the z score). Interpret
its meaning.
Quiz A 3-3
3.7.1 Find summary statistics; create displays; describe distributions; determine
appropriate measures.
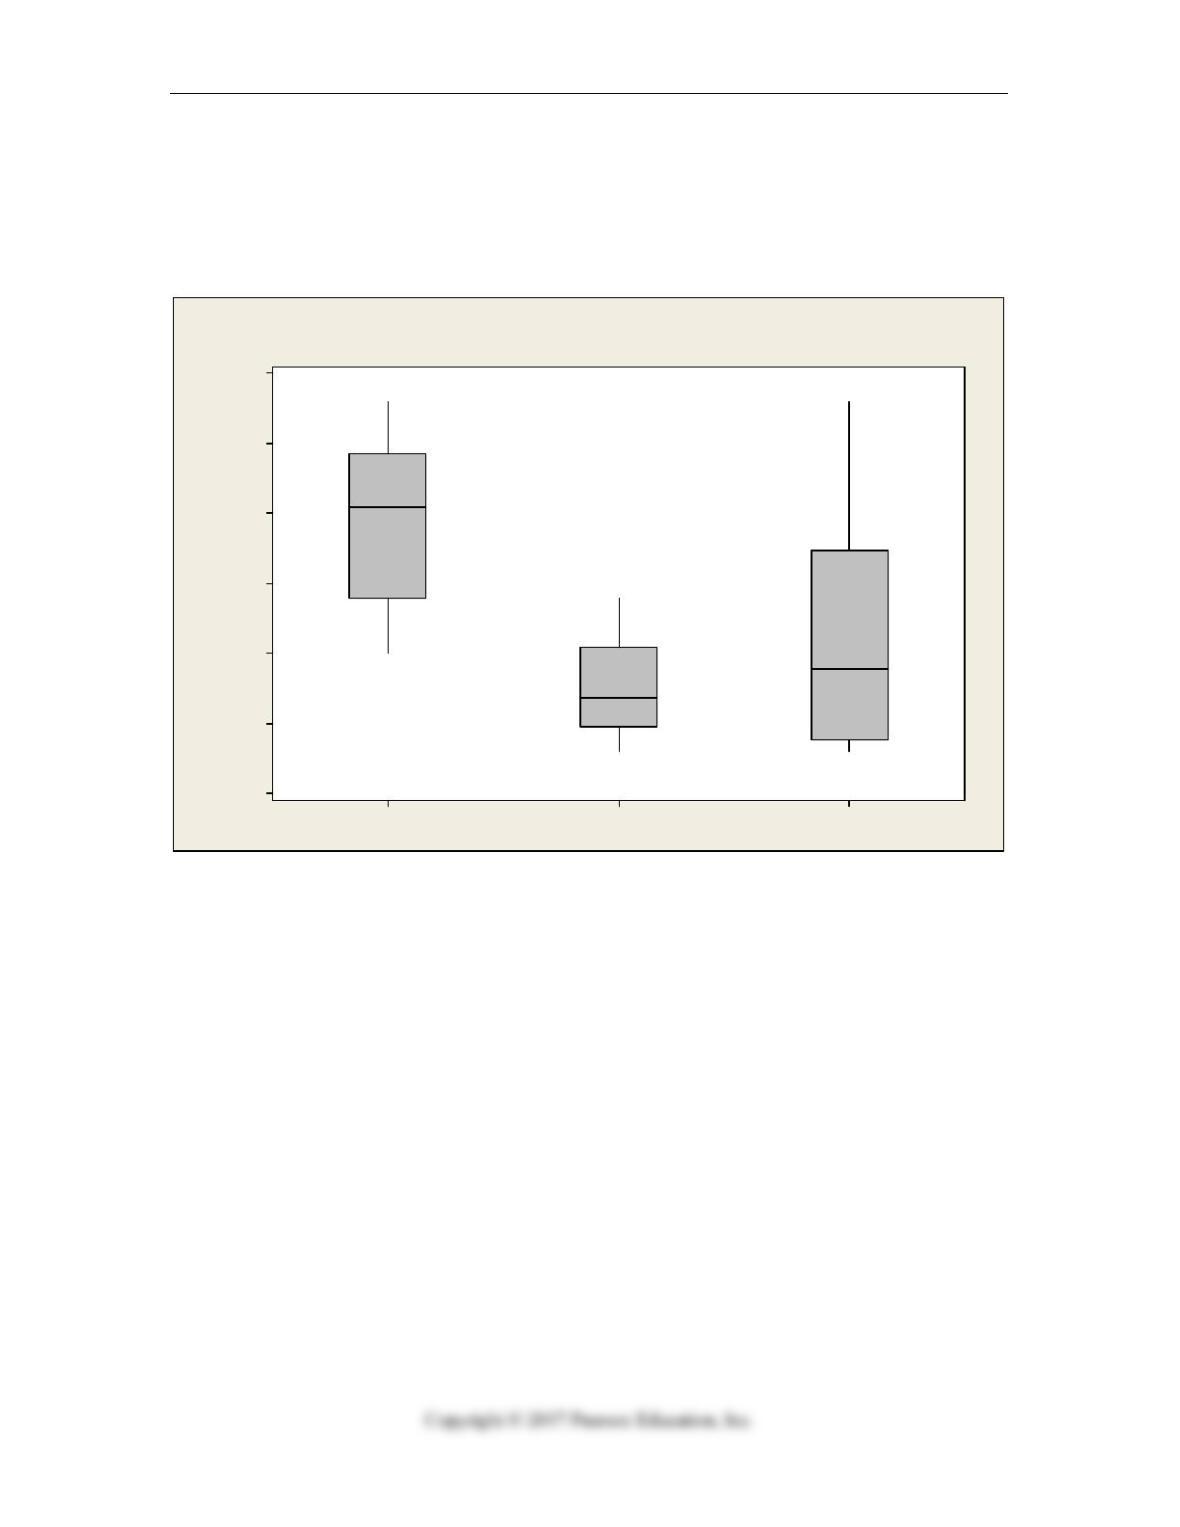
6. The following boxplots show monthly sales revenue figures ($ thousands) for a
discount office supply company with locations in three different regions of the U.S.
(Northeast, Southeast, and West).
WestSoutheastNortheast
200
175
150
125
100
75
50
Dat a
Boxplot of Northeast, Southeast, West
a. Which region has the highest median sales revenue?
b. Which region has the lowest median sales revenue?
c. Which region has the most variable sales revenue values? Explain.
3-4 Chapter 3 Displaying and Describing Quantitative Data
Chapter 3: Displaying and Describing Quantitative Data – Quiz A – Key
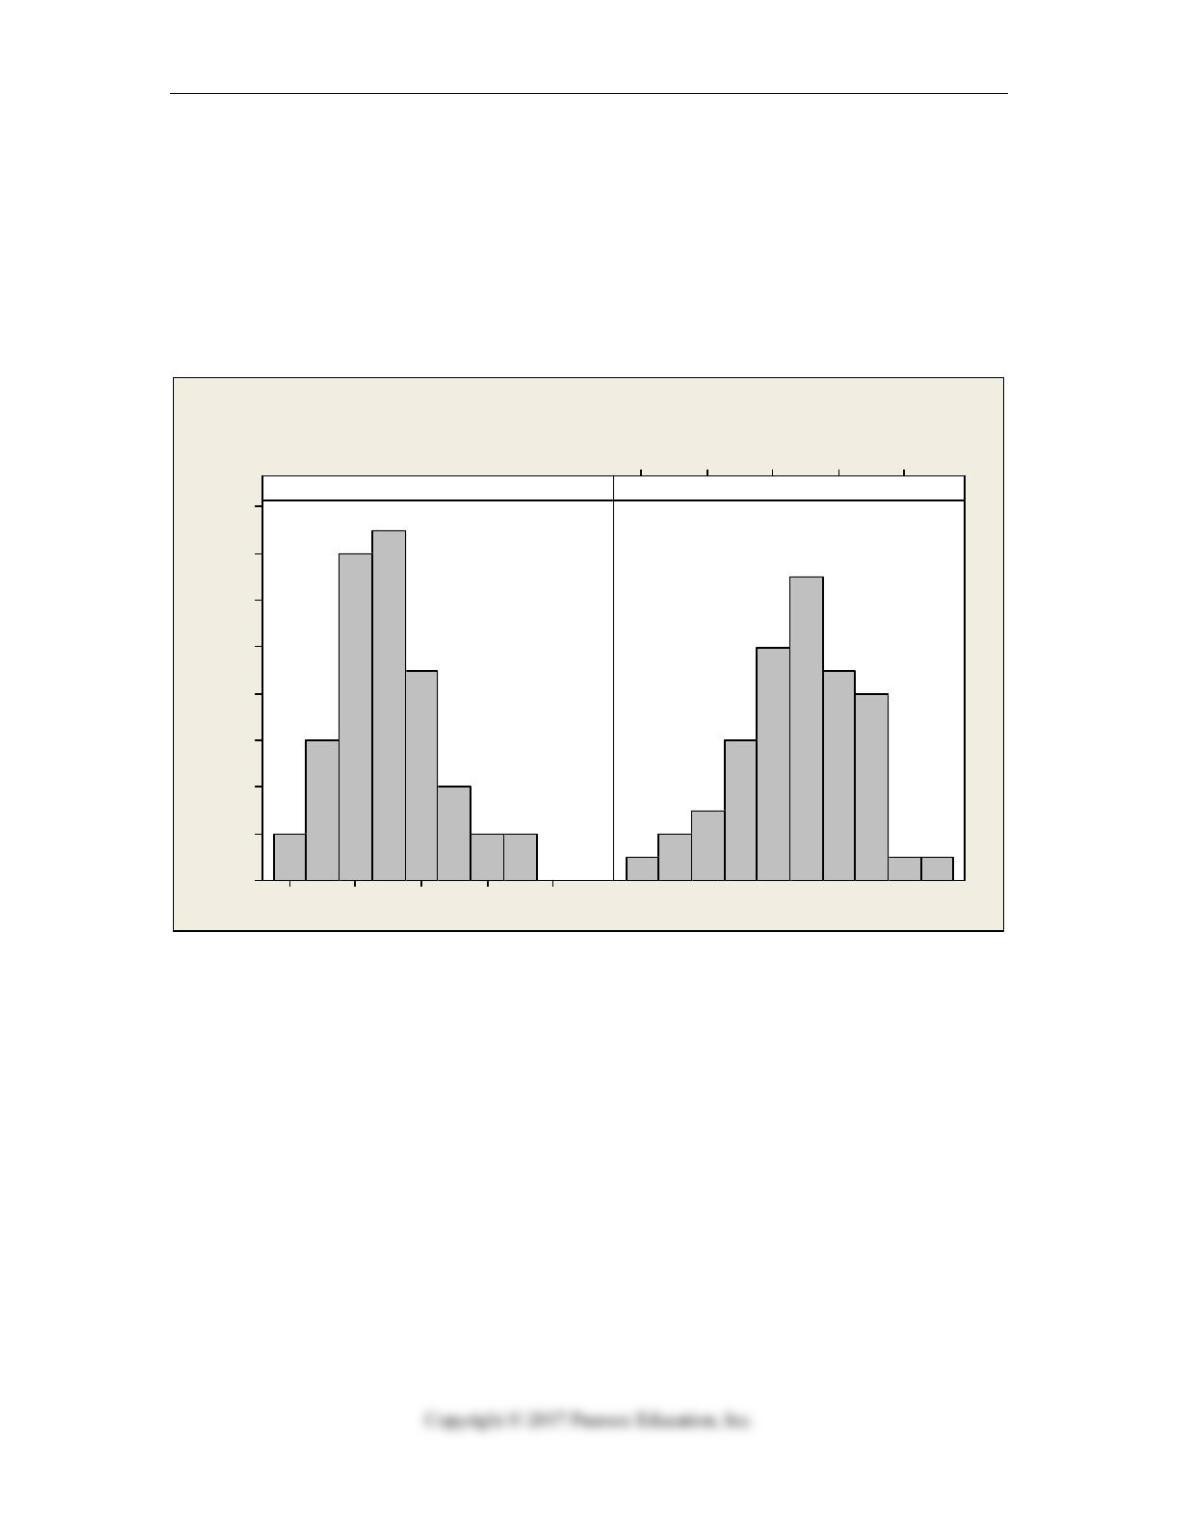
1. Following is a histogram of salaries (in $) for a sample of U.S. marketing managers.
Comment on the shape of the distribution.
2. Following is the five-number summary of salaries (in $) for a sample of U.S.
marketing managers displayed in question 1.
Min Q1 Median Q3 Max
46360 69693 77020 91750 129420
Quiz A 3-5
3. Suppose the marketing manager who was earning $129,420 got a raise and is now
earning $140,000. Indicate how this change would affect the following summary
statistics (increase, decrease, or stay about the same):
4. The following table shows data for total assets ($ billion) for a small sample of U.S.
banks (late 2013). Prepare a stem and leaf display. Comment on the shape of the
distribution.
3-6 Chapter 3 Displaying and Describing Quantitative Data
Stem-and-Leaf Display: ASSETS ($ billion)
5. For the data on total assets ($ billion) for a small sample of U.S. banks provided in the
previous question:
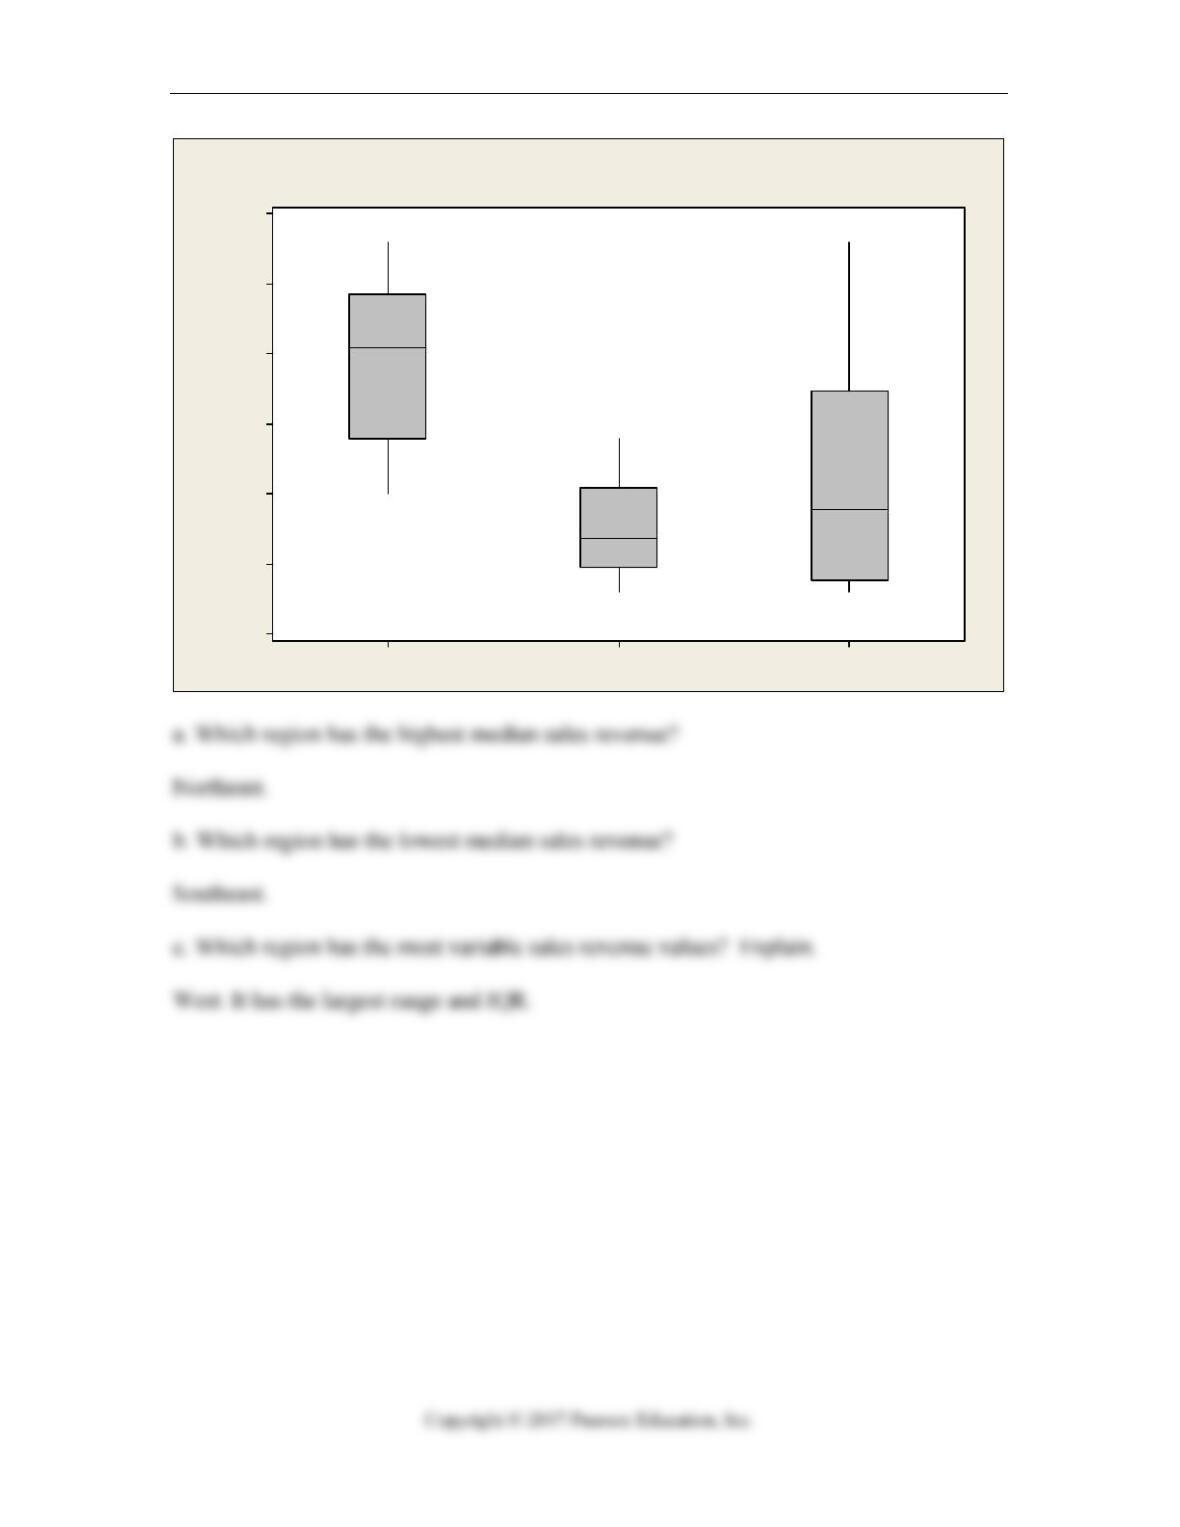
6. The following boxplots show monthly sales revenue figures ($ thousands) for a
discount office supply company with locations in three different regions of the U.S.
(Northeast, Southeast, and West).
Quiz A 3-7
WestSoutheastNortheast
200
175
150
125
100
75
50
Dat a
Boxplot of Northeast, Southeast, West
3-8 Chapter 3 Displaying and Describing Quantitative Data
Chapter 3: Displaying and Describing Quantitative Data – Quiz B
Name_________________________
3.2.1 Find summary statistics; create displays; describe distributions; determine
appropriate measures.
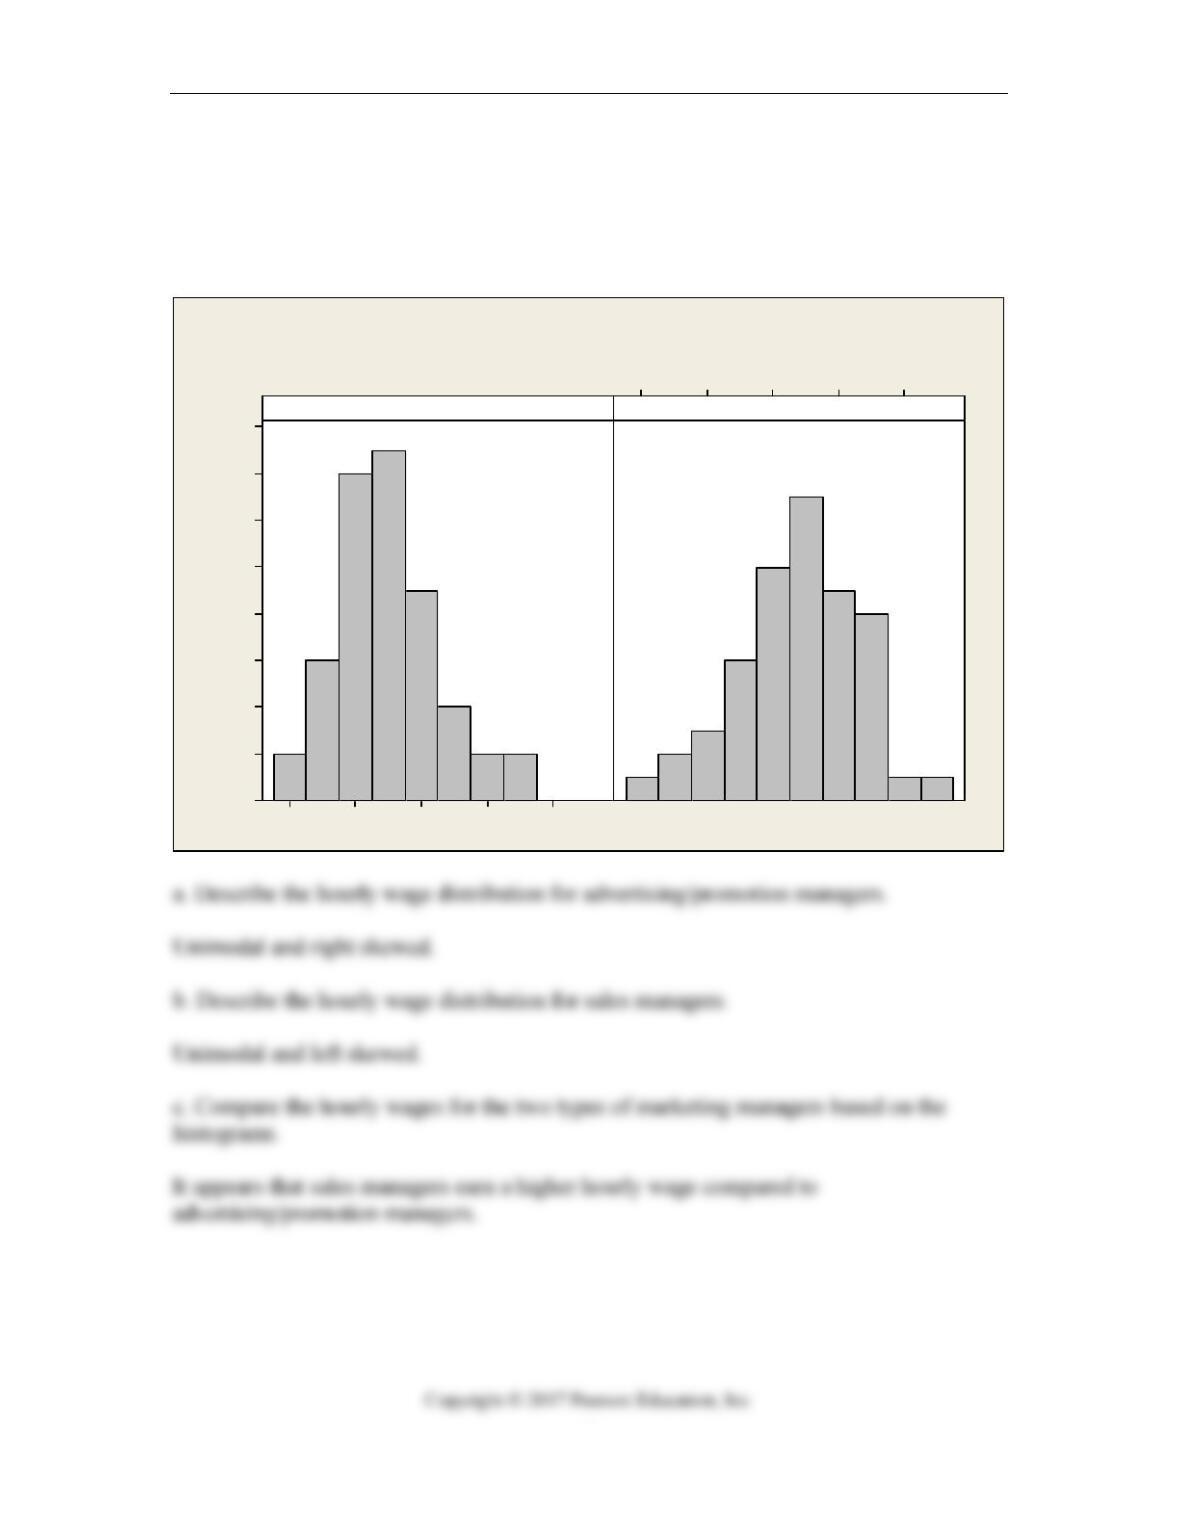
1. Data were collected on the hourly wage ($) for two types of marketing managers: (1)
advertising / promotion managers and (2) sales managers. The results were used to create
the following histograms.
6050403020
16
14
12
10
8
6
4
2
0
6050403020
Advertising/Promotion Hourly
Frequency
Sales Hourly
Histogram of Advertising/Promotion Hourly, Sales Hourly
a. Describe the hourly wage distribution for advertising/promotion managers.
b. Describe the hourly wage distribution for sales managers.
c. Compare the hourly wages for the two types of marketing managers based on the
histograms.

Quiz B 3-9
3.7.1 Find summary statistics; create displays; describe distributions; determine
appropriate measures.
2. Following is the five number summary of the hourly wages ($) for advertising /
promotion managers displayed in question 1.
Min Q1 Median Q3 Max
19.64 29.36 34.18 40.86 57.26
a. Would you expect the mean salary for this sample of marketing managers to be higher
or lower than the median? Explain.
b. Which would be a more appropriate measure of central tendency for these data, the
mean or median? Explain.
c. Calculate the range.
d. Calculate the IQR.
3. Following is the five number summary of the hourly wages ($) for sales managers
displayed in question 1.
Min Q1 Median Q3 Max
20.94 37.64 44.77 49.34 67.11
Suppose there had been an error and that the lowest hourly wage for sales managers was
$18.50 instead of $20.94. Indicate how this change would affect the following summary
statistics (increase, decrease, or stay about the same):
a. Mean
b. Median
c. Range
d. IQR
e. Standard deviation
3-10 Chapter 3 Displaying and Describing Quantitative Data
3.2.1 Find summary statistics; create displays; describe distributions; determine
appropriate measures.
4. The following table shows representative recent closing share prices in late 2013 for a
small sample of companies based in India.
COMPANY CLOSING SHARE PRICE
20 Microns 30.95
ABC Paper 24.30
Bank of MA 36.20
Photoquip 37.00
Saksoft 67.20
Marg LTD 13.99
Galaxy ENT 10.40
Sonatasoft 68.75
EDynamics 49.95
DB Corp. 287.95
a. Calculate the mean.
b. Calculate the standard deviation.
c. Standardize the share price for DP Corp. (find the z score). Interpret its meaning.
Quiz B 3-11
3.7.3 Make and interpret time plots for time series data.
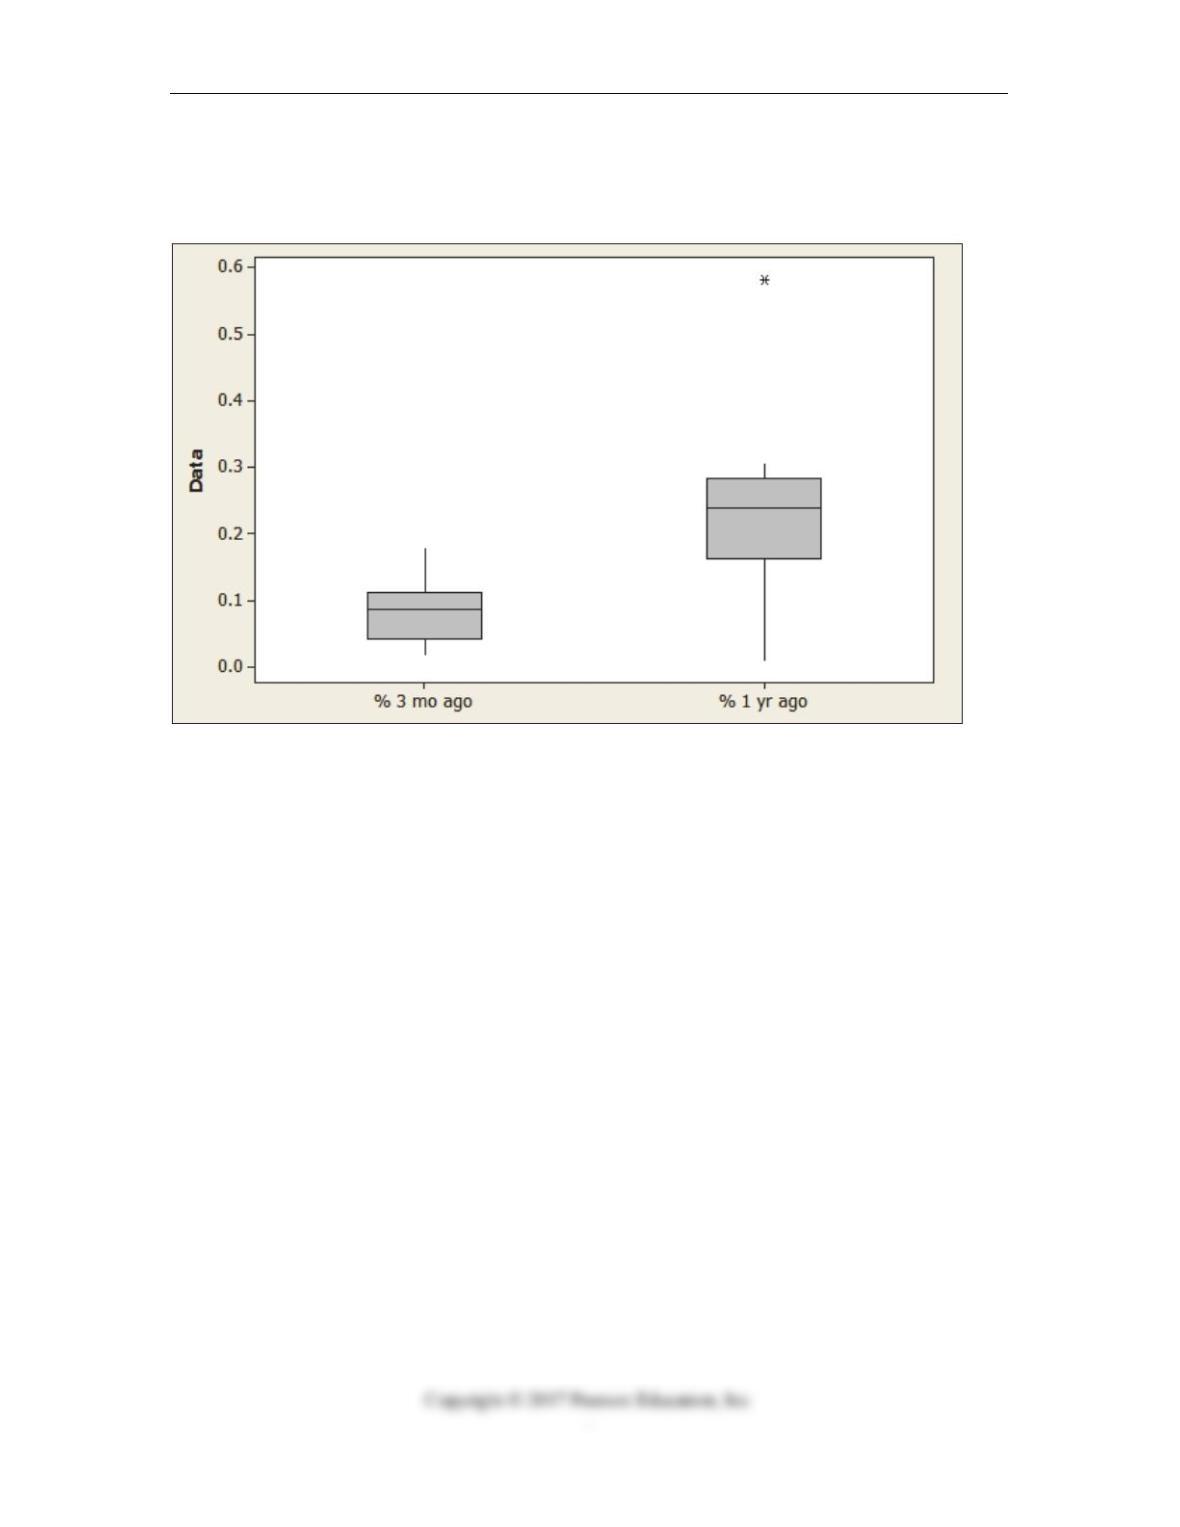
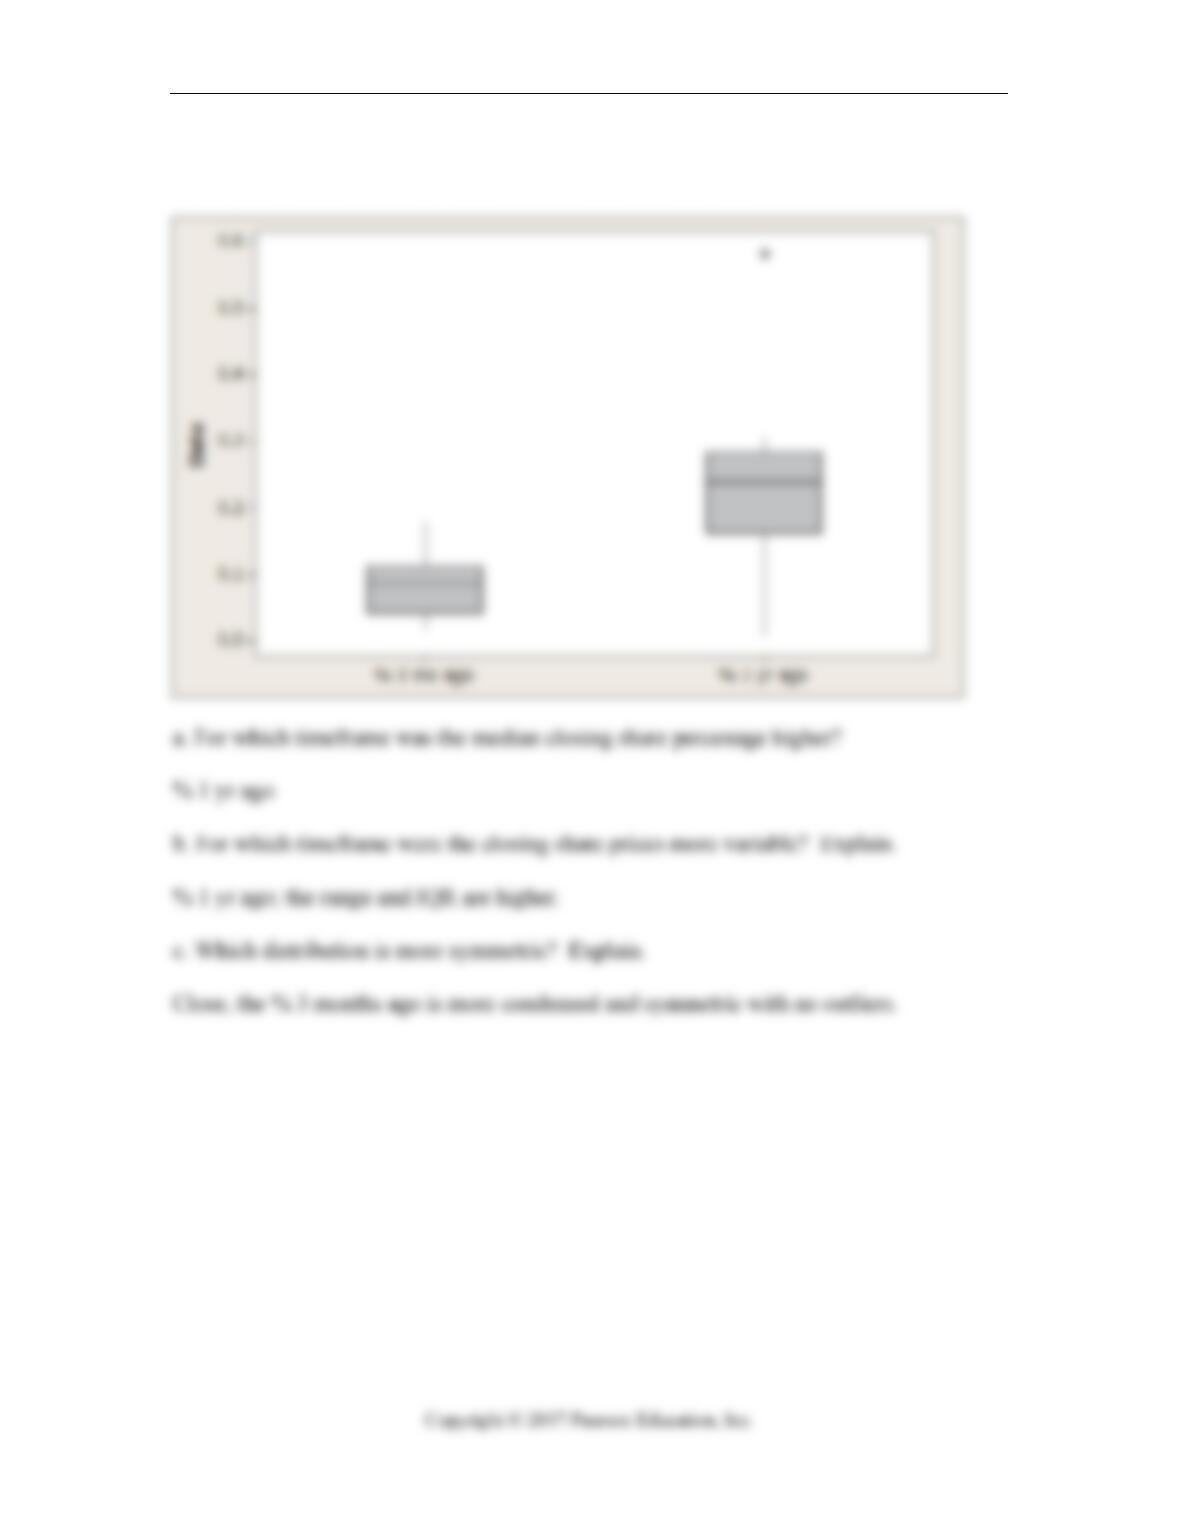
5. The following boxplots show the closing share prices for a sample of oil companies’
percentage change from today and 3 months ago or 1 year ago.
a. For which timeframe was the median closing share percentage higher?
b. For which timeframe were the closing share prices more variable? Explain.
c. Which distribution is more symmetric? Explain.
3-12 Chapter 3 Displaying and Describing Quantitative Data
3.2.1 Make and interpret time plots for time series data.
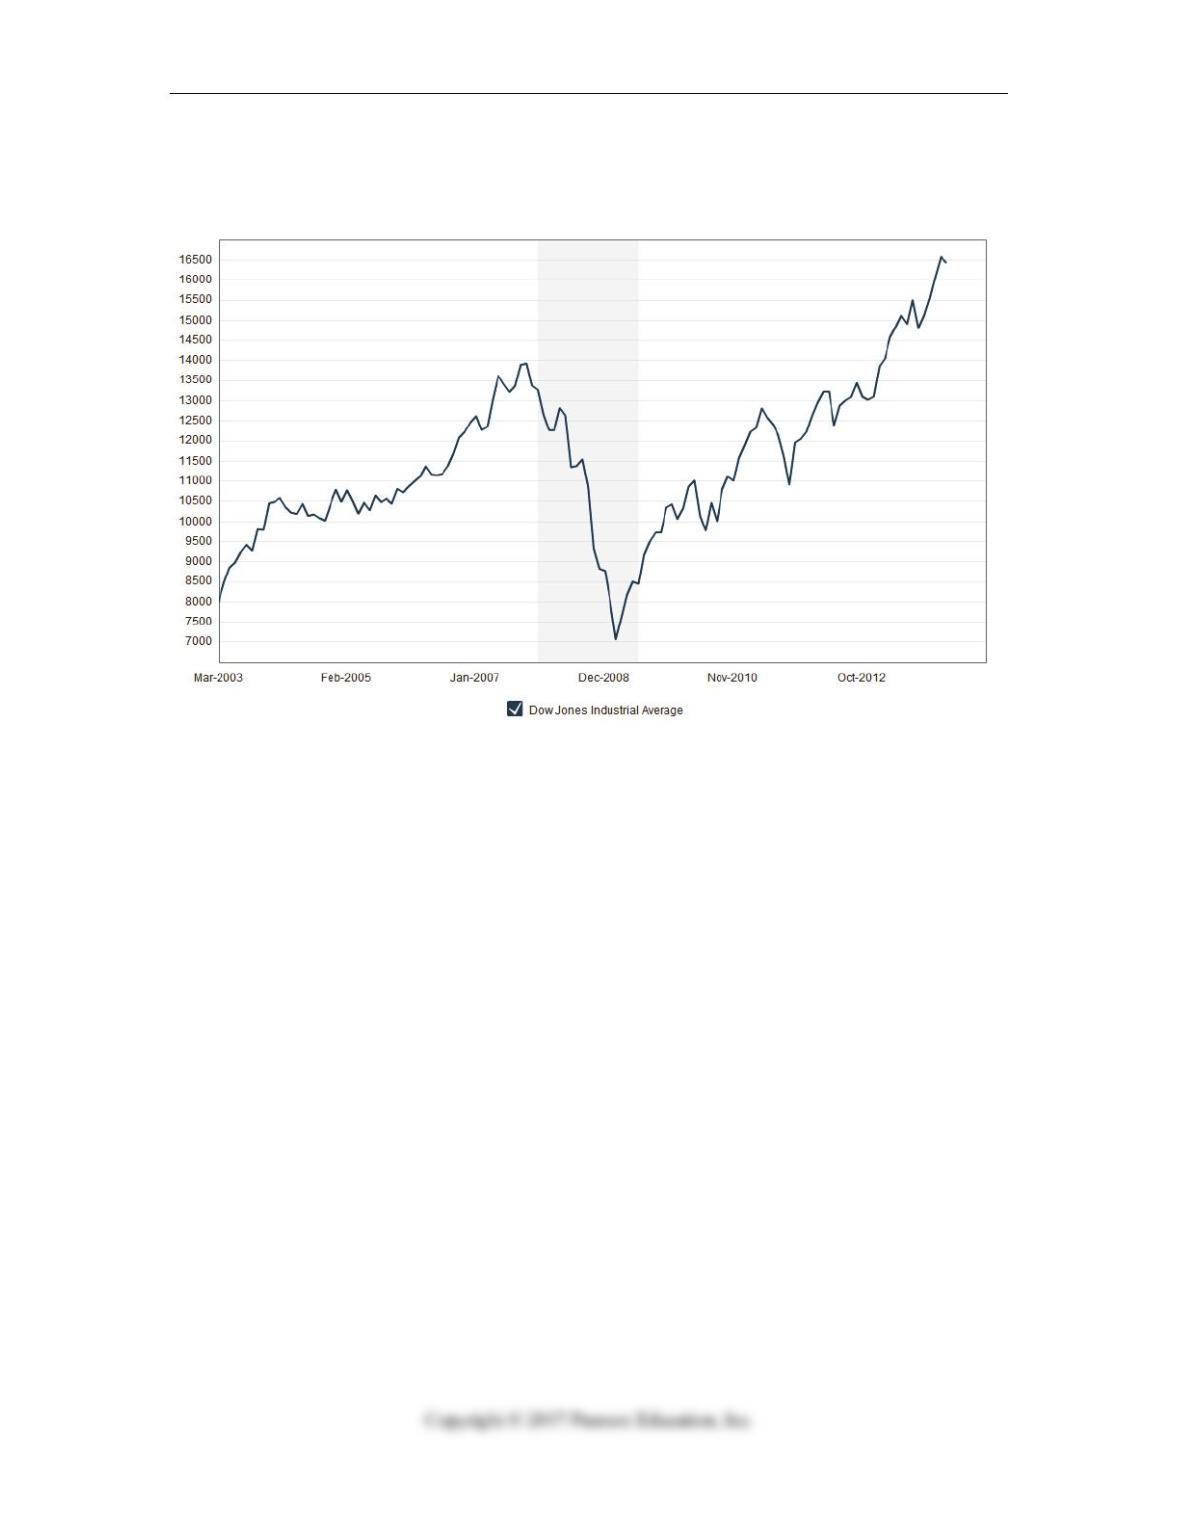
6. Following is a time series graph for monthly closing price for the Dow Jones
Industrial Average (beginning March 2003).
a. Are the closing prices for the Dow Jones Average from October 2004 through
December 2006 fairly stationary? Explain.
b. What was the most volatile period of time for the Dow Jones average? Explain.
c. Would a histogram provide a good summary of these stock prices? Explain.
Quiz B 3-13
.
Chapter 3: Displaying and Describing Quantitative Data – Quiz B – Key
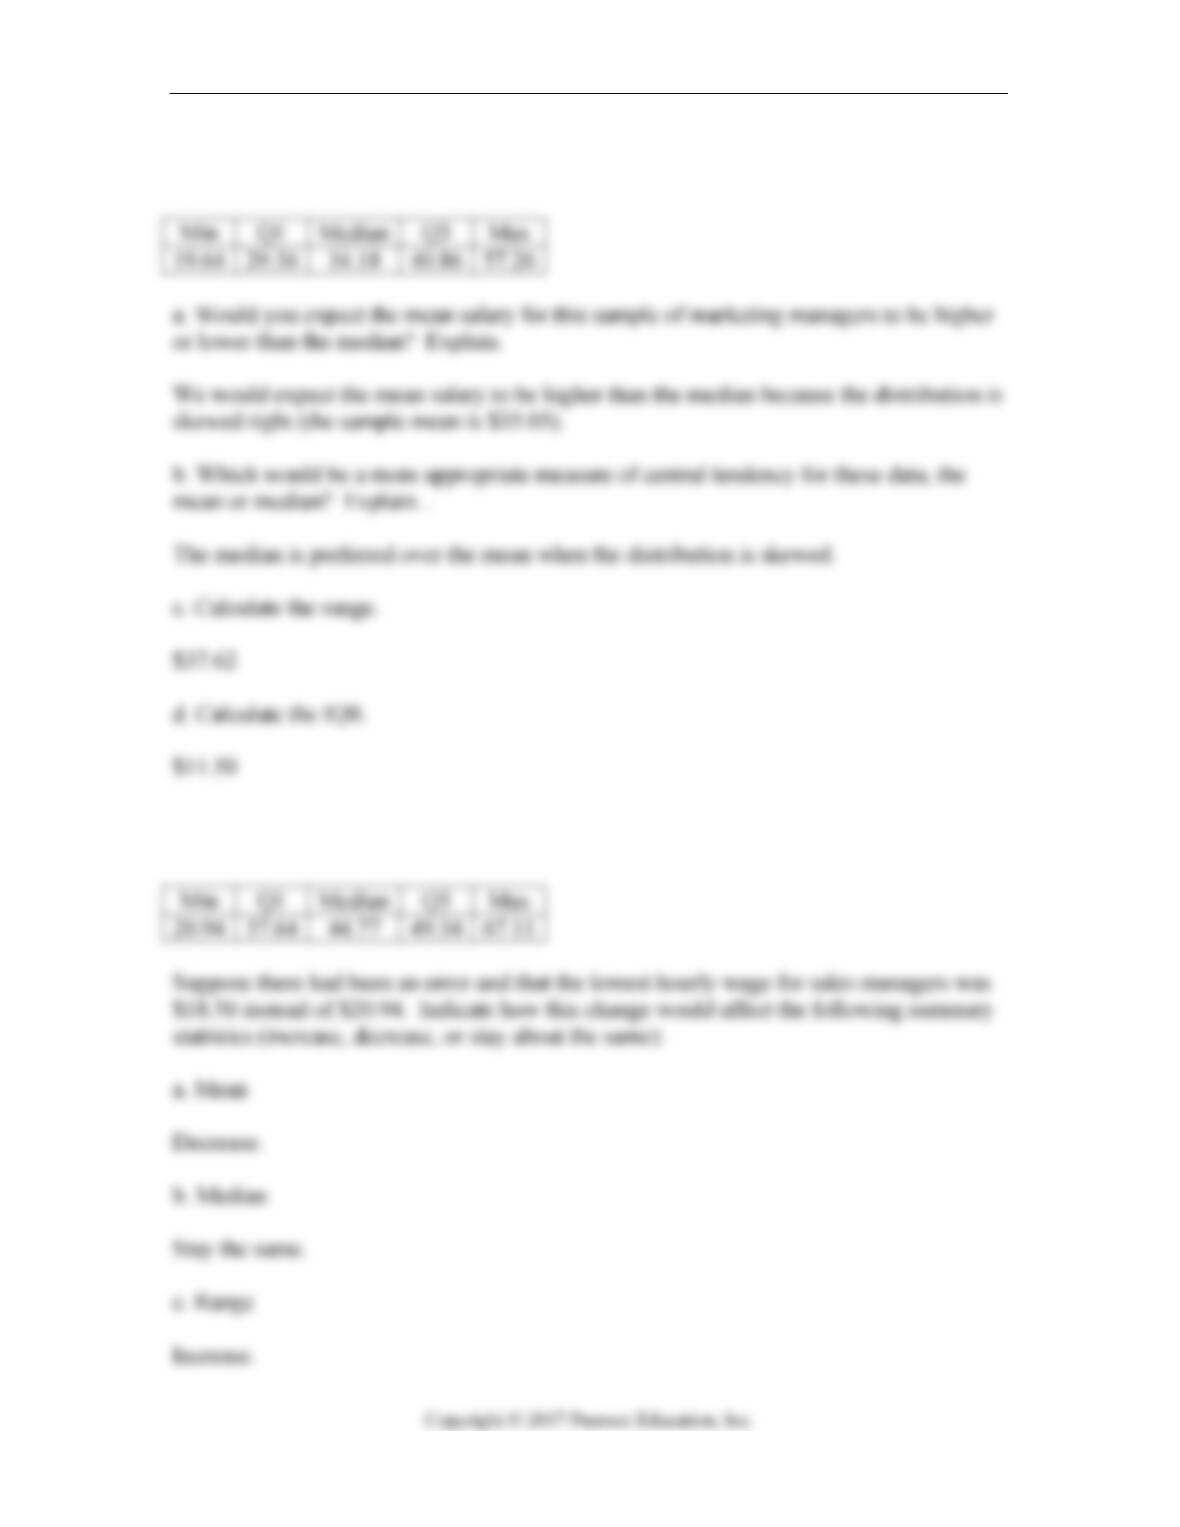
1. Data were collected on the hourly wage ($) for two types of marketing managers: (1)
advertising / promotion managers and (2) sales managers. The results were used to create
the following histograms.
6050403020
16
14
12
10
8
6
4
2
0
6050403020
Advertising/Promotion Hourly
Frequency
Sales Hourly
Histogram of Advertising/Promotion Hourly, Sales Hourly
3-14 Chapter 3 Displaying and Describing Quantitative Data
2. Following is the five number summary of the hourly wages ($) for advertising /
promotion managers displayed in question 1.
3. Following is the five number summary of the hourly wages ($) for sales managers
displayed in question 1.
Quiz B 3-15
4. The following table shows representative recent closing share prices in late 2013 for a
small sample of companies based in India.
3-16 Chapter 3 Displaying and Describing Quantitative Data
5. The following boxplots show the closing share prices for a sample of oil companies’
percentage change from today and 3 months ago or 1 year ago.