Exam
Name___________________________________
MULTIPLE CHOICE. Choose the one alternative that best completes the statement or answers the question.
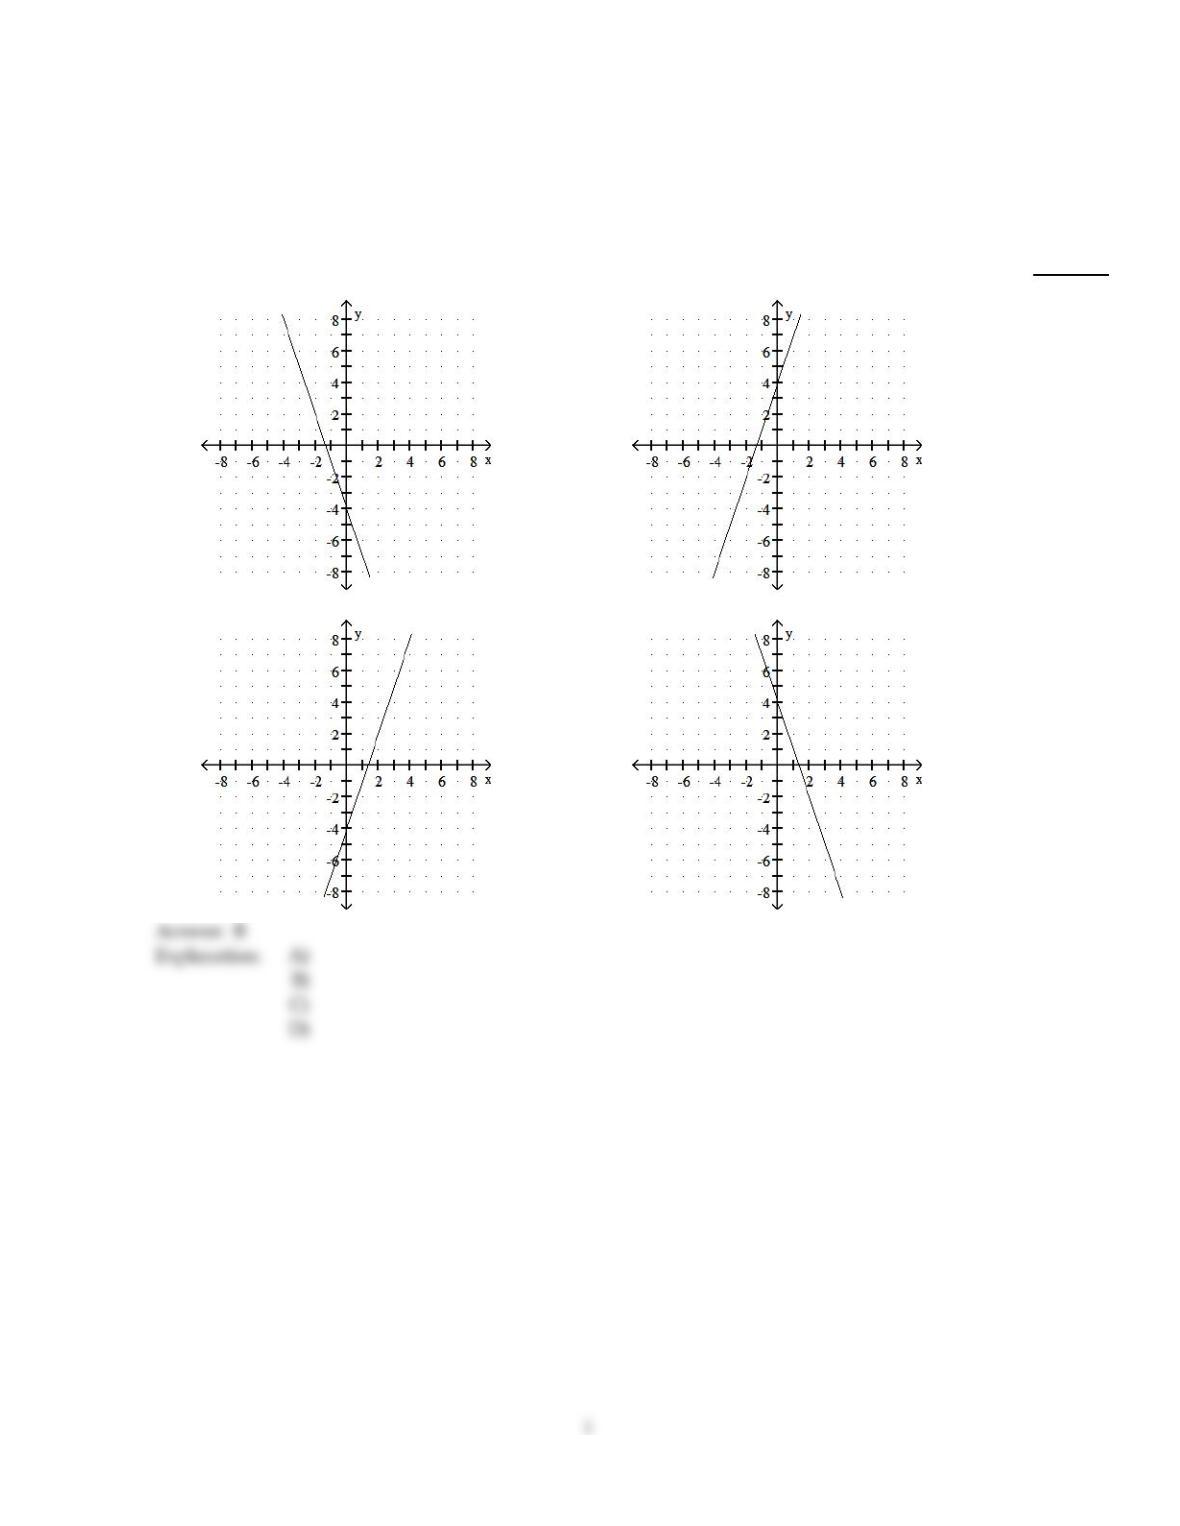
Choose the line that most closely resembles the graph of the given equation.
1)
y =3x + 4
1)
A)
B)
C)
D)
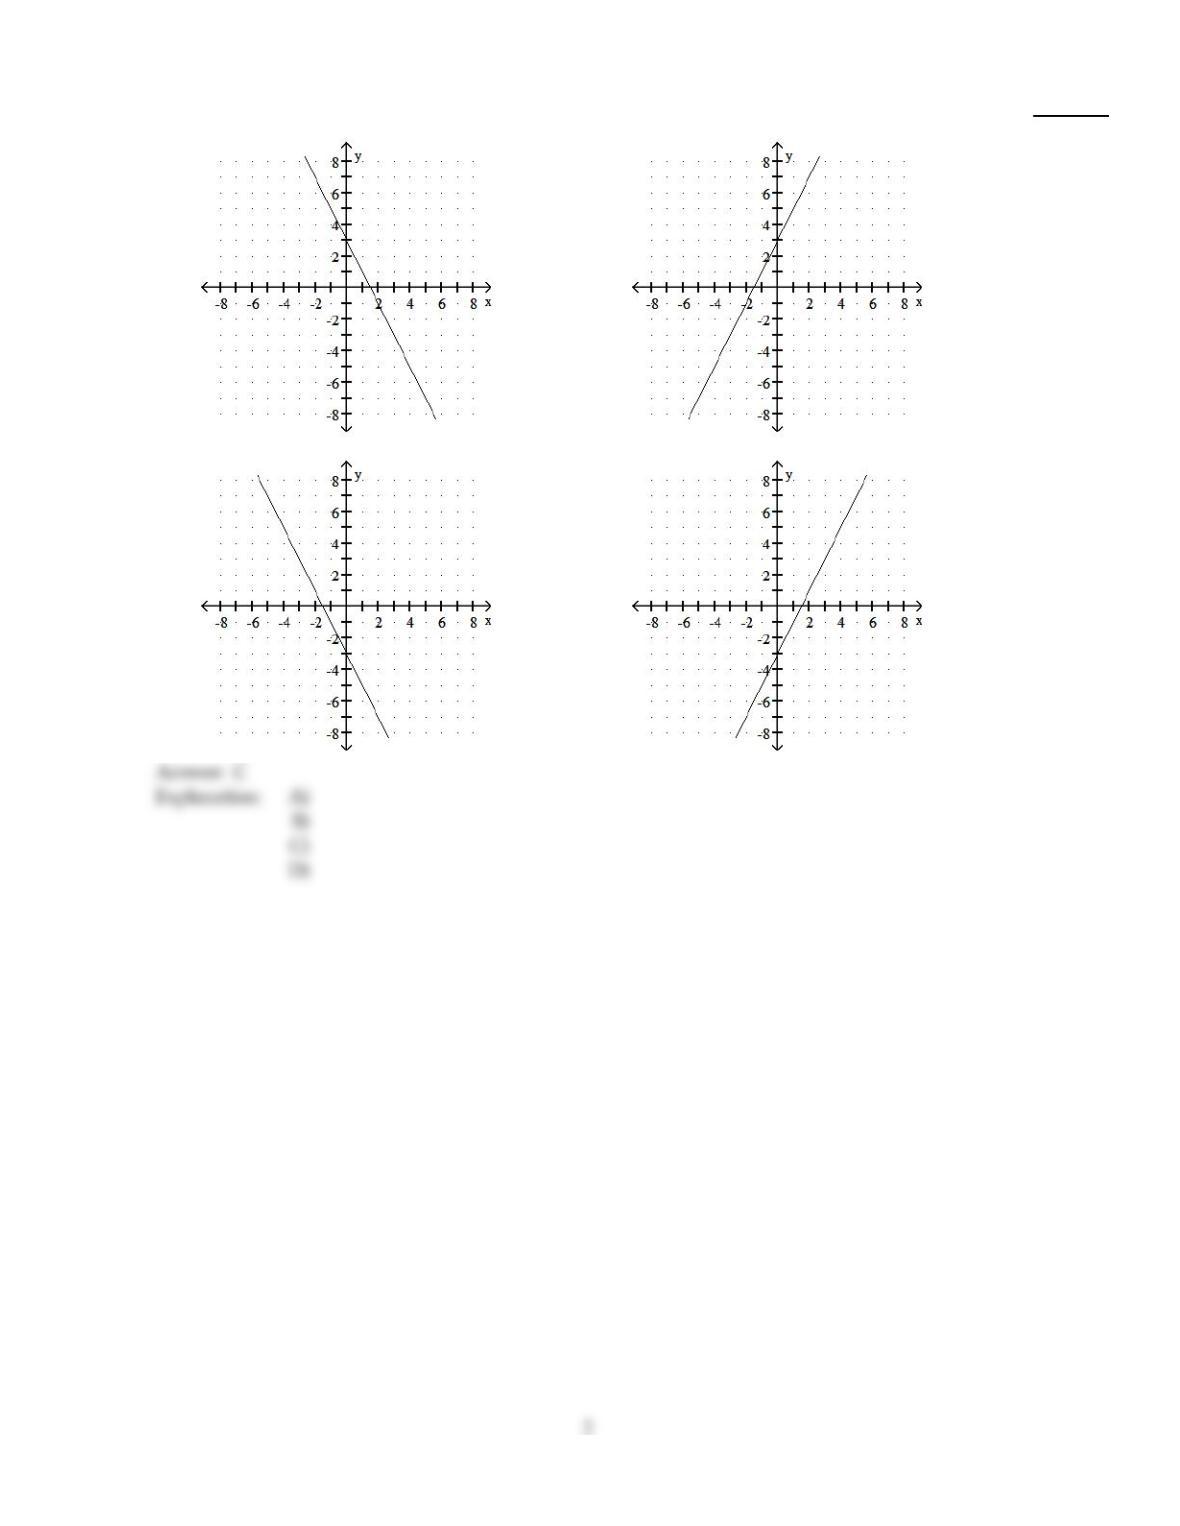
2)
y = – 2x – 3
2)
A)
B)
C)
D)
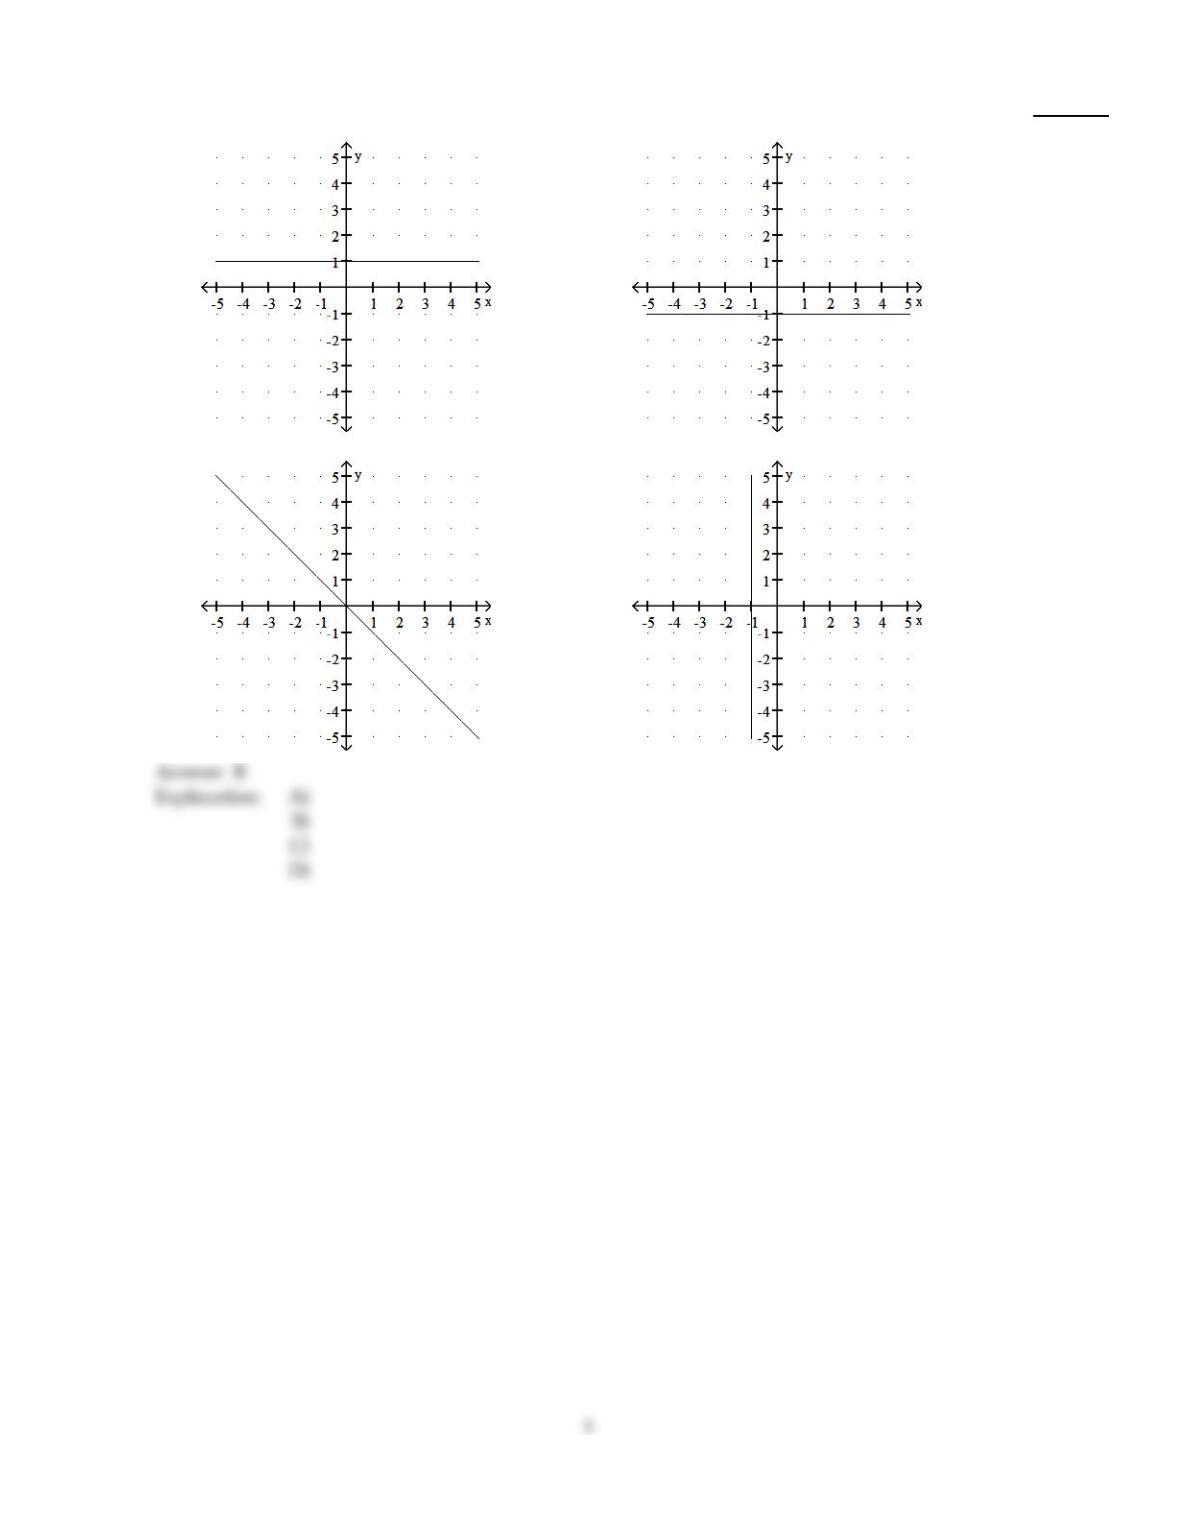
3)
y = – 1
3)
A)
B)
C)
D)
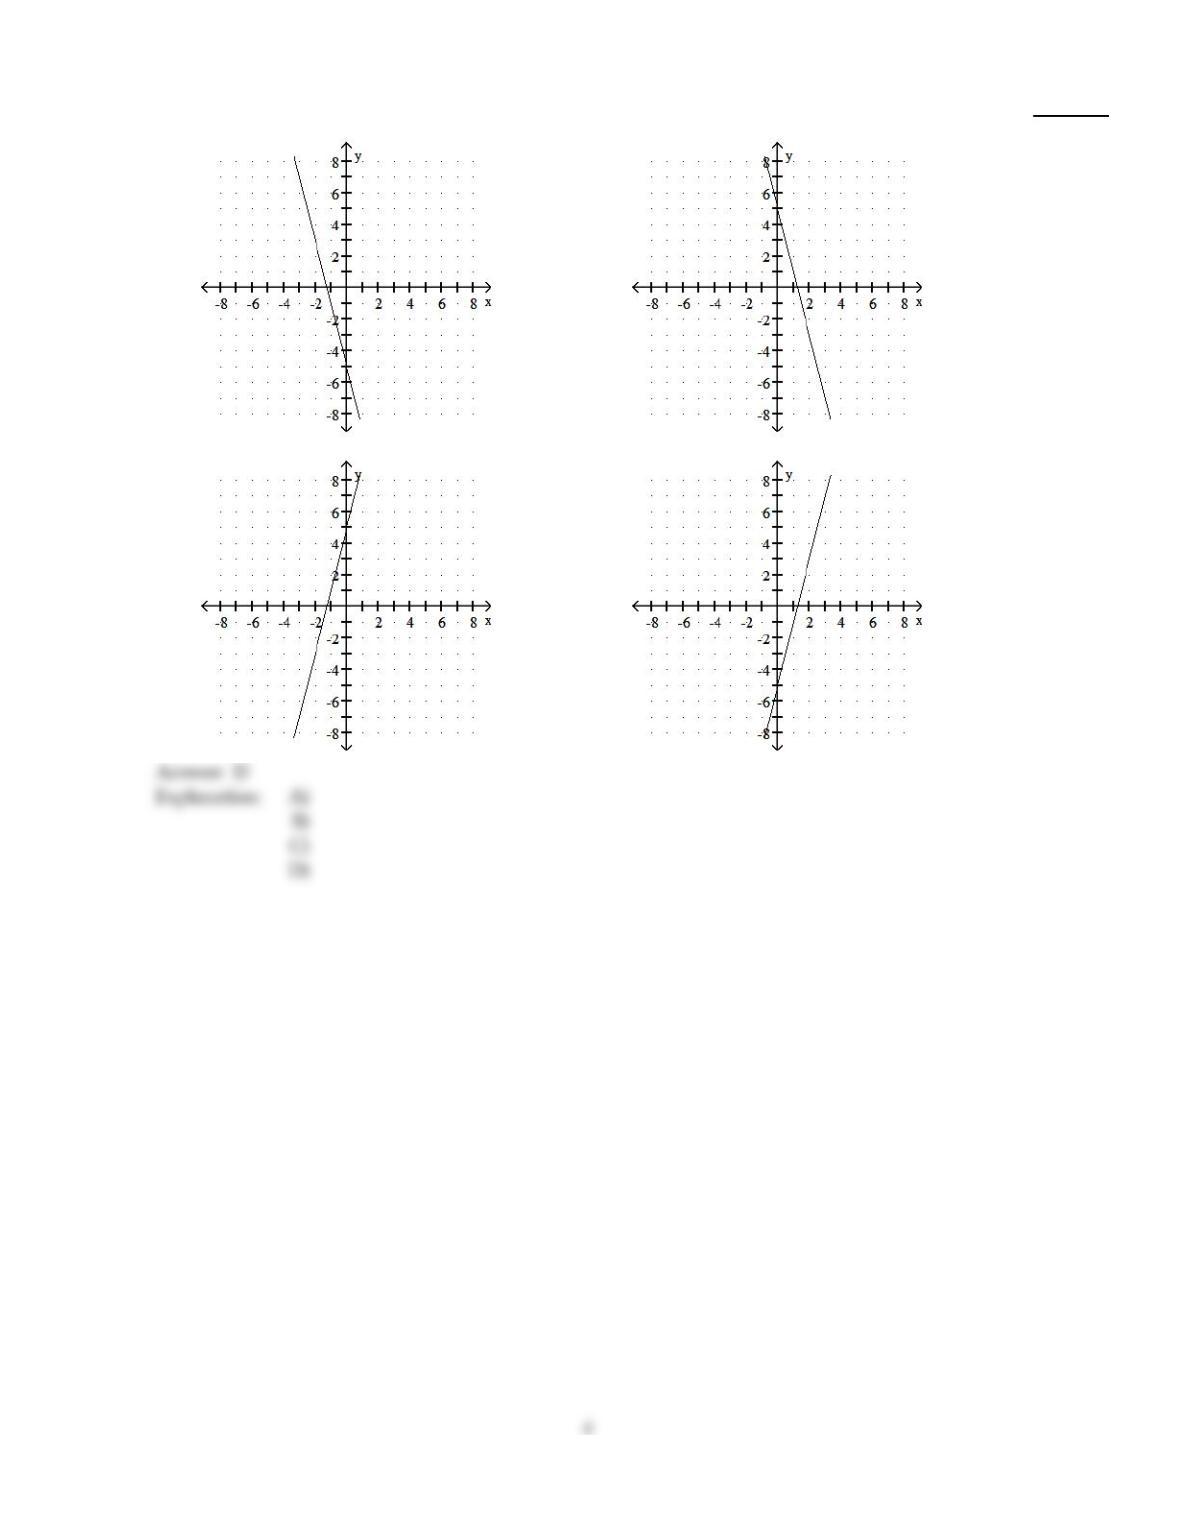
4)
y =4x – 5
4)
A)
B)
C)
D)
5)
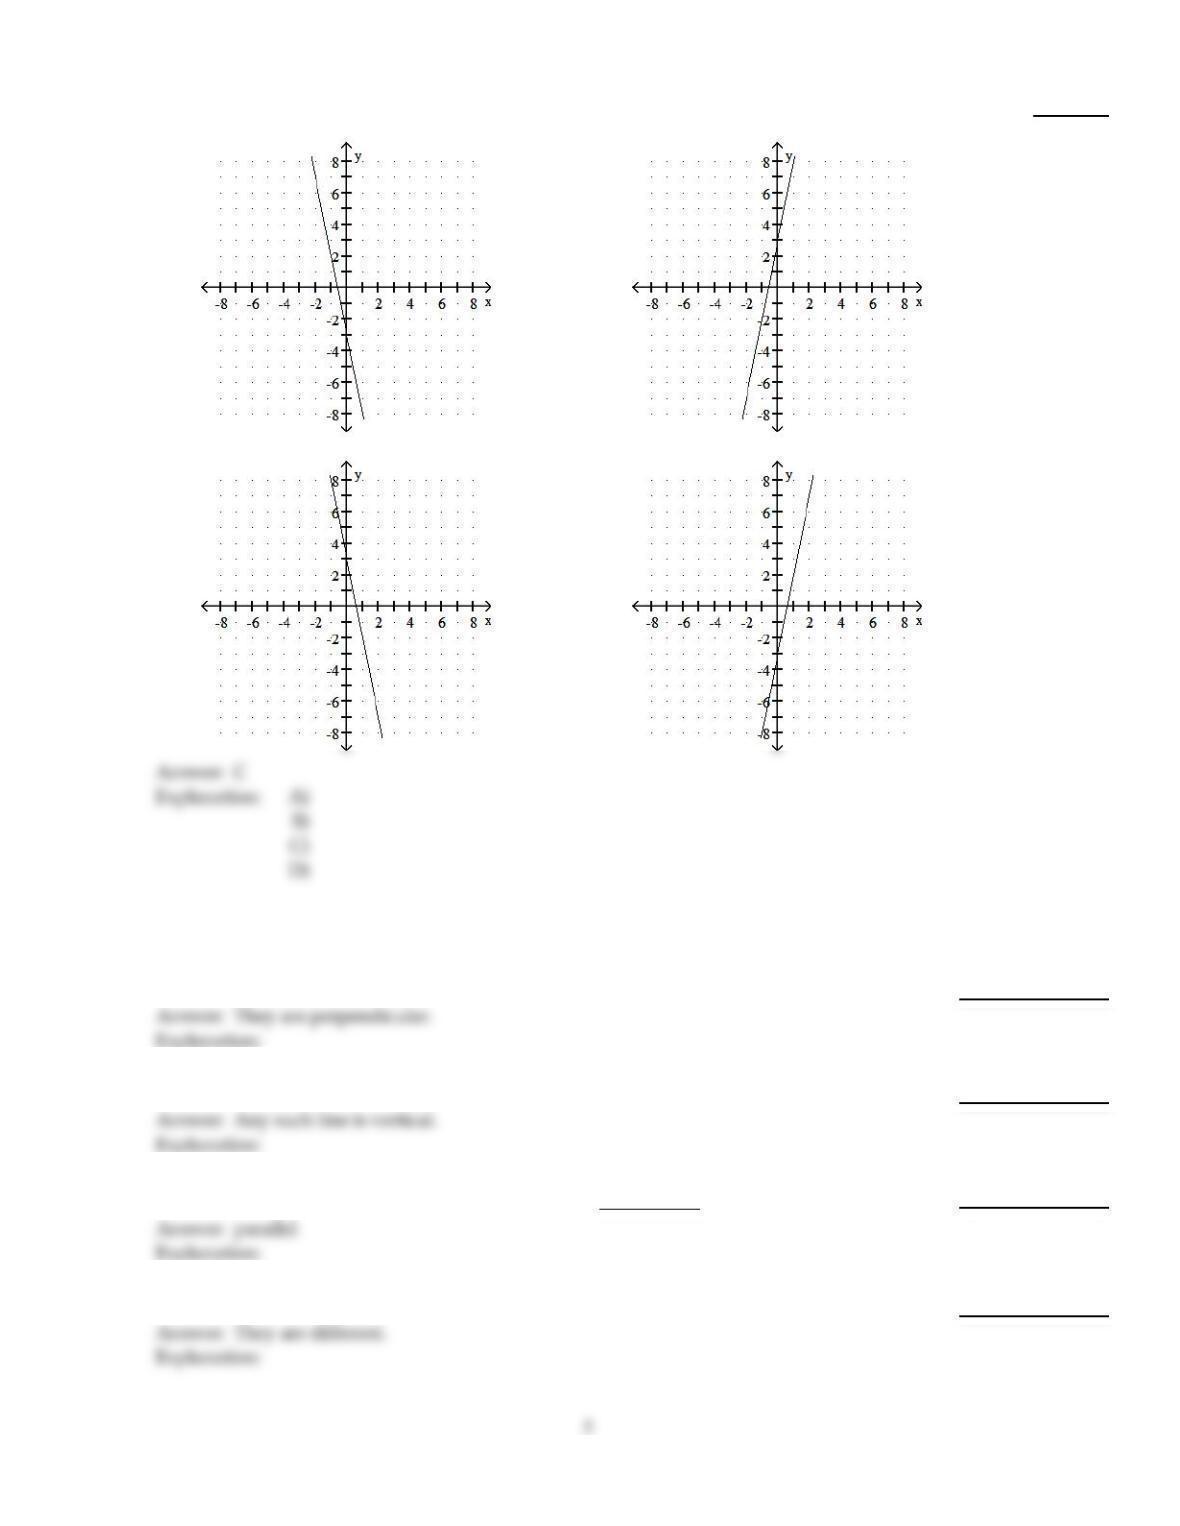
y = – 5x + 3
5)
A)
B)
C)
D)
SHORT ANSWER. Write the word or phrase that best completes each statement or answers the question.
Provide the proper response.
6)
If the product of the slopes of two lines is –1, what do we know about the lines?
6)
7)
If a line is horizontal, what is true of any line that is perpendicular to it?
7)
8)
If two nonvertical lines have the same slope, they are .
8)
9)
If two nonvertical lines intersect, what do we know about their slopes?
9)
Answer the question.
10)
The ordered pair (4, ) is a solution of the equation y =3.
10)
Provide the proper response.
11)
If two lines intersect, they are not .
11)
12)
Give a definition of the slope of a vertical line.
12)
13)
What is wrong with the statement “The line has no slope.”?
13)
Answer the question.
14)
The ordered pair (2, 2) is a solution of the equation 2x – 3y =.
14)
Solve the problem.
15)
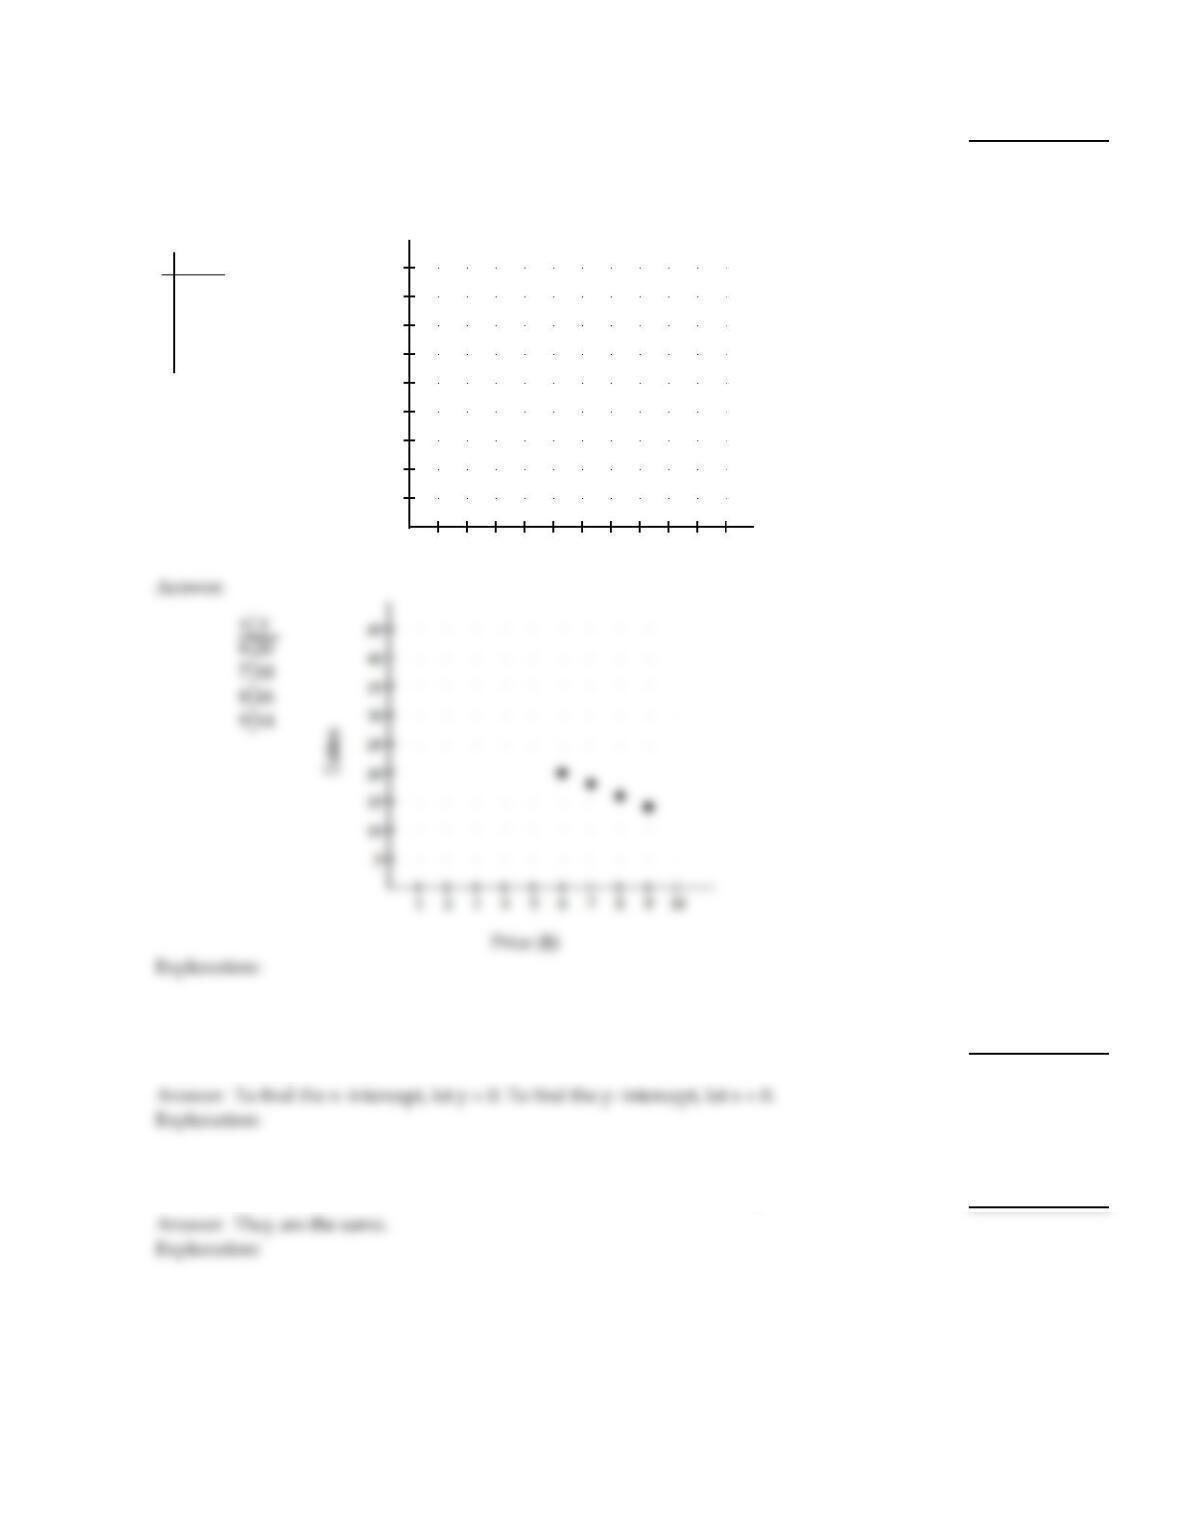
A hardware store owner advertises a certain brand of drill. Each month he changes the
price (in dollars) of the drill and tracks the number of units sold. His sales can be
approximated by the equation y = – 2x +32, where x represents price and y represents sale.
Complete the table, and make a scatter diagram of the data.
x y
6
7
8
9
15)
Solve.
16)
How do you find the x–intercept of the graph of a linear equation in two variables? How
do you find the y–intercept?
16)
Provide the proper response.
17)
If two nonvertical lines never intersect, what do we know about their slopes?
17)
MULTIPLE CHOICE. Choose the one alternative that best completes the statement or answers the question.
Solve the problem.
7
18)
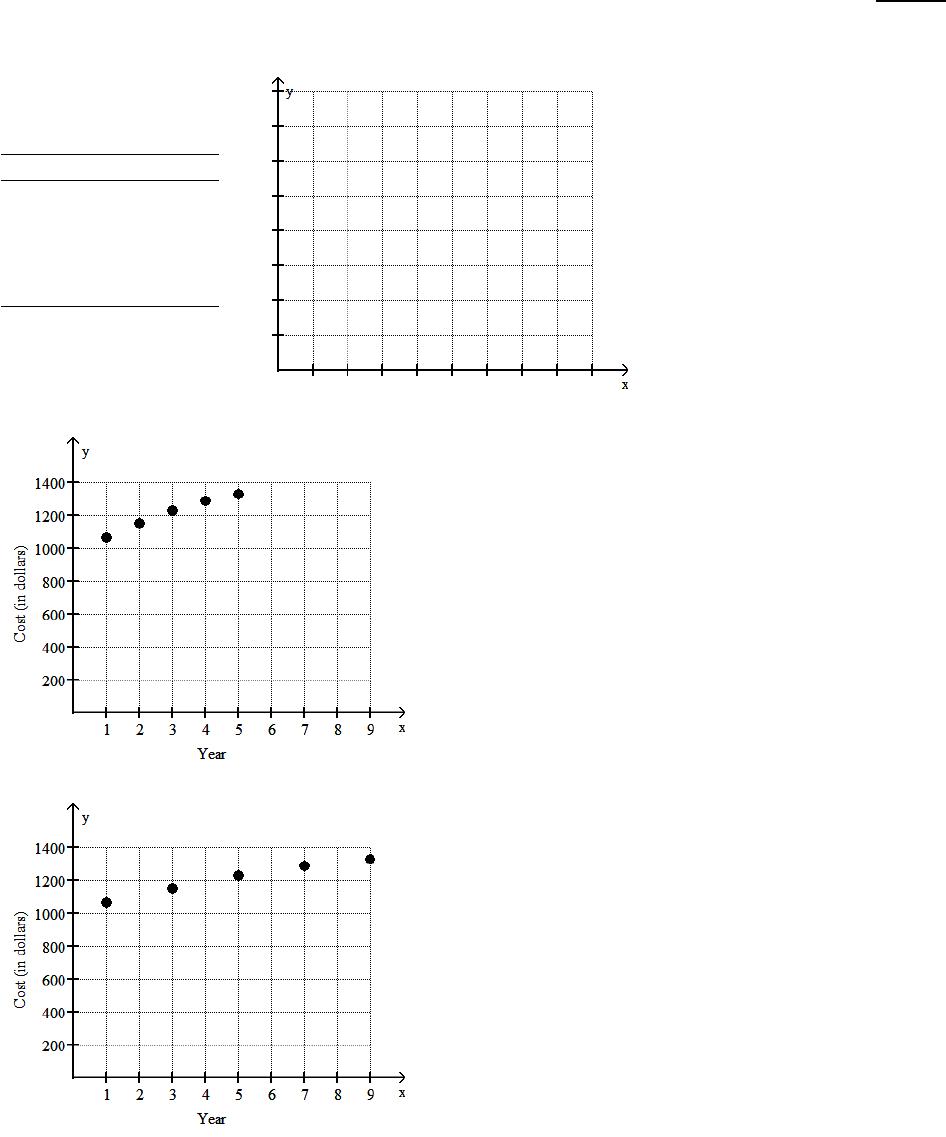
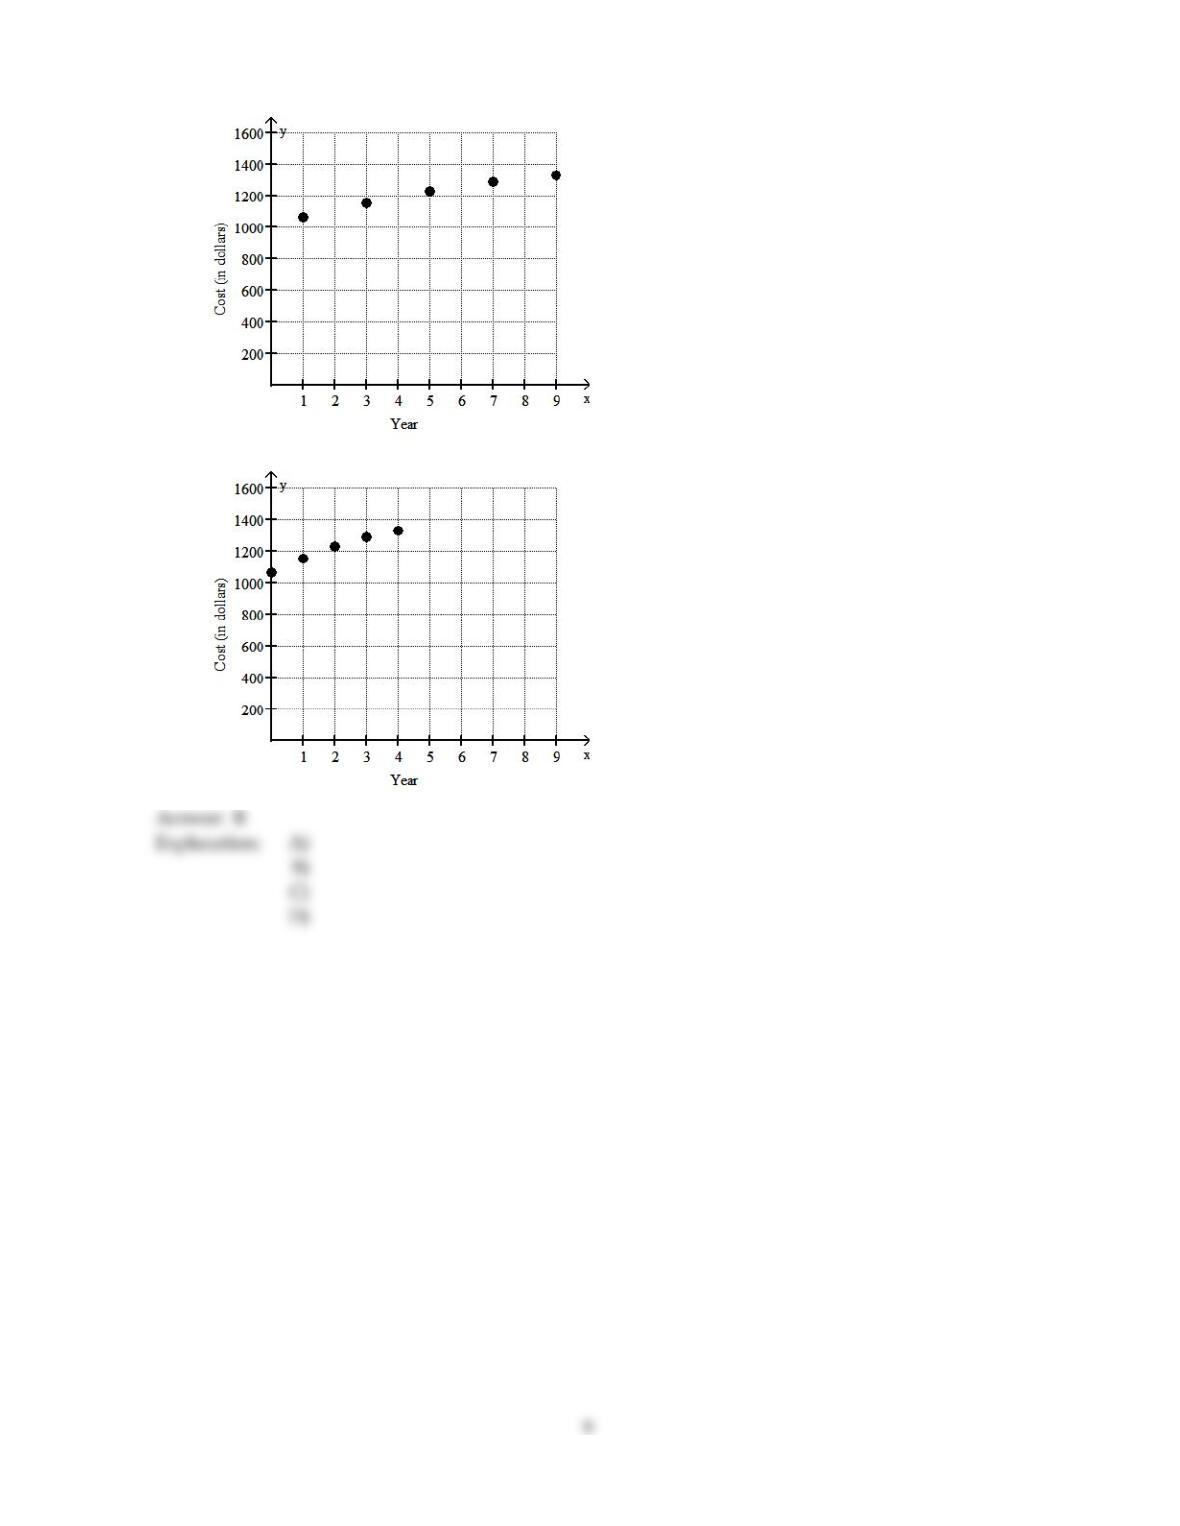
The table lists the average annual cost (in dollars) of tuition and fees at a certain 2–year college for
selected years, where year 1 represents 1992, year 3 represents 1994, and so on. Write the ordered
pairs representing these data and plot the points.
Year Cost (in dollars)
11064
31151
51227
71289
91327
18)
A)
(1, 1064), (2, 1151), (3, 1227), (4, 1289), (5, 1327)
B)
(1, 1064), (3, 1151), (5, 1227), (7, 1289), (9, 1327)
8
C)
(1064, 1), (1151, 3), (1227, 5), (1289, 7), (1327, 9)
D)
(0, 1064), (1, 1151), (2, 1227), (3, 1289), (4, 1327)
Use the graph to answer the question.
19)
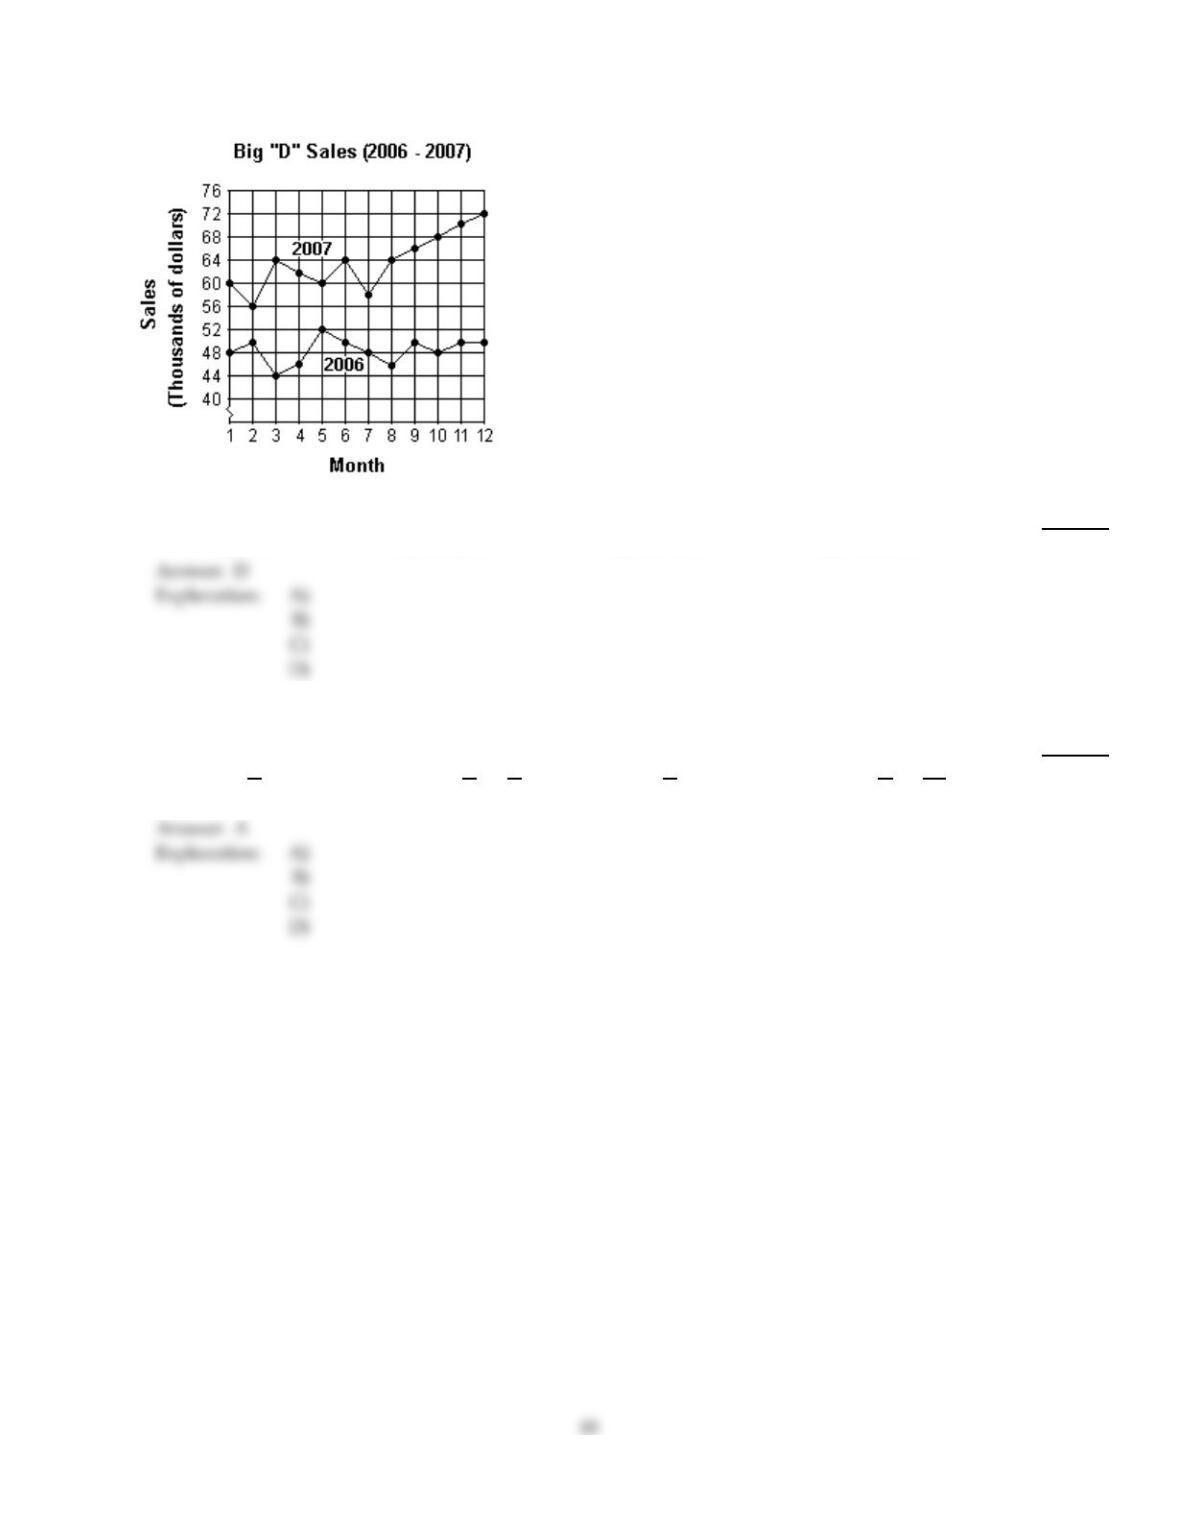
Which month in 2006 had the lowest sales?
19)
A)
Month 2
B)
Month 6
C)
Month 8
D)
Month 3
Find an equation in slope–intercept form of the line satisfying the specified conditions.
20)
Through (–9, –3), perpendicular to 3x – 2y = – 33
20)
A)
y = – 2
3x – 9
B)
y = – 3
2x –3
2
C)
y =2
3x – 9
D)
y =9
2x –33
2
Explanation:
Explanation:
Solve the problem.
21)
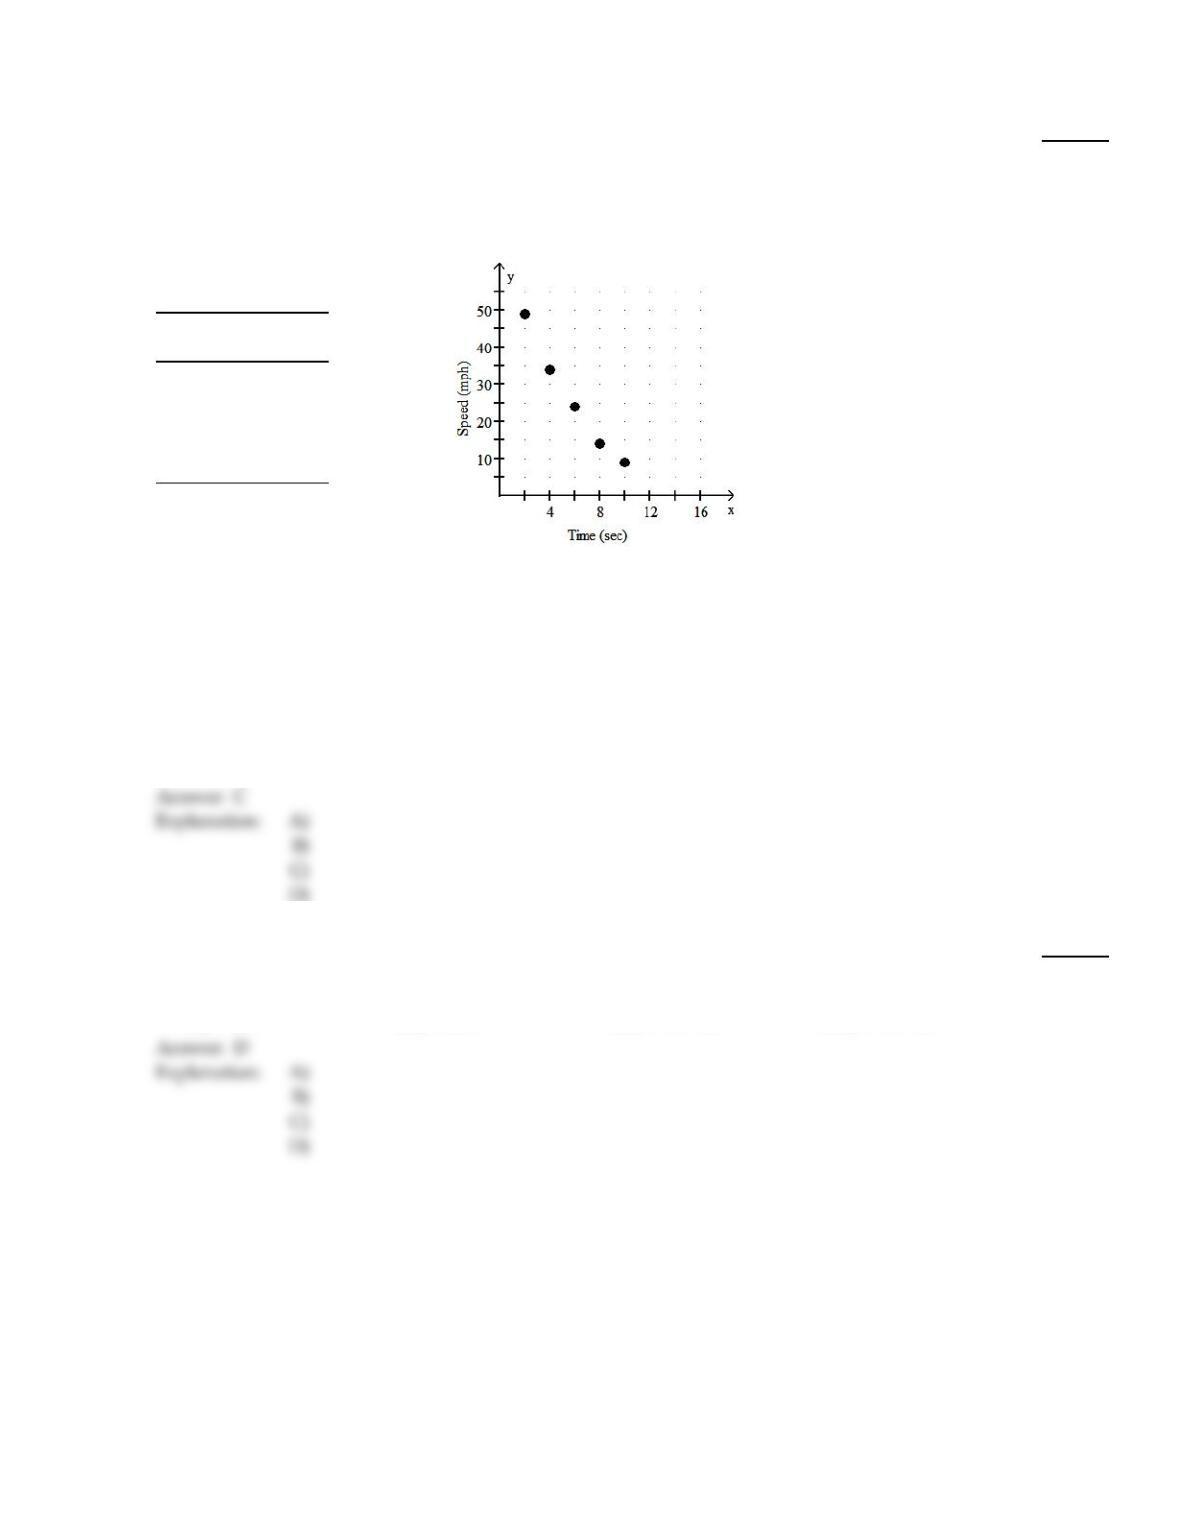
Suppose that the speed of a car, measured in miles per hour (mph), is monitored for some short
period of time after the driver applies the brakes. The following table and graph relate the speed of
the car to the amount of time, measured in seconds (sec), elapsed from the moment that the brakes
are applied. What is happening to the speed of the car during this time frame? In which of the time
intervals does the speed change the most?
TIME
(seconds)
SPEED
(mph)
249
434
624
814
10 9
21)
A)
With increasing elapsed time, the speed increases. The speed changes most during the time
interval from 2 seconds to 4 seconds.
B)
With increasing elapsed time, the speed decreases. The speed changes most during the time
interval from 8 seconds to 10 seconds.
C)
With increasing elapsed time, the speed decreases. The speed changes most during the time
interval from 2 seconds to 4 seconds.
D)
With increasing elapsed time, the speed increases. The speed changes most during the time
interval from 8 seconds to 10 seconds.
22)
A cable TV company charges $25 for the basic service plus $7 for each movie channel. Let y be the
total cost in dollars of subscribing to cable TV, using x movie channels. Find the slope–intercept
form of the equation.
22)
A)
y =25x + 7
B)
y =25x – 7
C)
y =7x – 25
D)
y =7x + 25
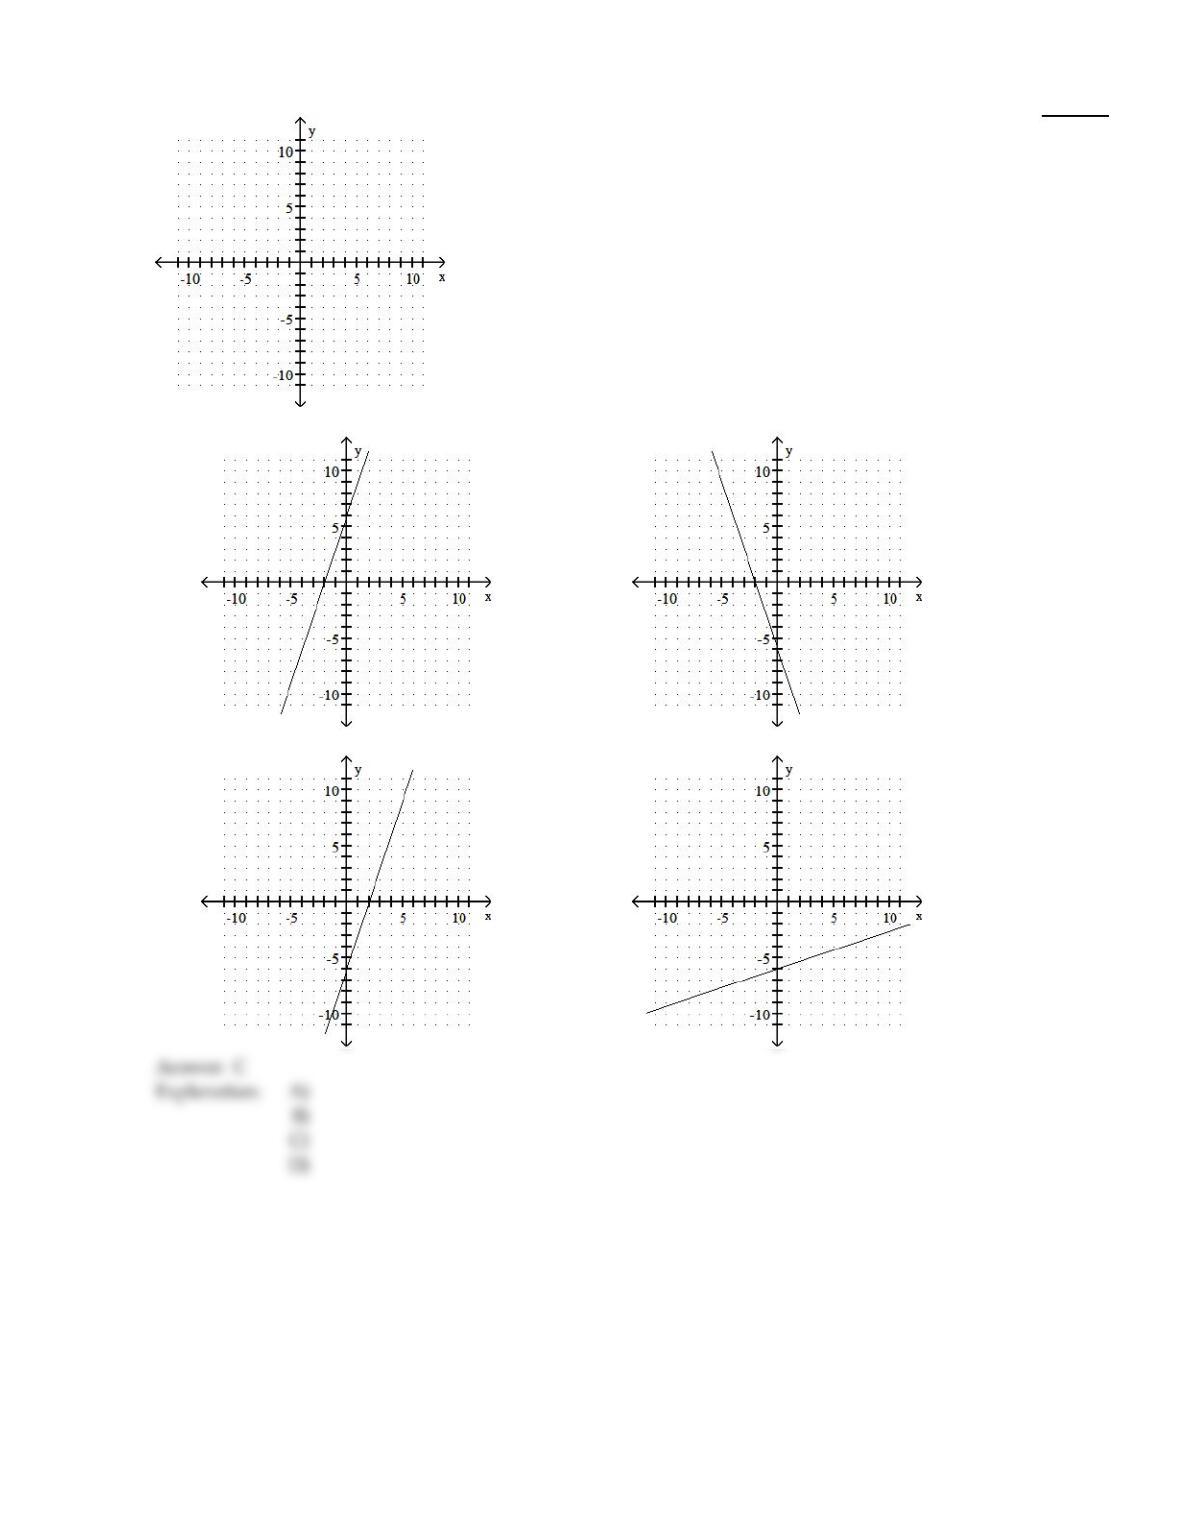
Graph the equation by using the slope and y–intercept.
11
23)
y =3x – 6
23)
A)
B)
C)
D)
Plot the ordered pairs on the rectangular coordinate system provided.
12
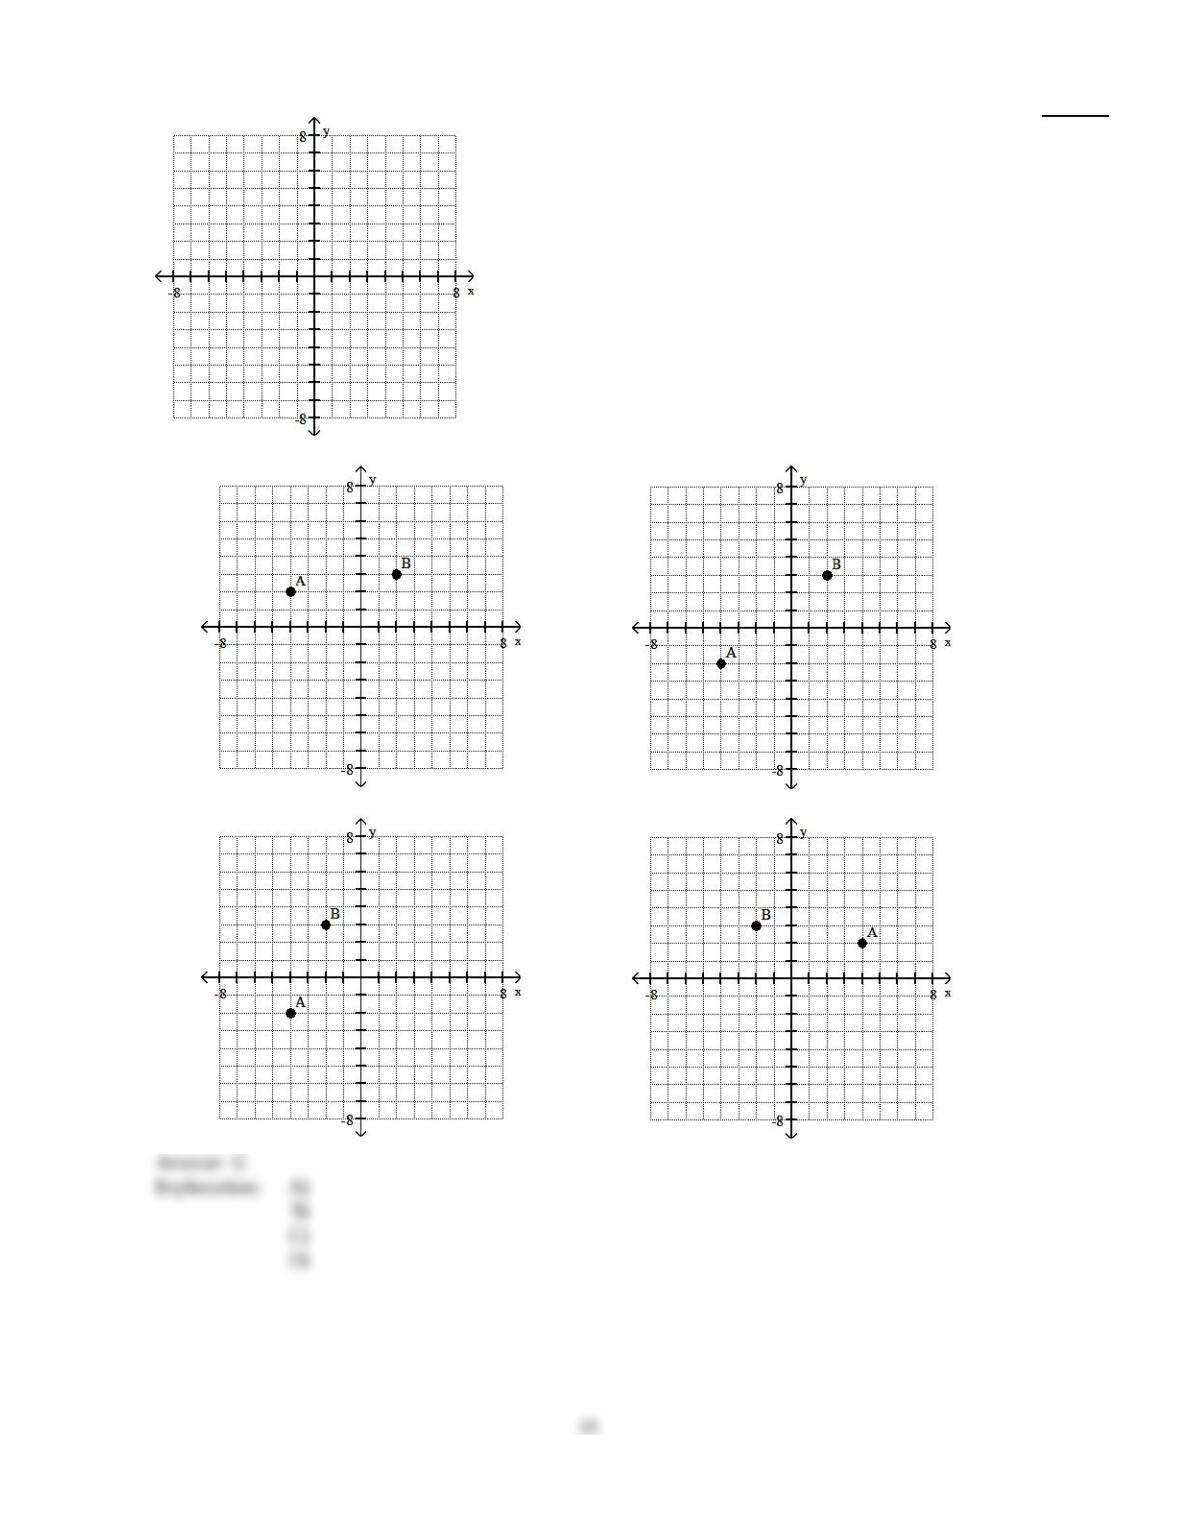
24)
A(–4, –2), B(–2, 3)
24)
A)
B)
C)
D)
The table of values gives two points that lie on a line. Use the points to find the slope and y–intercept of the line. Then
use these values to write an equation of the line in slope–intercept form.
25)
x y
–4 8
0–3
25)
A)
y =11
4x – 3
B)
y = – 4x – 3
C)
y =4x – 3
D)
y = – 11
4x – 3
Complete the table of values for the given equation.
26)
x = – 3x
y 0 2 4
26)
A)
0; 0; 0
B)
–3; –3; –3
C)
0; 2; 4
D)
3; 3; 3
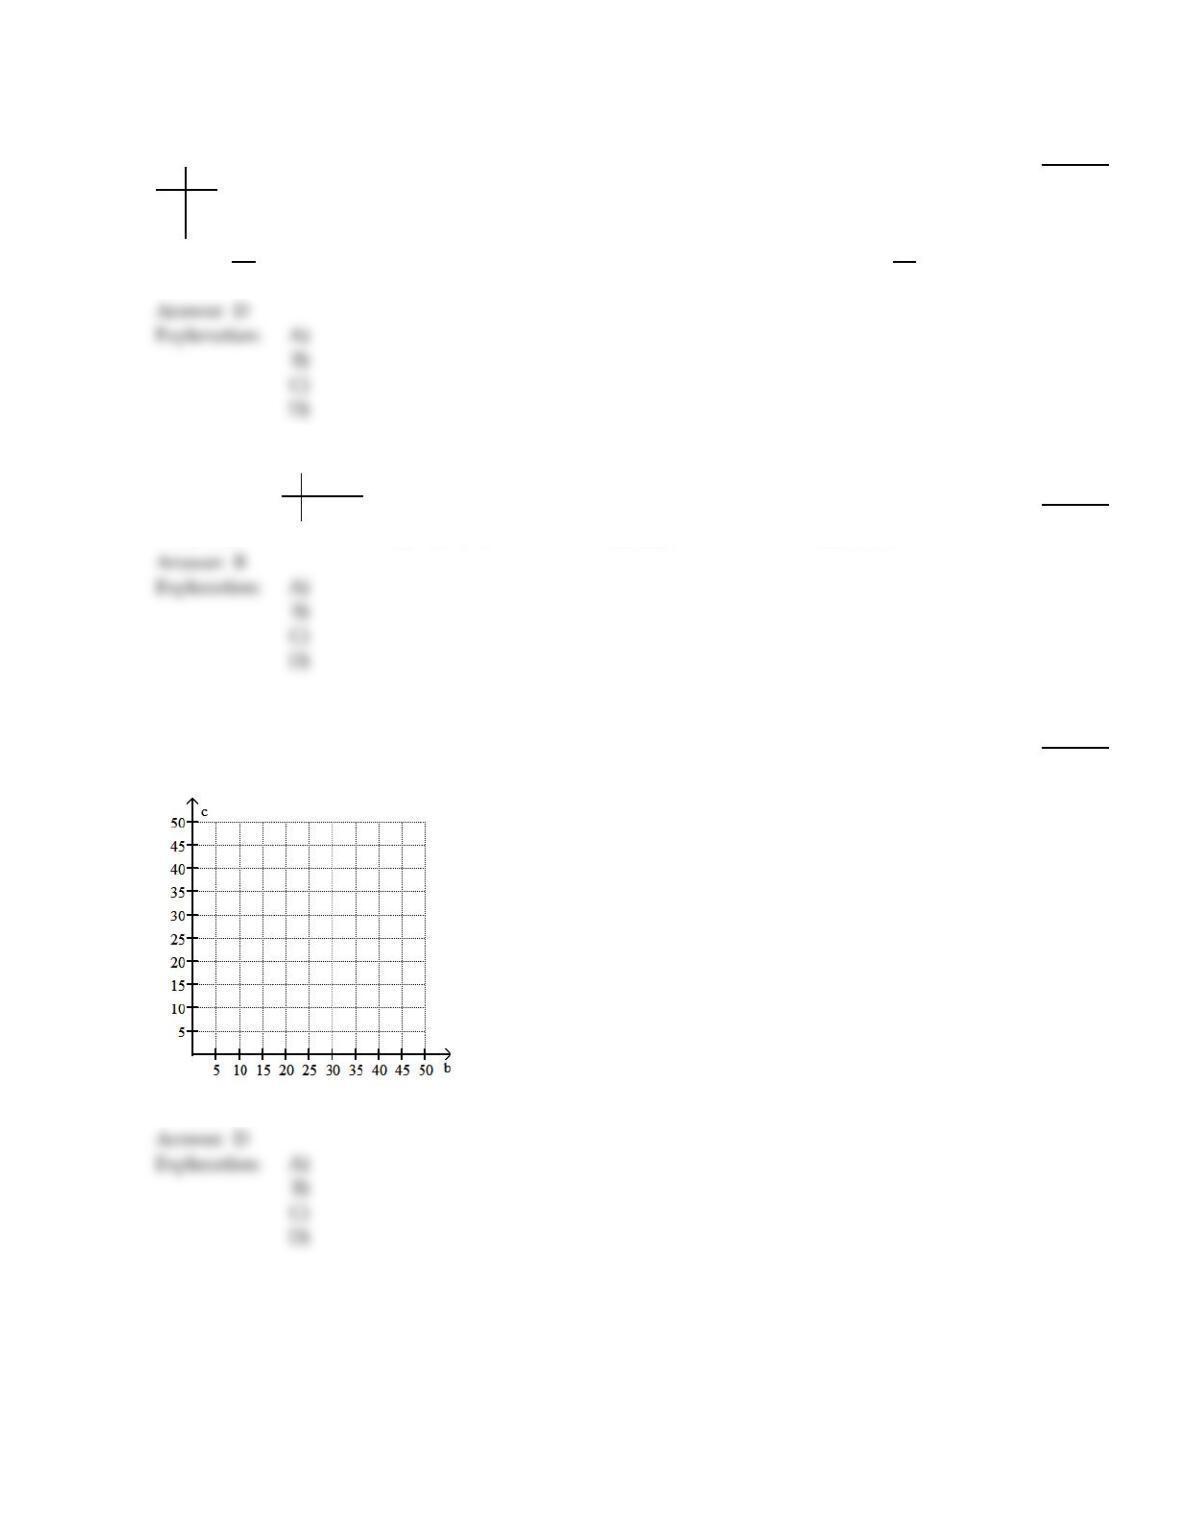
Solve by graphing. Label the axes and show where the solution is located on the graph.
27)
Alison sets aside $60 each month to spend on books and CDs. If she spends c dollars on CDs in a
given month she may spend b dollars on books where c + b =60. Graph the equation and use the
graph to estimate the amount Alison may spend on books in March if she spends $24 on CDs.
27)
A)
$43
B)
$84
C)
$47
D)
$36
Plot the ordered pairs on the rectangular coordinate system provided.
14
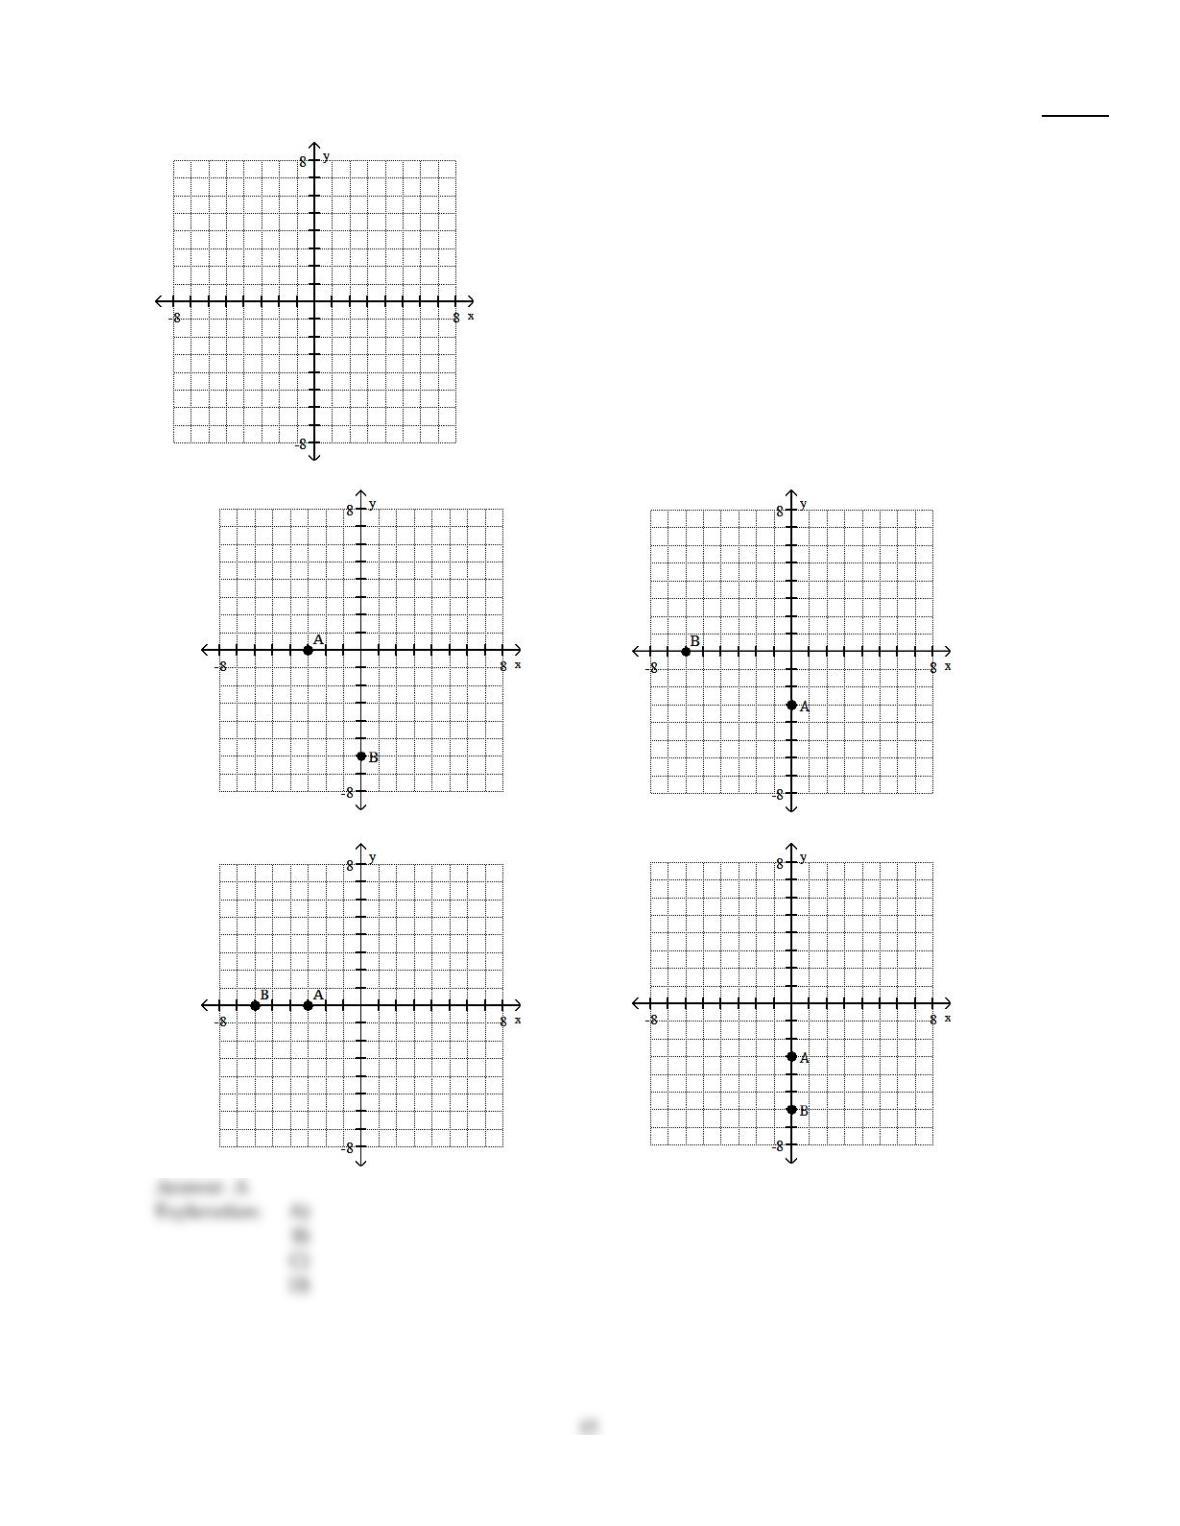
28)
A(–3, 0), B (0, –6)
28)
A)
B)
C)
D)
Solve by graphing. Label the axes and show where the solution is located on the graph.
29)
Suppose the sales of a particular brand of appliance satisfy the relationship y =60x + 3300, where y
represents the number of sales in year x, with x = 0 corresponding to 1982. Find the number of sales
in 1989.
29)
A)
3660
B)
7380
C)
3720
D)
7440
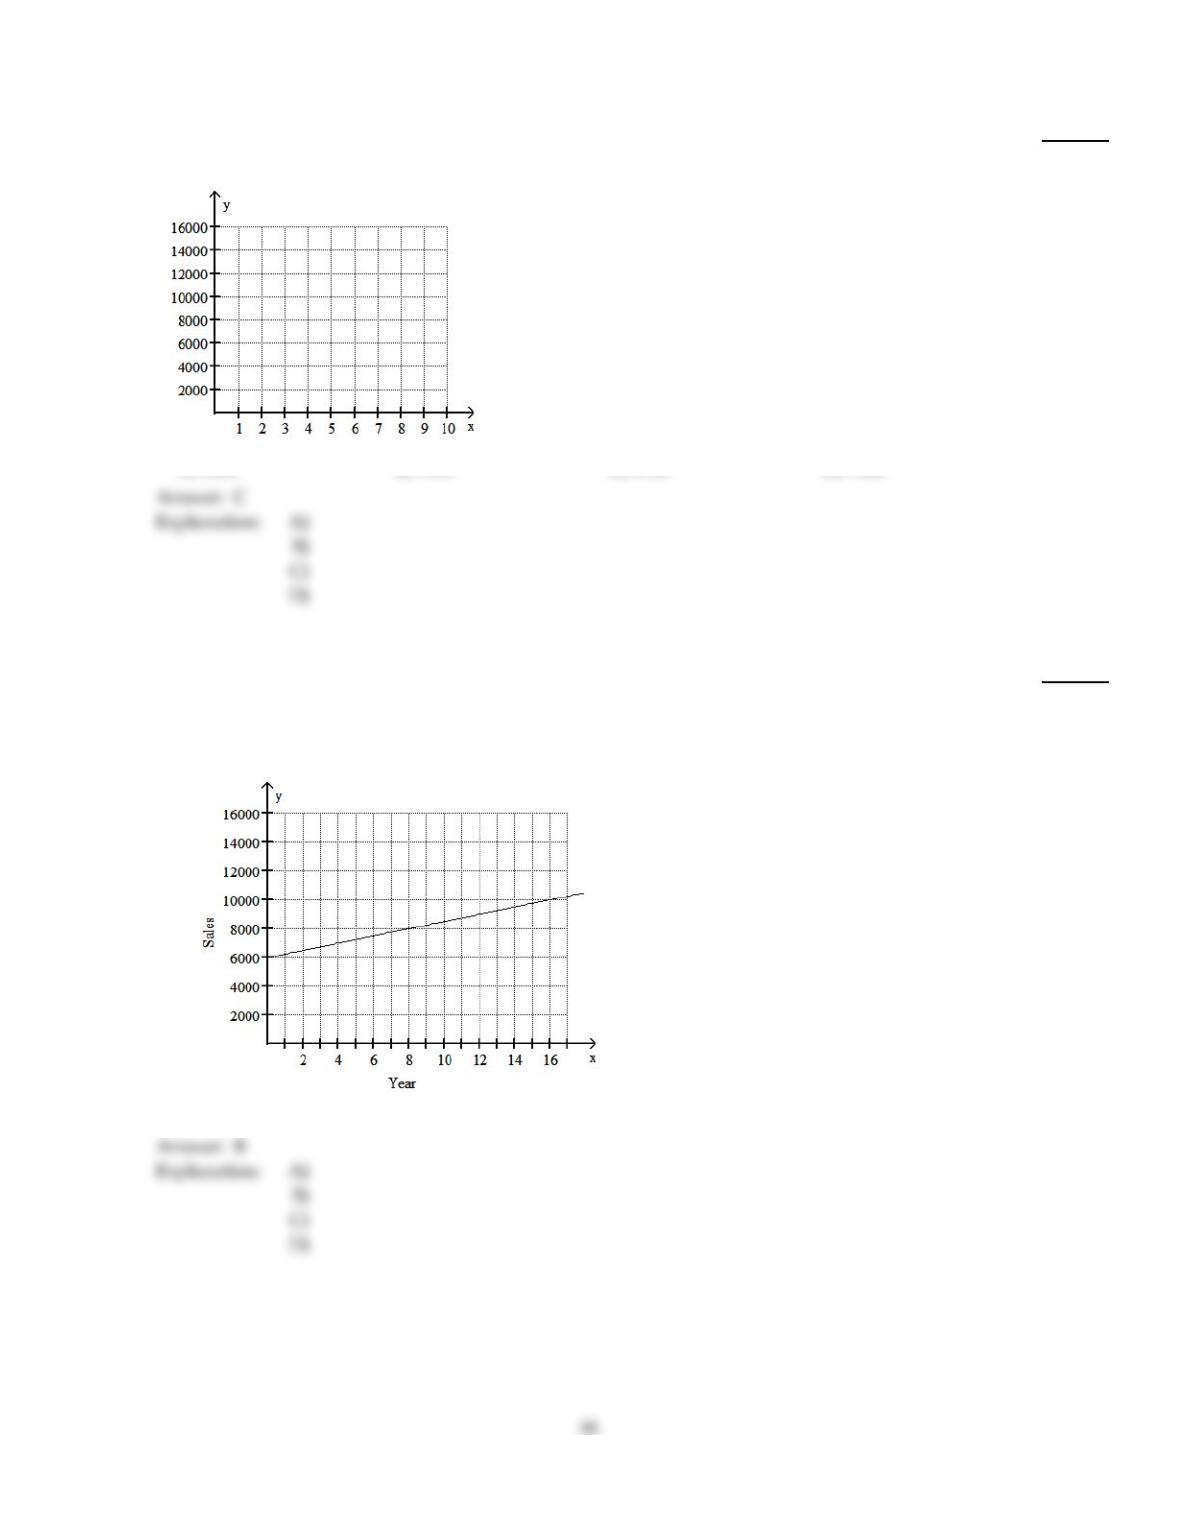
Solve the problem.
30)
The graph shows the sales of a particular brand of appliance from 1992 to 2010, where 1992
corresponds to x = 0. Two of the data points in the graph can be represented by the ordered pairs
(0, 6000) and (11, 8750). Use these ordered pairs to write an equation of a line that models the data.
Give the equation in slope–intercept form.
30)
A)
y =600x +6000
B)
y =250x +6000
C)
y =600x +8750
D)
y =250x +8750
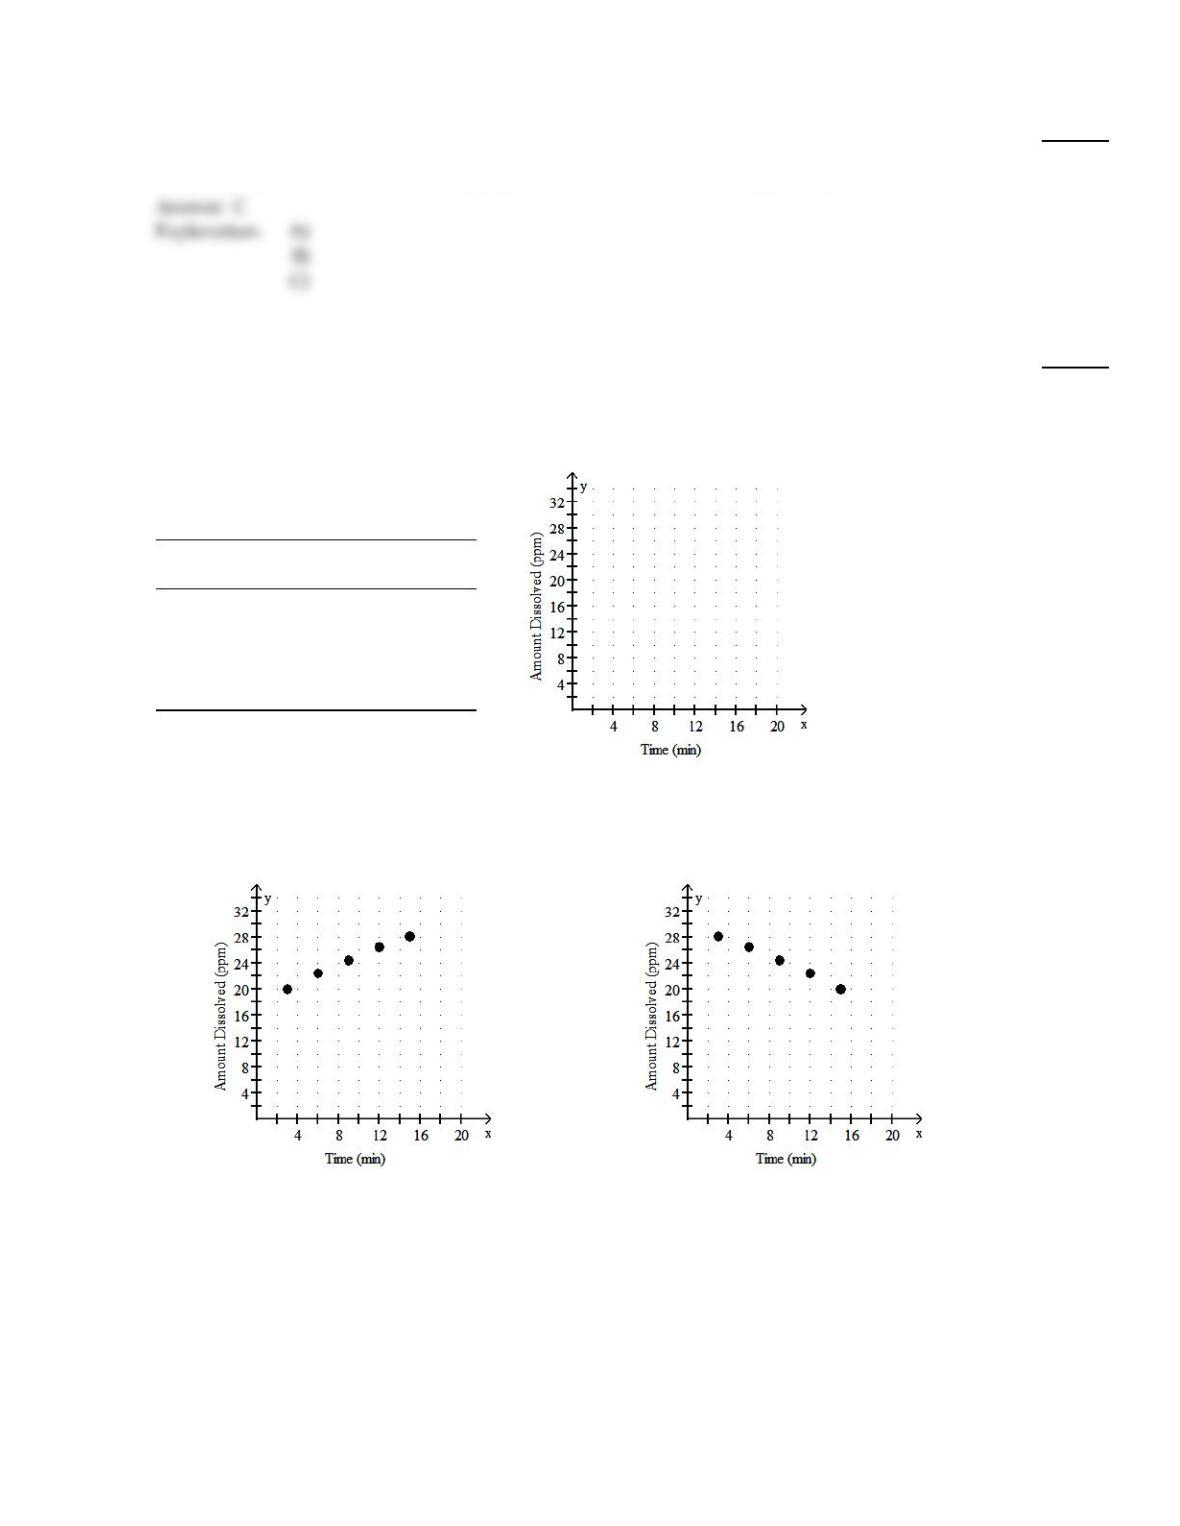
Determine whether the graphs of the equations are parallel lines, perpendicular lines, or neither.
31)
6x + 2y = 8
24x + 8y = 33
31)
A)
Perpendicular
B)
Neither
C)
Parallel
Solve the problem.
32)
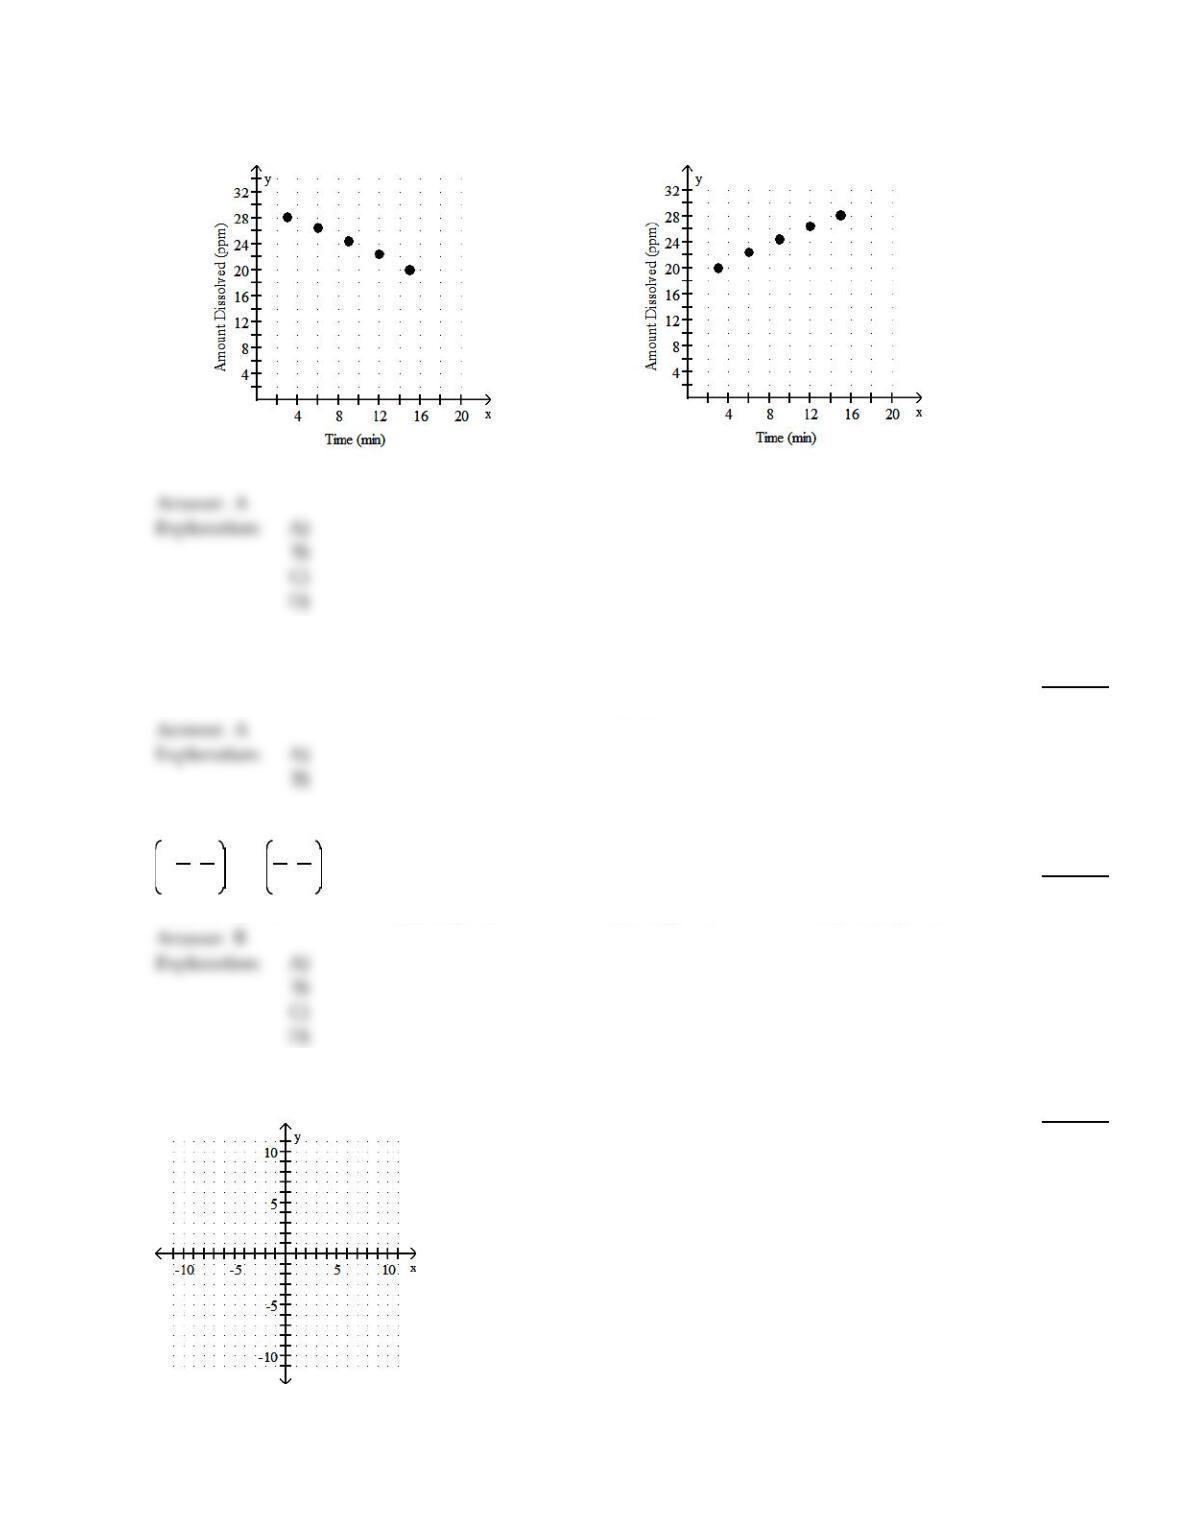
Suppose that during a certain step in a chemical manufacturing process the amount of chlorine
dissolved in a solution, measured in parts per million (ppm), is related to the elapsed time
measured from the beginning of the step. Use the following table as a representation of this
relationship. Make a scatter diagram of the data. What is happening to the amount of chlorine in
solution during this time frame?
TIME
(minutes)
AMOUNT DISSOLVED
(ppm)
320.0
622.4
924.4
12 26.4
15 28.2
32)
A)
The amount of chlorine dissolved
increased as time elapsed.
B)
The amount of chlorine dissolved
increased as time elapsed.
17
C)
The amount of chlorine dissolved
increased as time elapsed.
D)
The amount of chlorine dissolved
decreased as time elapsed.
Decide whether or not the ordered pair is a solution to the equation.
33)
x + y =9; (3, 6)
33)
A)
Yes
B)
No
Write an equation for the line passing through the given pair of points. Give your final answer in standard form.
34)
–2
5, 4
5 and 1
5, 3
5
34)
A)
x –3y =2
B)
x +3y =2
C)
x +2y =10
D)
–3x + y =2
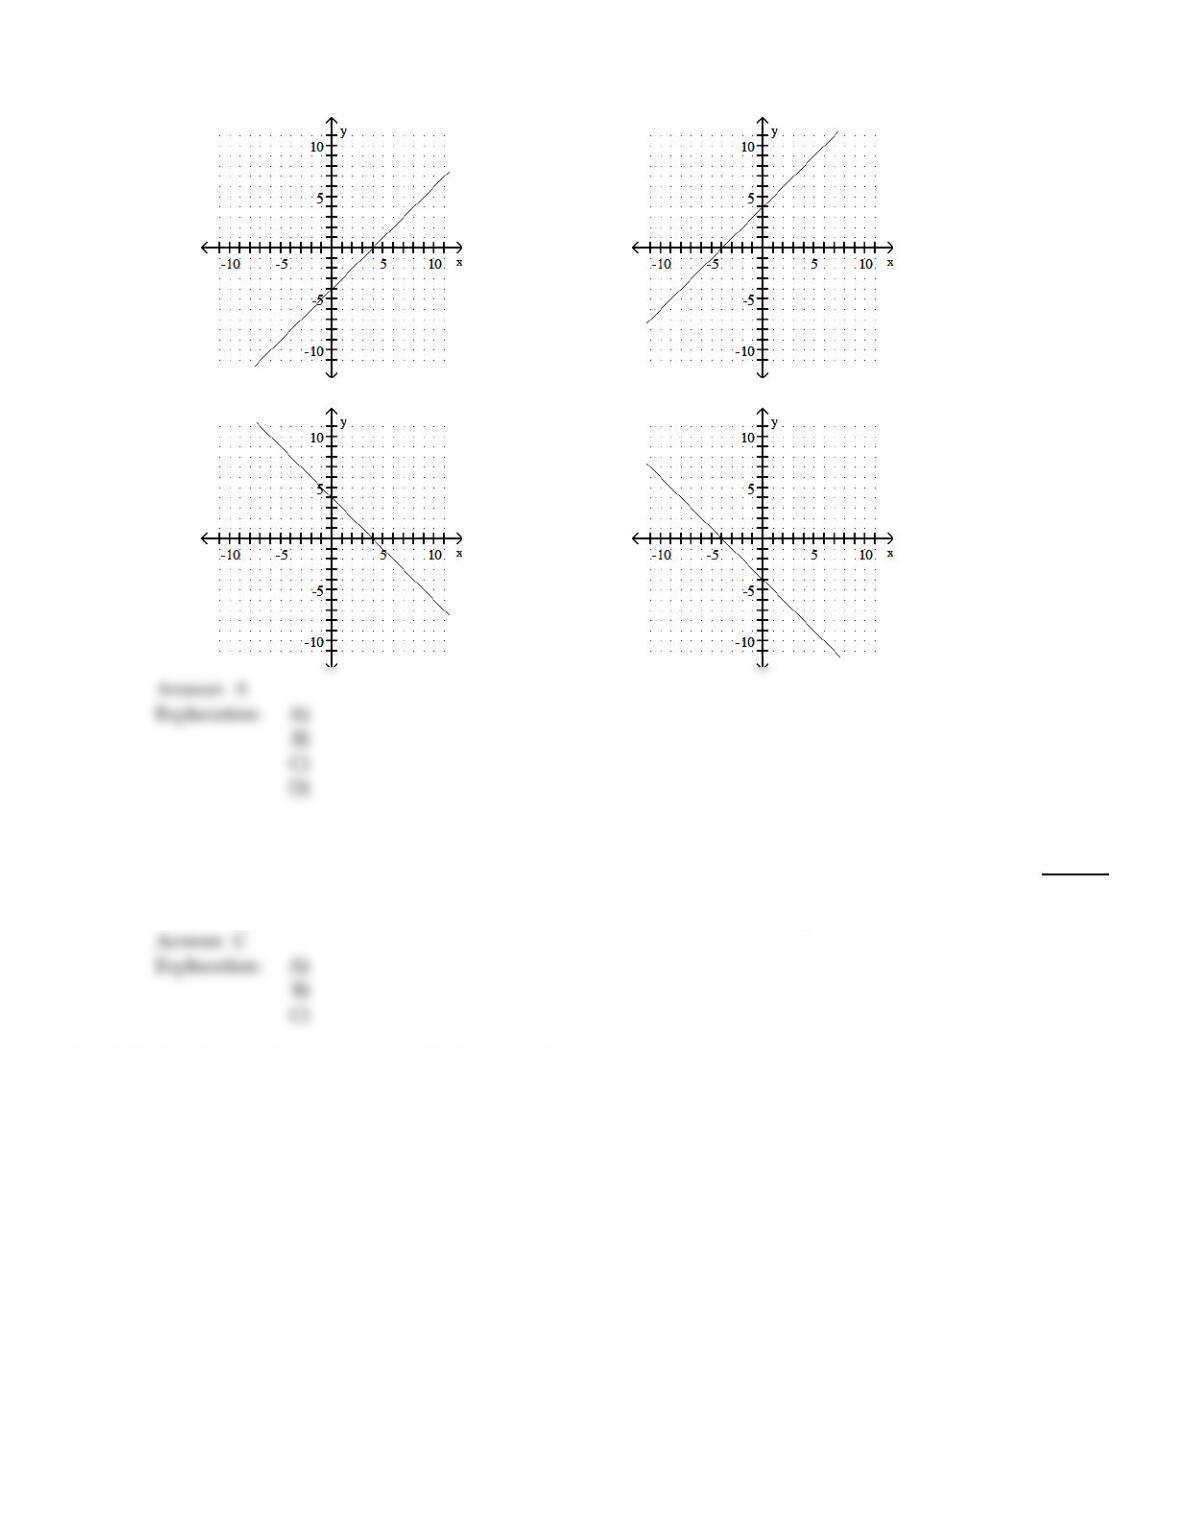
Complete the ordered pairs. Then graph the equation by plotting the points and drawing a line through them.
35)
y = x – 4 (0, ), ( , 0), (5, )
35)
18
A)
(0, –4), (4, 0), (5, 1)
B)
(0, 4), (–4, 0), (5, 9)
C)
(0, 4), (4, 0), (5, –1)
D)
(0, –4), (–4, 0), (5, –9)
Determine whether the graphs of the equations are parallel lines, perpendicular lines, or neither.
36)
3x – 6y = 19
18x + 9y = 19
36)
A)
Neither
B)
Parallel
C)
Perpendicular
Graph the line through the given point with the given slope.
19
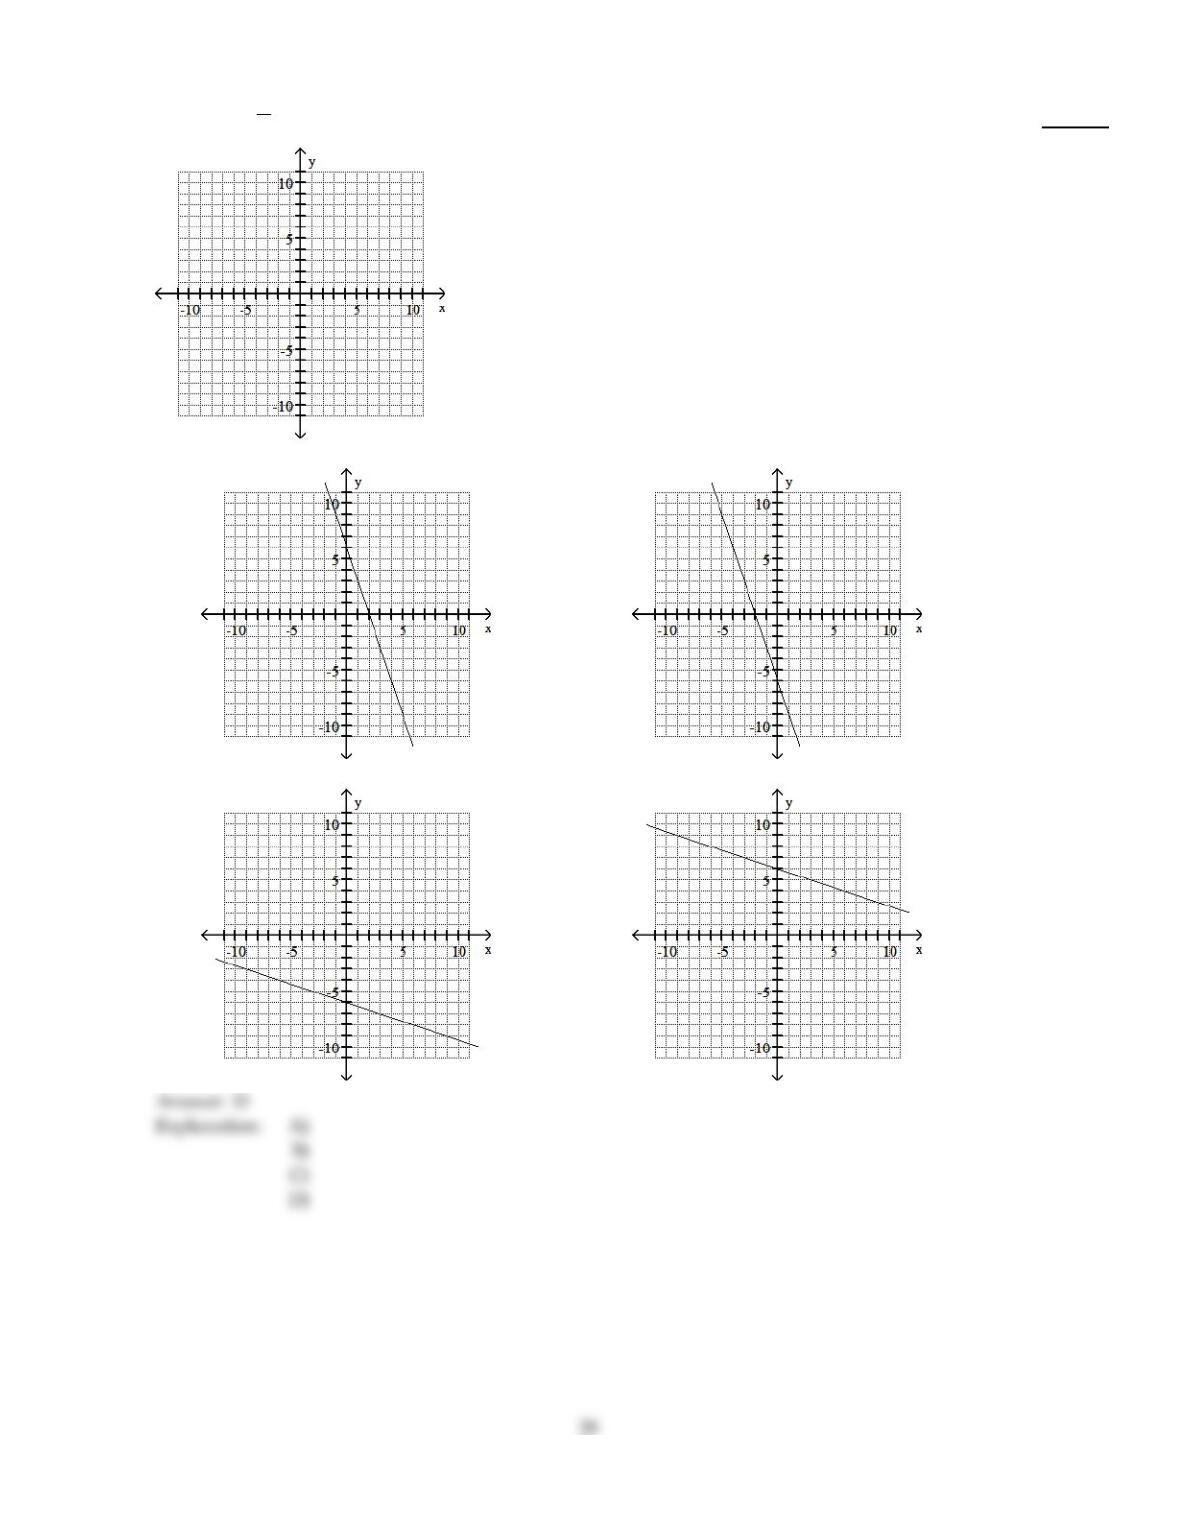
37)
(0, 6), m = – 1
3
37)
A)
B)
C)
D)