30) If Blake can pick more cherries in one hour than Cody, then Blake has a comparative
advantage in cherry picking.
31) The basis for trade is absolute advantage, not comparative advantage.
32) If a country produces only two goods, then it is not possible to have a comparative advantage
in the production of both those goods.
33) In a two-good, two country world, if one country has an absolute advantage in the production
of both goods, it can still benefit by trading with the other country.
34) If the opportunity cost of producing more of one good increases as more of that good is
produced, then the production method is inefficient.
35) It is not possible to have a comparative advantage in producing a good or service without
having an absolute advantage.
36) Is it possible for a firm to have a comparative advantage in producing something without
having an absolute advantage? Why or why not?
37) Should countries specialize in producing goods and services based on having a comparative
advantage or an absolute advantage? Why?
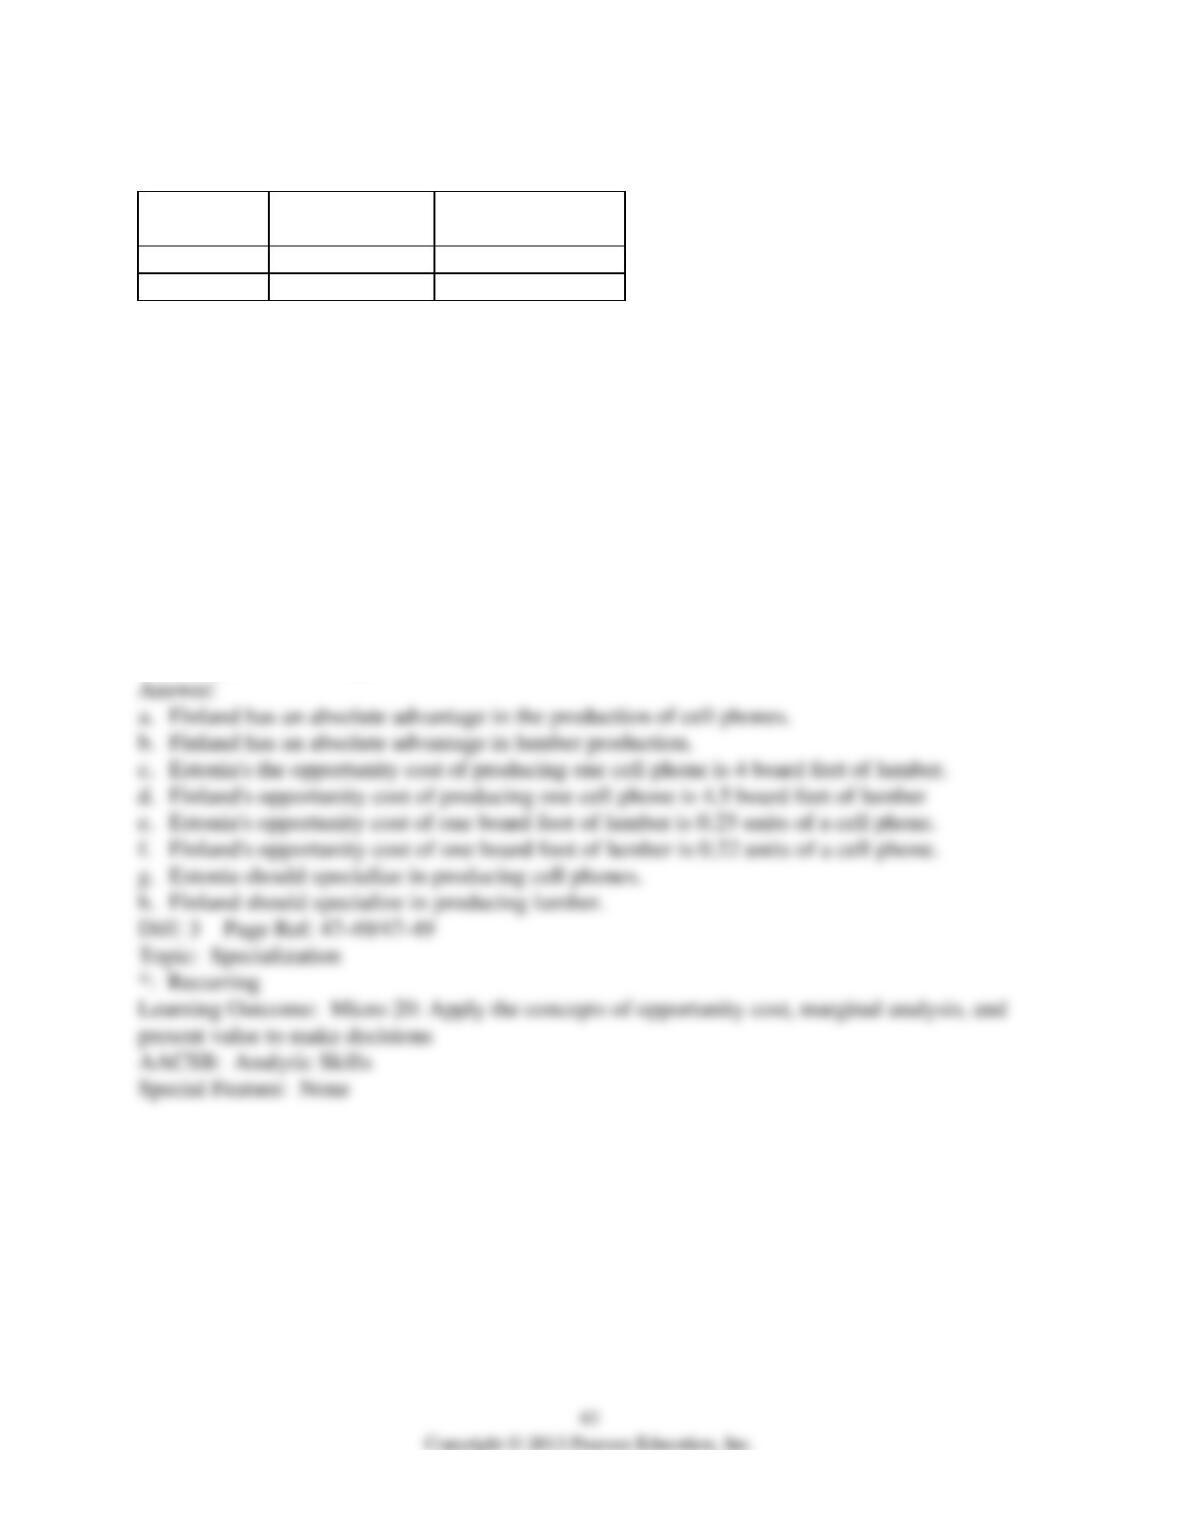
Table 2-5
Cell Phone
Lumber (board
feet)
Estonia
20 hours
5 hours
Finland
18 hours
4 hours
38) Refer to Table 2-5. This table shows the number of labor hours required to produce a cell
phone and a board foot of lumber in Estonia and Finland.
a. Which country has an absolute advantage in the production of cell phones?
b. Which country has an absolute advantage in the production of lumber?
c. What is Estonia’s opportunity cost of producing one cell phone?
d. What is Finland’s opportunity cost of producing one cell phone?
e. What is Estonia’s opportunity cost of producing one board foot of lumber?
f. What is Finland’s opportunity cost of producing one board foot of lumber?
g. If each country specializes in the production of the product in which it has a comparative
advantage, who should produce cell phones?
h. If each country specializes in the production of the product in which it has a comparative
advantage, who should produce lumber?
44
Table 2-6
Cell Phone
Lumber (board foot
)
Estonia
20 hours
5 hours
Finland
18 hours
4 hours
39) Refer to Table 2-6. This table shows the number of labor hours required to produce a cell
phone and a board foot of lumber in Estonia and Finland.
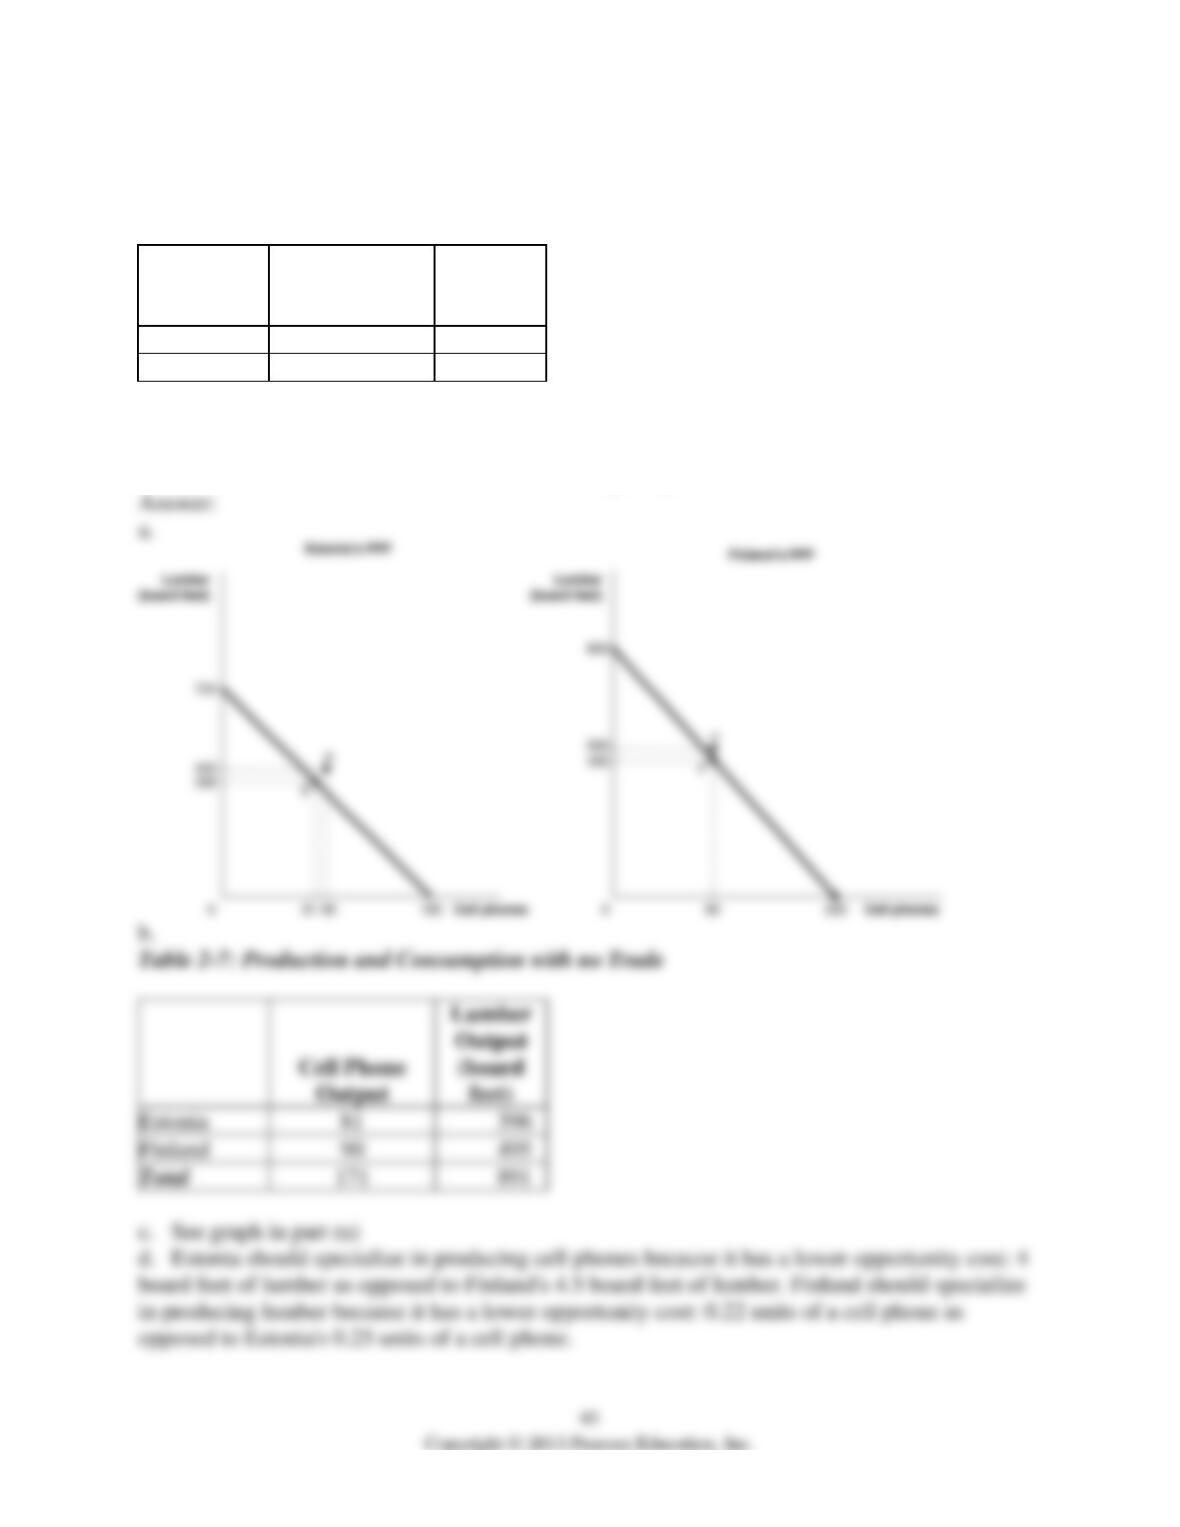
a. If each country has a total of 3,600 labor hours to devote to the production of the two goods,
draw the production possibilities frontier for each country. Put “Cell Phone” on the horizontal
axis and “Lumber” on the vertical axis. Be sure to identify the intercept values on your graphs.
b. Suppose each country allocates 55% its labor hours to lumber production and 45% to the
production of cell phones. Complete Table 2-7 below to show each country’s output of the two
products.
Table 2-7: Production and Consumption with no Trade
Cell Phone
Output
Lumber
Output
(board
feet)
Estonia
Finland
Total
c. If the two countries do not trade and consume whatever they produce, identify the current
production and consumption point for each country on their respective production possibilities
frontiers. Label Estonia’s consumption point “E” and Finland’s consumption point, “F.”
d. Suppose the two countries specialize and trade. Who should produce cell phones and who
should produce lumber? Explain your answer.
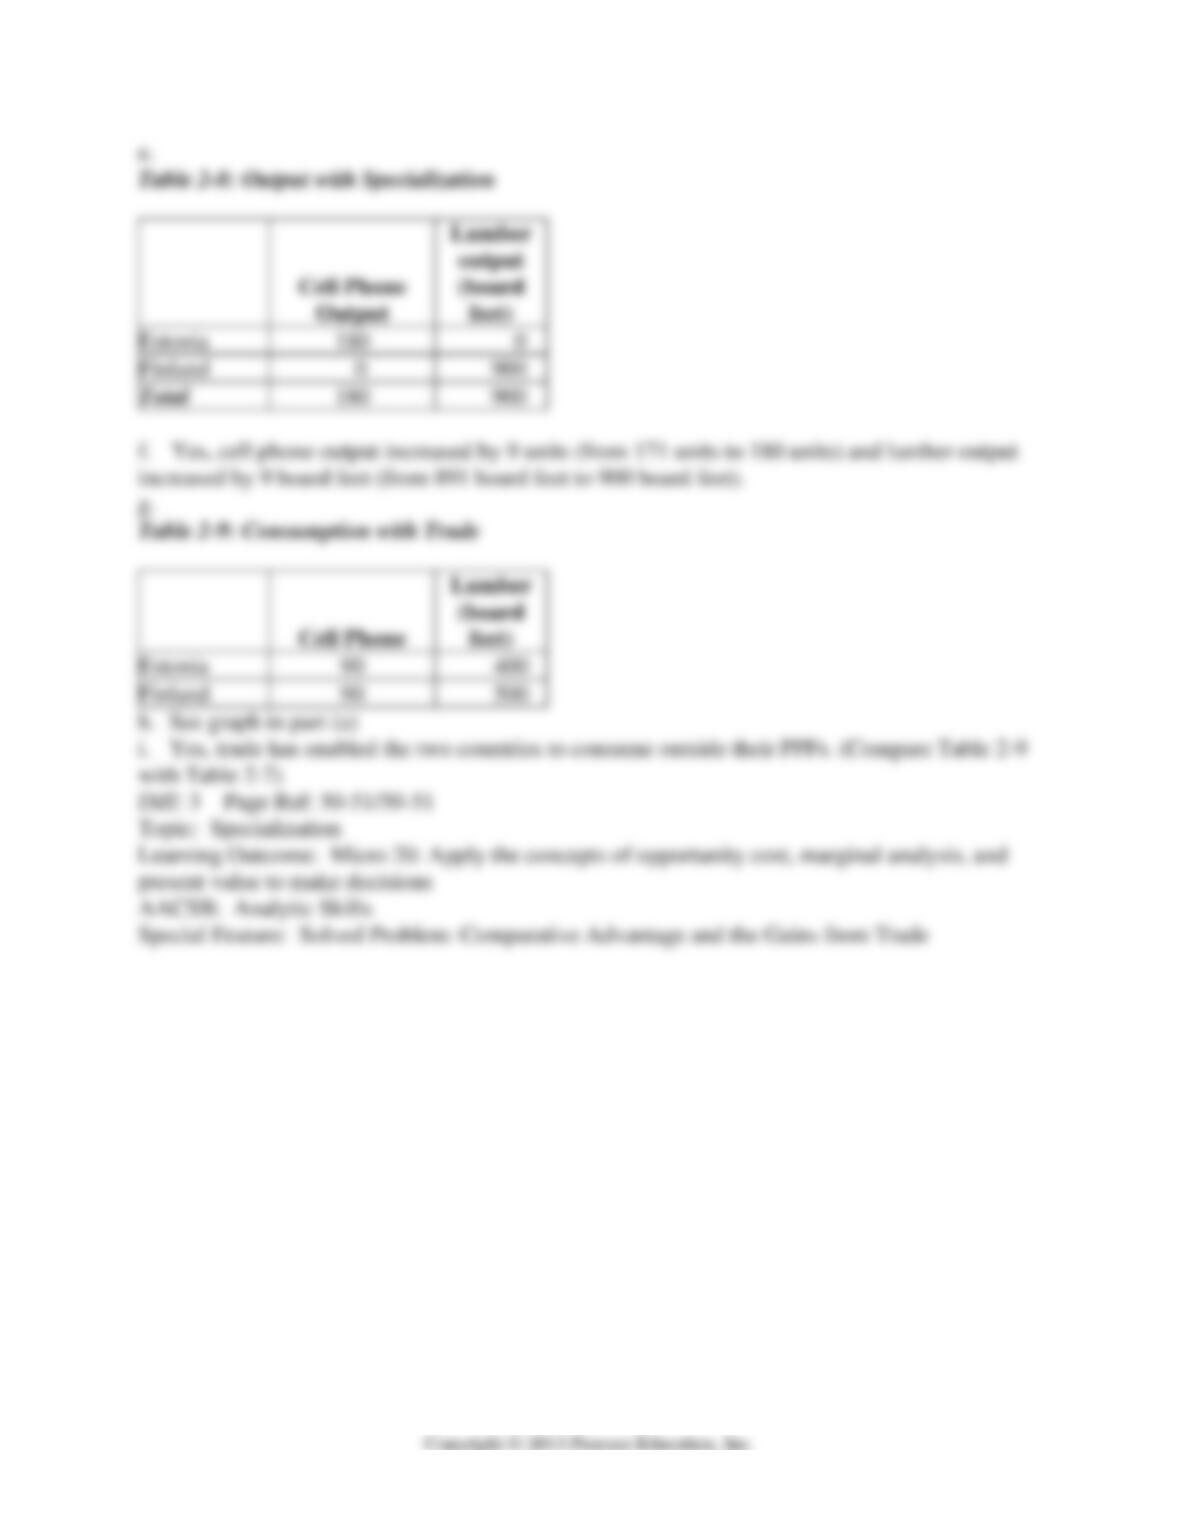
e. Complete Table 2-8 below to show each country’s output with specialization.
Table 2-8: Output with Specialization
Cell Phone
Output
Lumber
Output
(board
feet)
Estonia
Finland
Total
f. Did specialization increase the combined output for the two countries without any increase in
resources? If so, by how much?
g. Suppose Estonia and Finland agree to trade so that in exchange for 400 board feet of lumber,
the exporter of lumber receives 90 cell phones. Complete Table 2-9 below to show each
country’s consumption bundle after trade.
Table 2-9: Consumption with Trade
Cell Phone
Lumber
(board
feet)
Estonia
Finland
h. Show the consumption points after trade on each country’s production possibilities frontier.
Label these points “X” for Estonia and “Y” for Finland.
i. Has trade made the two countries better off? Explain your answer.
feet)
Finland
46
40) Suppose in the United States, the opportunity cost of producing a motor engine is 4 auto
bodies. In Canada, the opportunity cost of producing a motor engine is 2 auto bodies.
a. What is the opportunity cost of producing an auto body for the United States?
b. What is the opportunity cost of producing an auto body for Canada?
c. Which country has a comparative advantage in the production of auto bodies?
d. Which country has a comparative advantage in the production of motor engines?
2.3 The Market System
1) Which of the following is a factor of production?
A) a sofa produced by a furniture manufacturer
B) 20 shares of Microsoft stock
C) the janitor at the local elementary school
D) $500 in cash
2) An example of a factor of production is
A) a car produced by an auto manufacturer.
B) a worker hired by an auto manufacturer.
C) a loan granted to an auto manufacturer.
D) the automobiles exported by an auto manufacturer.
3) If a vineyard wants to raise funds to purchase a new bottling machine, it does so in the
A) factor market.
B) output market.
C) product market.
D) alcoholic beverages market.
4) A worker is hired in a
A) goods and services market.
B) product market.
C) government market.
D) factor market.
5) When you purchase a new surfboard you do so in the
A) resource market.
B) product market.
C) input market.
D) factor market.
6) The resource income earned by those who supply labor services is called
A) wages and salaries.
B) stock options.
C) profit.
D) bonus.
7) Which of the following statements about an entrepreneur is true?
A) purchases other factors of production in the output market
B) develops the vision for the firm and funds the producing unit
C) sells his entrepreneurial services in the output market
D) does not face personal risk
8) The circular flow model demonstrates
A) the role of the government in overseeing the market system.
B) the roles played by households and firms in the market system.
C) how shortages and surpluses are eliminated in a market.
D) how demand and supply for goods and services are brought into equilibrium.
9) Firms
A) have no influence on the circular flow in a market economy.
B) purchase resources in the product market.
C) sell goods in the product market.
D) sell resources in the factor market.
10) Households
A) purchase final goods and services in the factor market.
B) purchase final goods and services in the product market.
C) purchase resources in the product market.
D) purchase resources in the factor market.
11) In the circular flow model, households
A) sell goods and services in the input market.
B) and firms spend earnings from resource sales on goods and services in the factor market.
C) hire resources sold by firms in the factor market.
D) spend earnings from resource sales on goods and services in the product market.
12) Which of the following is not a flow in the circular flow model?
A) the flow of goods and services and the flow of resources to produce goods and services
B) the flow of profit and the flow of revenue
C) the flow of income earned by households and the flow of expenditures incurred by
households
D) the flow of revenue received by producers and the flow of payments to resource owners
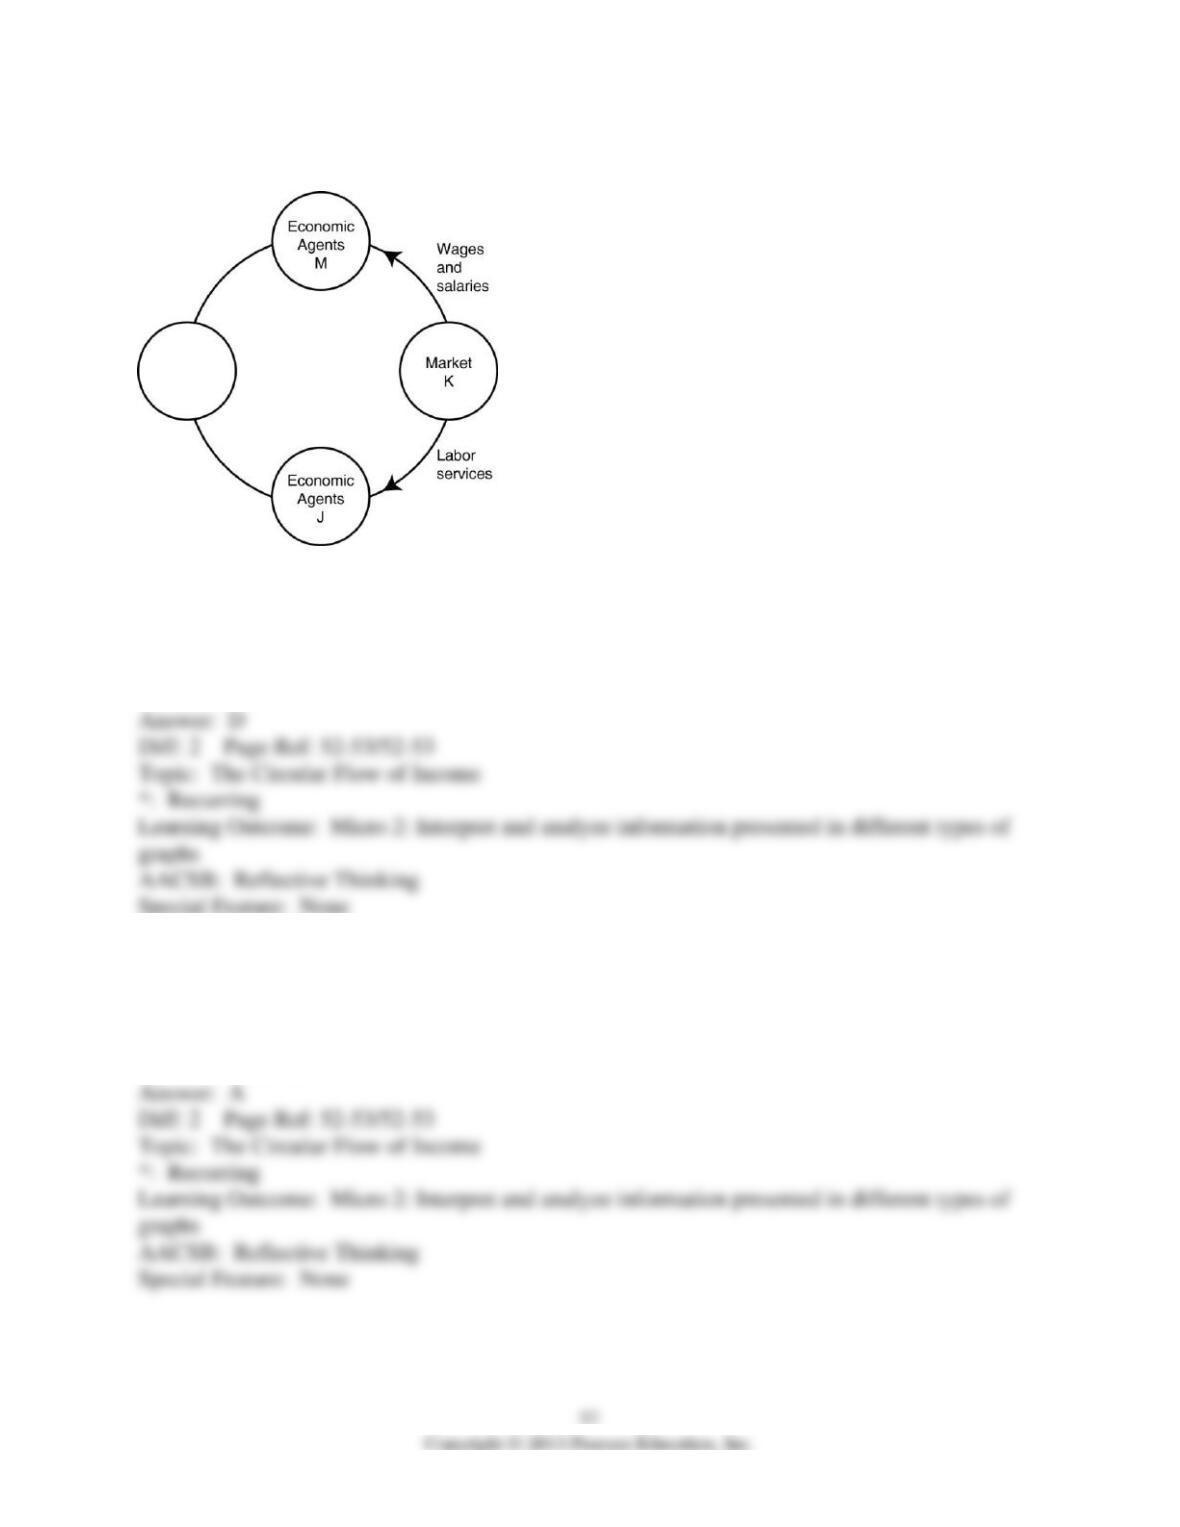
Figure 2-8
13) Refer to Figure 2-8. In the circular flow diagram, market K represents
A) households.
B) product markets.
C) firms.
D) factor markets.
14) Refer to Figure 2-8. In the circular flow diagram, economic agents M represent
A) households.
B) product markets.
C) firms.
D) factor markets.
15) Which of the following are represented by the same flow in the circular flow model?
A) the flow of goods and the flow of factors of production
B) the flow of costs and the flow of revenue
C) the flow of income earned from the sale of resources and the flow of expenditures on goods
and services.
D) the flow of income received by households and the flow of tax revenues paid by firms
16) Which of the following statements is true about a simple circular flow model?
A) Producers are neither buyers nor sellers in the product market.
B) Households are neither buyers nor sellers in the input market.
C) Producers are buyers in the factors market.
D) Households are sellers in the product market.