17. The following information pertains to Flintridge Corporation:
Profit margin for 2010
10.0%
Total assets, 12/31/2009
$430,000
Total assets, 12/31/2010
$470,000
Net income, 2010
$ 53,000
Calculate the asset turnover ratio for 2010. Round your answer to two decimal places.
18. Why is the quick ratio probably better than the current ratio as a measure of short-term liquidity?
19. For 20xx, Black & White Corporation had average total assets of $300,000, net sales of $250,000, net
income of $20,000, net cash flows from operating activities of $30,000, dividend payments of
$15,000, purchases of plant assets of $70,000, and sales of plant assets of $30,000. Using this
information, compute (a) cash flow yield, (b) cash flows to sales, (c) cash flows to assets, and (d) free
cash flow. Round amounts to one decimal place.
20. Using the following information from an annual report, prepare a vertical analysis of the consolidated
statement of earnings for the fiscal year ended June 30, 20xx. (Round percentage answers to one
decimal place.)
(In millions)
Net sales
$11,862
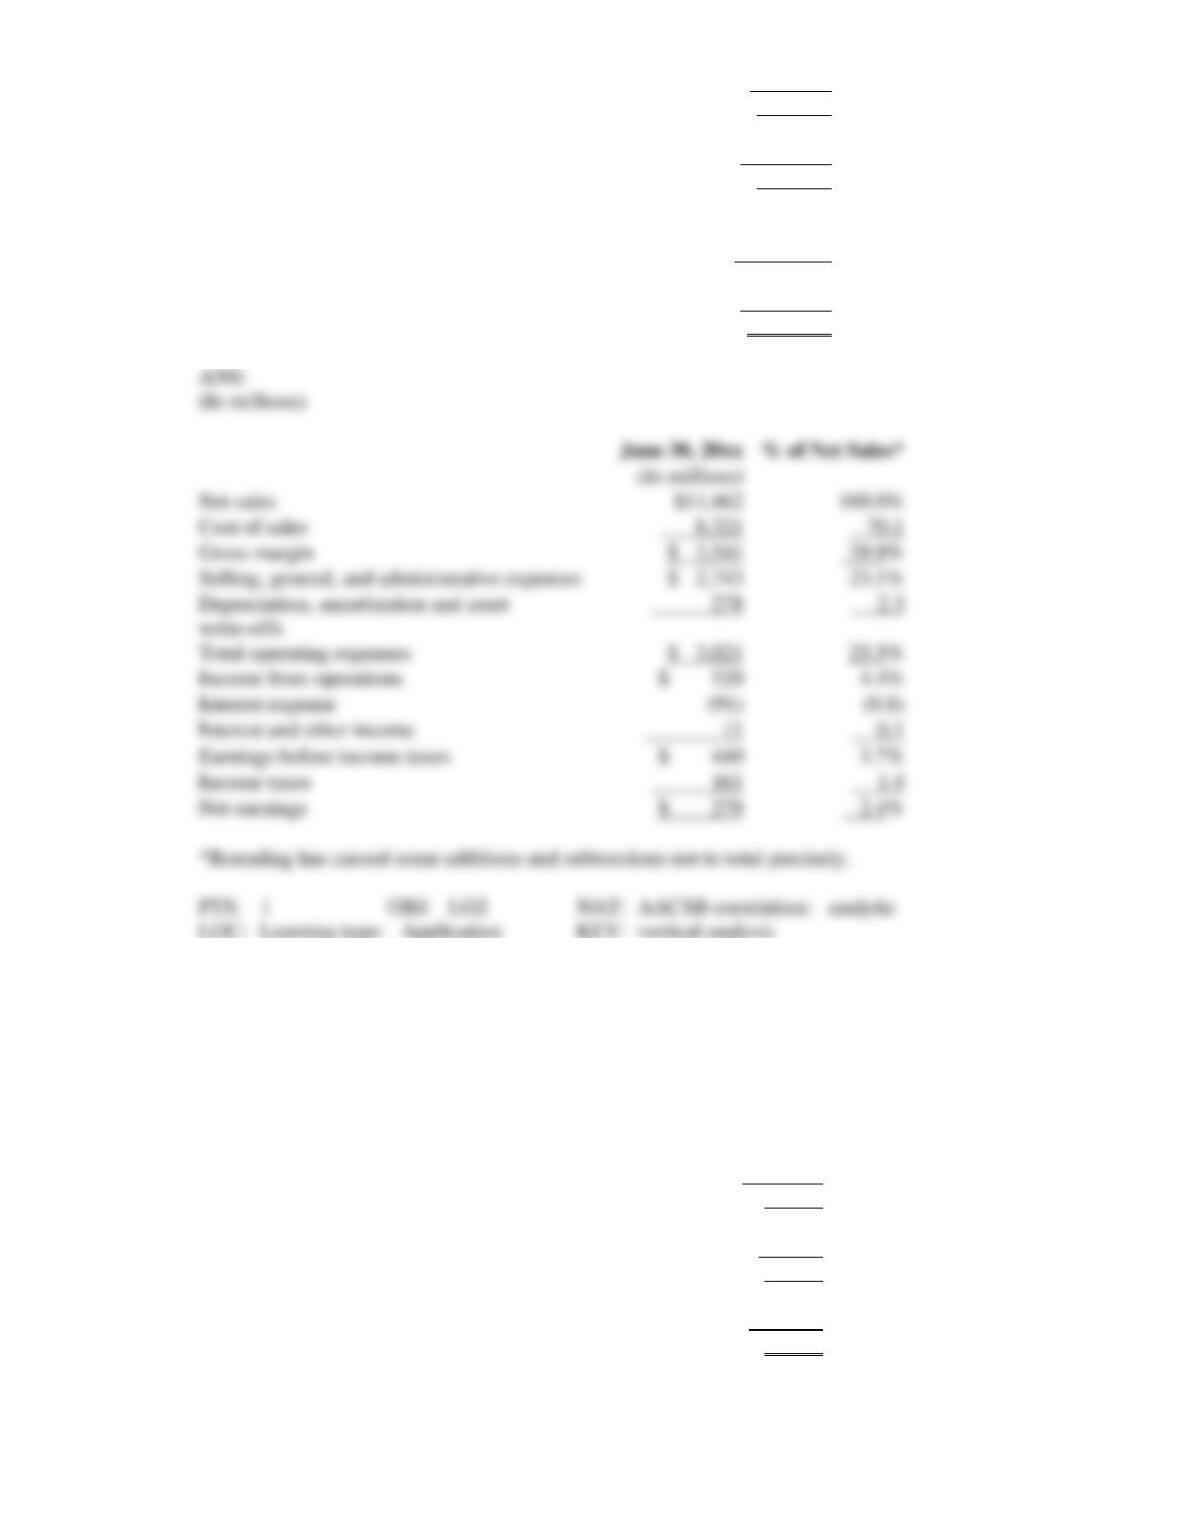
Cost of sales
8,321
Gross margin
$ 3,541
Selling, general, and administrative expenses
$ 2,743
Depreciation, amortization, and asset write-offs
278
Total operating expenses
$ 3,021
Income from operations
$ 520
Interest expense
(91)
Interest and other income
11
Earnings before income taxes
$ 440
Income taxes
161
Net earnings
$ 279
21. Using the following information from an annual report, prepare a vertical analysis of the consolidated
balance sheet at June 30, 20xx. (Round percentage answers to one decimal place.)
June 30, 20xx
(In millions)
Cash and cash equivalents
$ 584
Accounts and other receivables
182
Merchandise inventories
2,027
Prepaid expenses and other current assets
80
Total current assets
$2,873
Real estate, net
$2,342
Other, net
2,113
Total property and equipment
$4,455
Goodwill, net
$ 374
Other assets
651
Total assets
$8,353
Short-term borrowings
$ 278
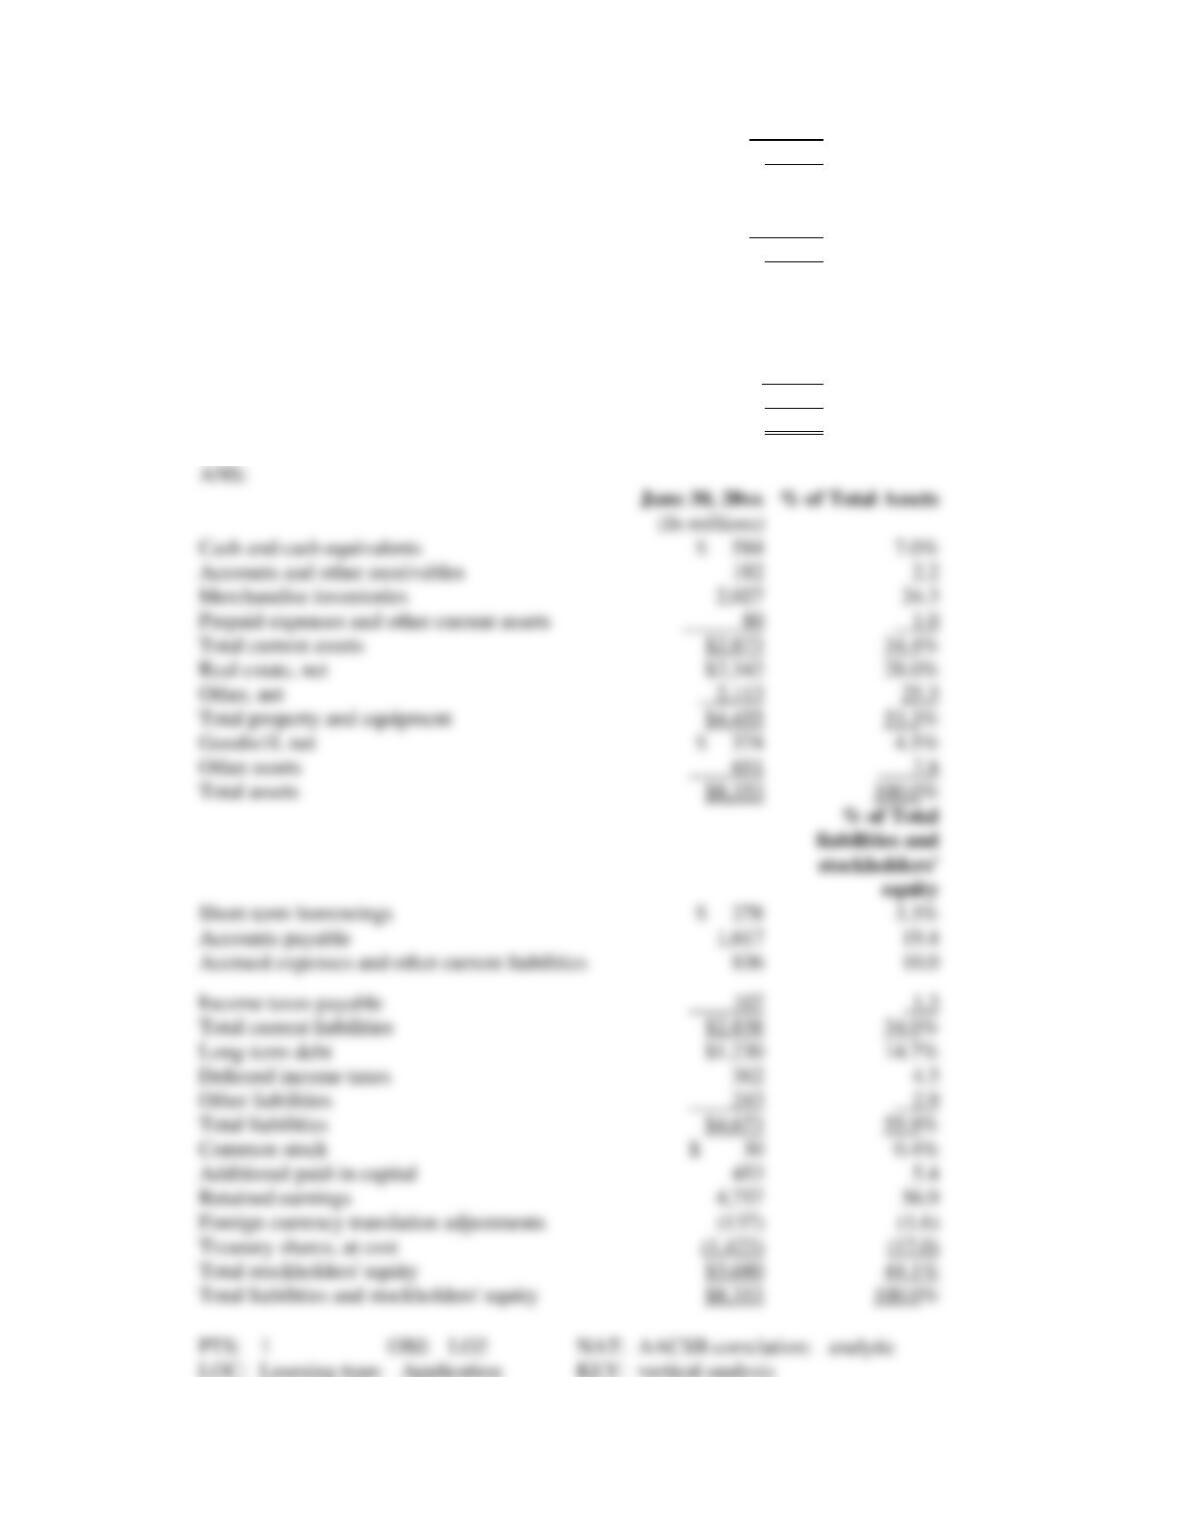
Accounts payable
1,617
Accrued expenses and other current liabilities
836
Income taxes payable
107
Total current liabilities
$2,838
Long-term debt
$1,230
Deferred income taxes
362
Other liabilities
243
Total liabilities
$4,673
Common stock
$ 30
Additional paid-in capital
453
Retained earnings
4,757
Foreign currency translation adjustments
(137)
Treasury shares, at cost
(1,423)
Total stockholders’ equity
$3,680
Total liabilities and stockholders’ equity
$8,353
Cash and cash equivalents
Accounts and other receivables
182
Merchandise inventories
2,027
Prepaid expenses and other current assets
Total current assets
Real estate, net
Other, net
Total property and equipment
Goodwill, net
Other assets
7.8
Total assets
Short-term borrowings
Accounts payable
1,617
Income taxes payable
Total current liabilities
Long-term debt
Deferred income taxes
362
Other liabilities
Total liabilities
Common stock
Additional paid-in capital
453
Retained earnings
4,757
Foreign currency translation adjustments
Treasury shares, at cost
Total stockholders’ equity
Total liabilities and stockholders’ equity
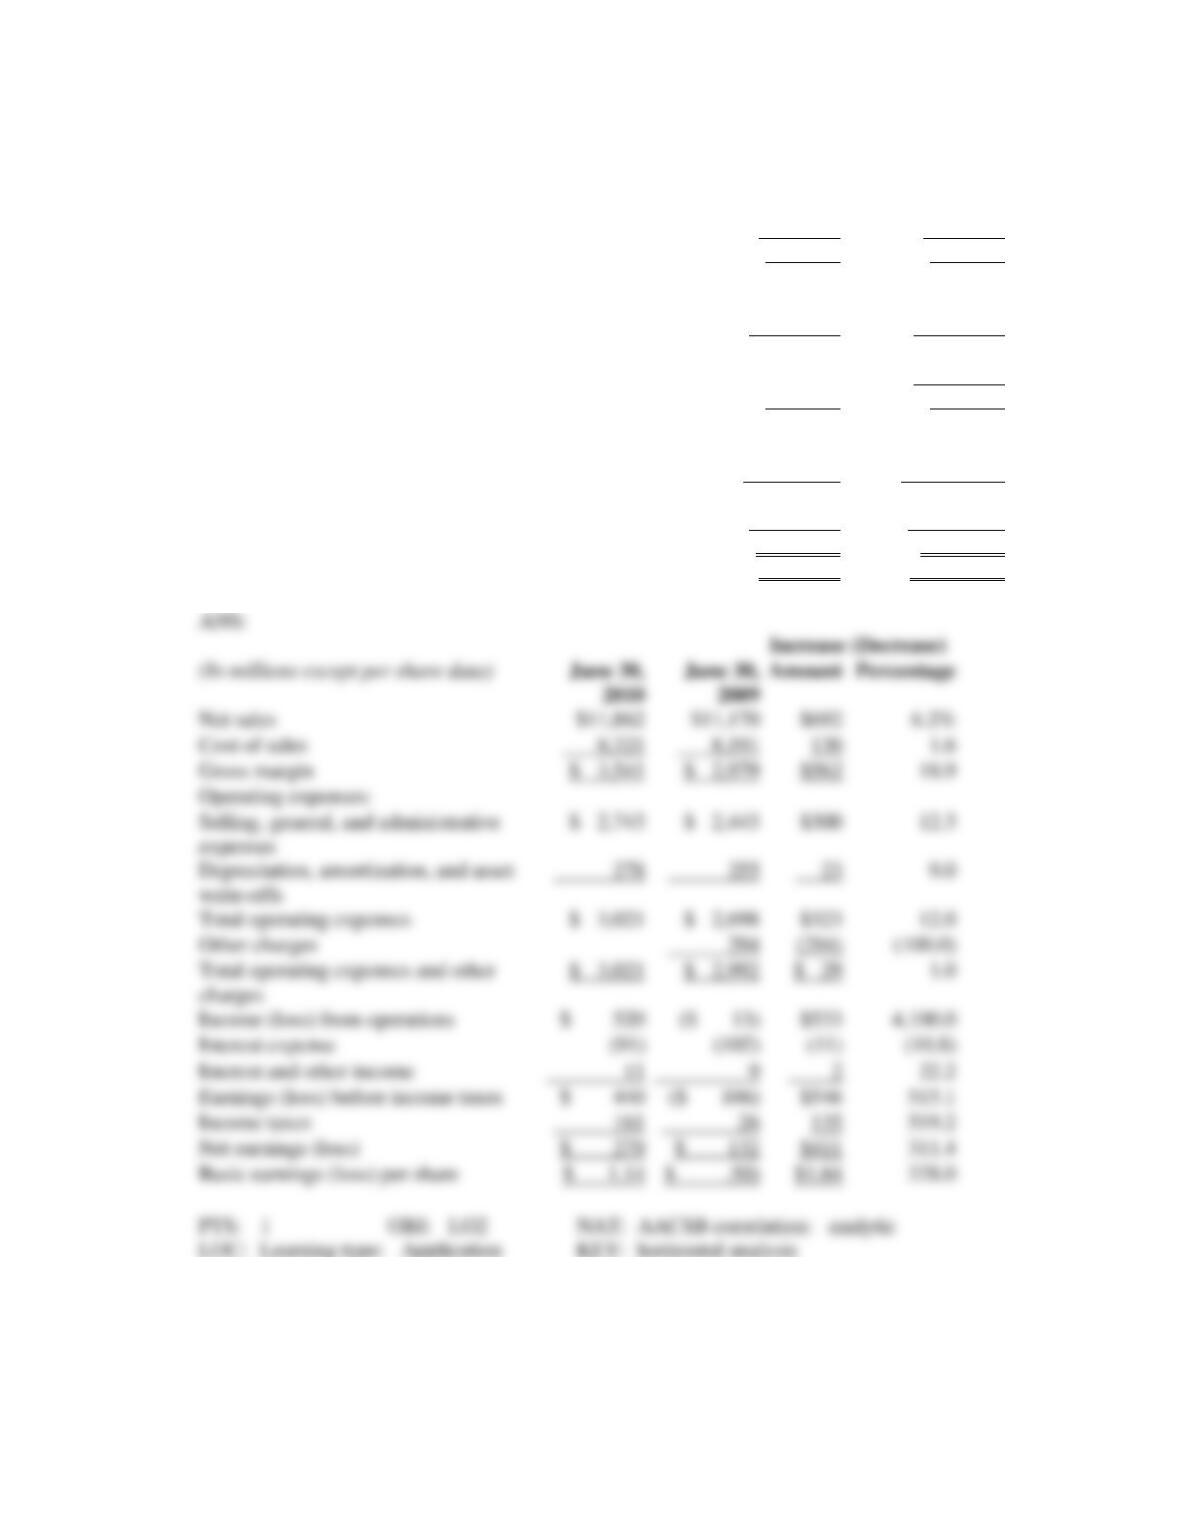
22. Using the following information from an annual report, prepare a horizontal analysis of the
consolidated statements of earnings. (Round percentage answers to one decimal place.)
(In millions except per share data)
June 30, 2010
June 30, 2009
Net sales
$11,862
$11,170
Cost of sales
8,321
8,191
Gross margin
$ 3,541
$ 2,979
Operating expenses:
Selling, general, and administrative expenses
$ 2,743
$ 2,443
Depreciation, amortization, and asset write-offs
278
255
Total operating expenses
$ 3,021
$ 2,698
Other charges
294
Total operating expenses and other charges
$ 3,021
$ 2,992
Income (loss) from operations
$ 520
($ 13)
Interest expense
(91)
(102)
Interest and other income
11
9
Earnings (loss) before income taxes
$ 440
($ 106)
Income taxes
161
26
Net earnings (loss)
$ 279
$ 132
Basic earnings (loss) per share
$ 1.14
$ .50)
23. Using the following information reported in an annual report, prepare a horizontal analysis of the
consolidated balance sheets. (Round percentage answers to one decimal place.)
(In millions)
June 30, 2010
June 30, 2009
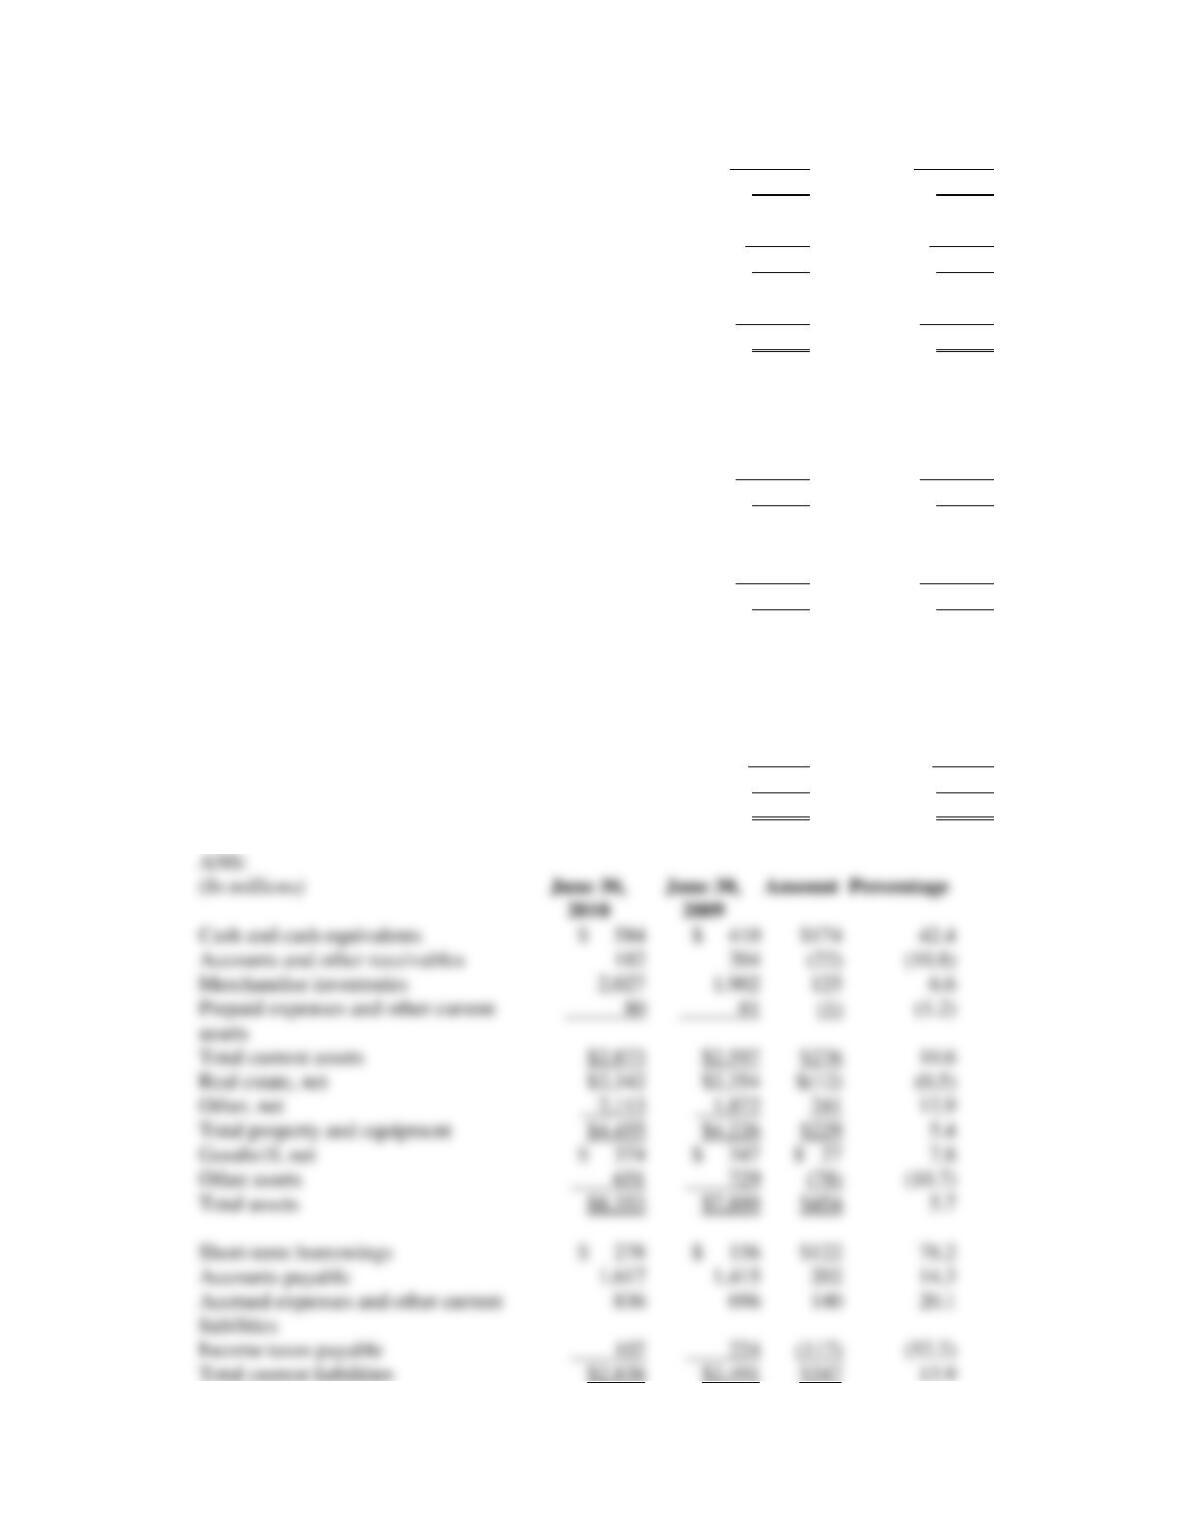
Cash and cash equivalents
$ 584
$ 410
Accounts and other receivables
182
204
Merchandise inventories
2,027
1,902
Prepaid expenses and other current assets
80
81
Total current assets
$2,873
$2,597
Real estate, net
$2,342
$2,354
Other, net
2,113
1,872
Total property and equipment
$4,455
$4,226
Goodwill, net
$ 374
$ 347
Other assets
651
729
Total assets
$8,353
$7,899
Short-term borrowings
$ 278
$ 156
Accounts payable
1,617
1,415
Accrued expenses and other current liabilities
836
696
Income taxes payable
107
224
Total current liabilities
$2,838
$2,491
Long-term debt
$1,230
$1,222
Deferred income taxes
362
333
Other liabilities
243
229
Total liabilities
$4,673
$4,275
Common stock
$ 30
$ 30
Additional paid-in capital
453
459
Retained earnings
4,757
4,478
Foreign currency translation adjustments
(137)
(100)
Treasury shares, at cost
(1,423)
(1,243)
Total stockholders’ equity
$3,680
$3,624
Total liabilities and stockholders’ equity
$8,353
$7,899
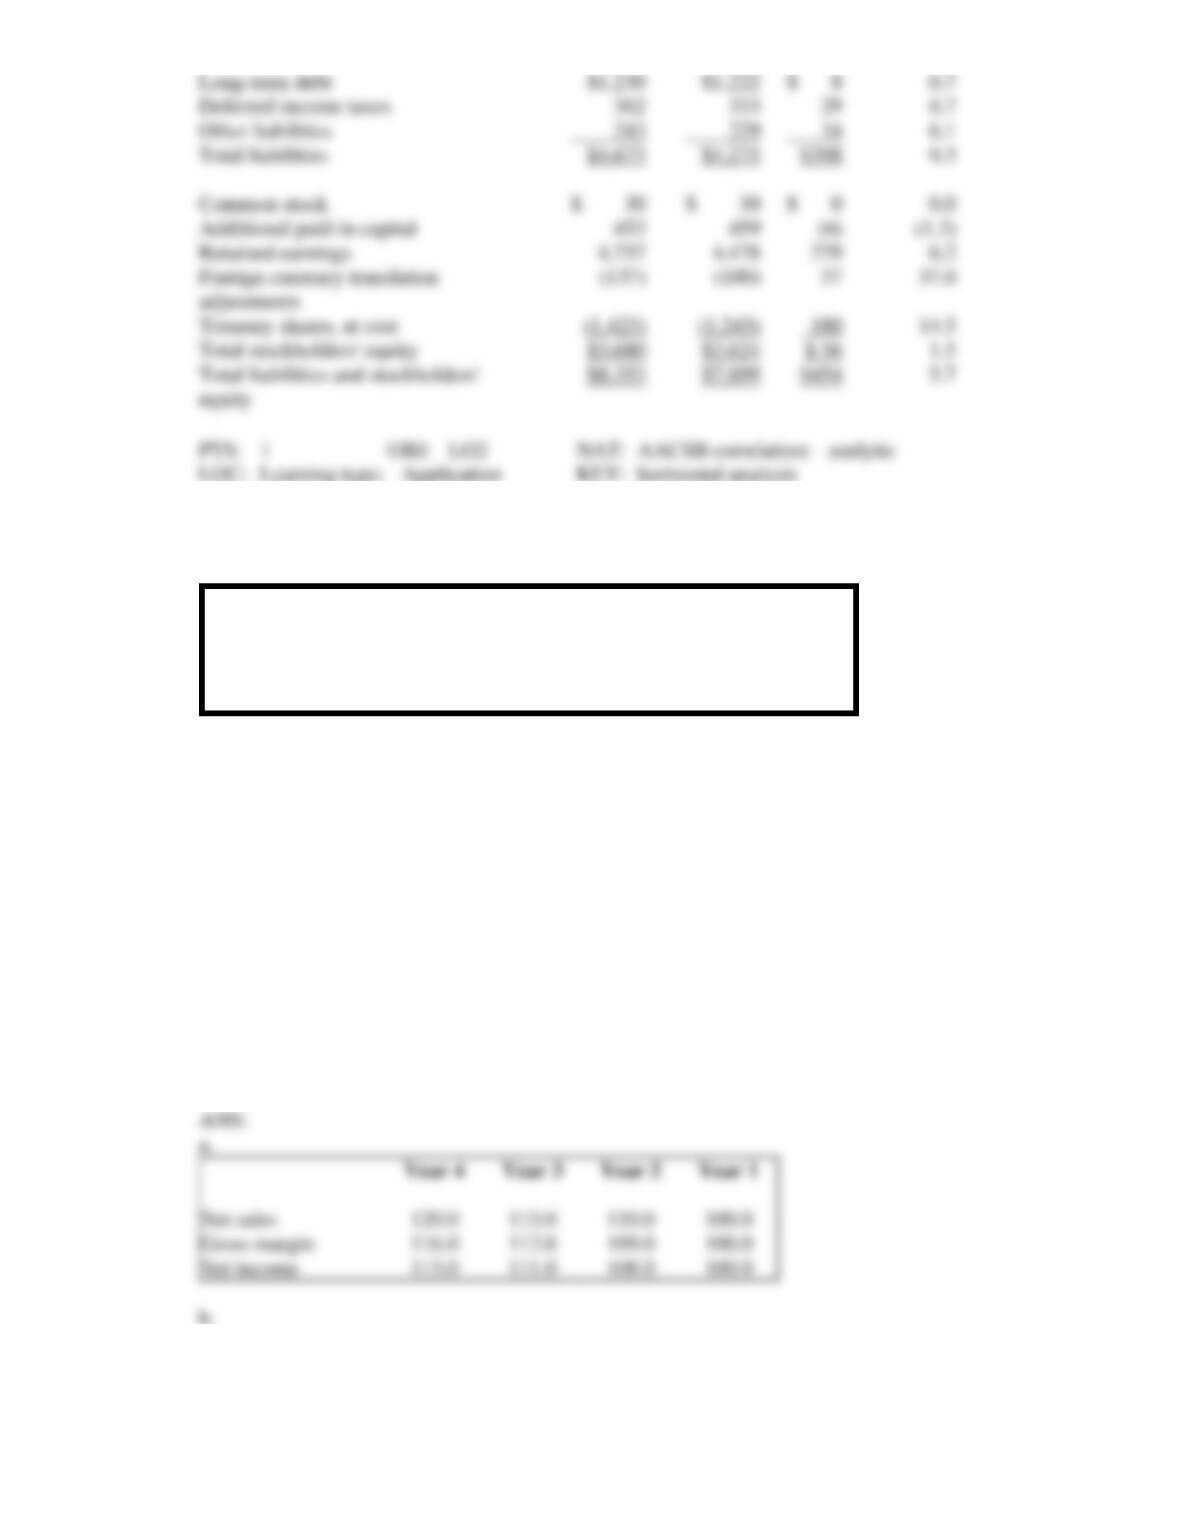
24. The following selected amounts were extracted from the financial statements of Missinger
Corporation.
Year 4
Year 3
Year 2
Year 1
Net sales
$720,000
$690,000
$660,000
$600,000
Gross margin
464,000
448,000
436,000
400,000
Net income
113,000
111,000
108,000
100,000
a. Prepare a trend analysis for net sales, gross margin, and net income using Year 1 as the base year.
b. For net sales, gross margin, and net income:
1. Calculate the percentage change from Year 1 to Year 2.
2. Calculate the percentage change from Year 2 to Year 3.
c. For each of the four years, compute the percentage relationship of gross margin to net sales and the
relationship of net income to net sales.
d. Identify which requirement(s) above involve(s):
1. Horizontal analysis
2. Vertical analysis
Round all answers to the nearest tenth of 1 percent.
Net sales
Gross margin
Net income
Long-term debt
Deferred income taxes
Other liabilities
Total liabilities
Common stock
Additional paid-in capital
Retained earnings
Treasury shares, at cost
Total stockholders’ equity
equity
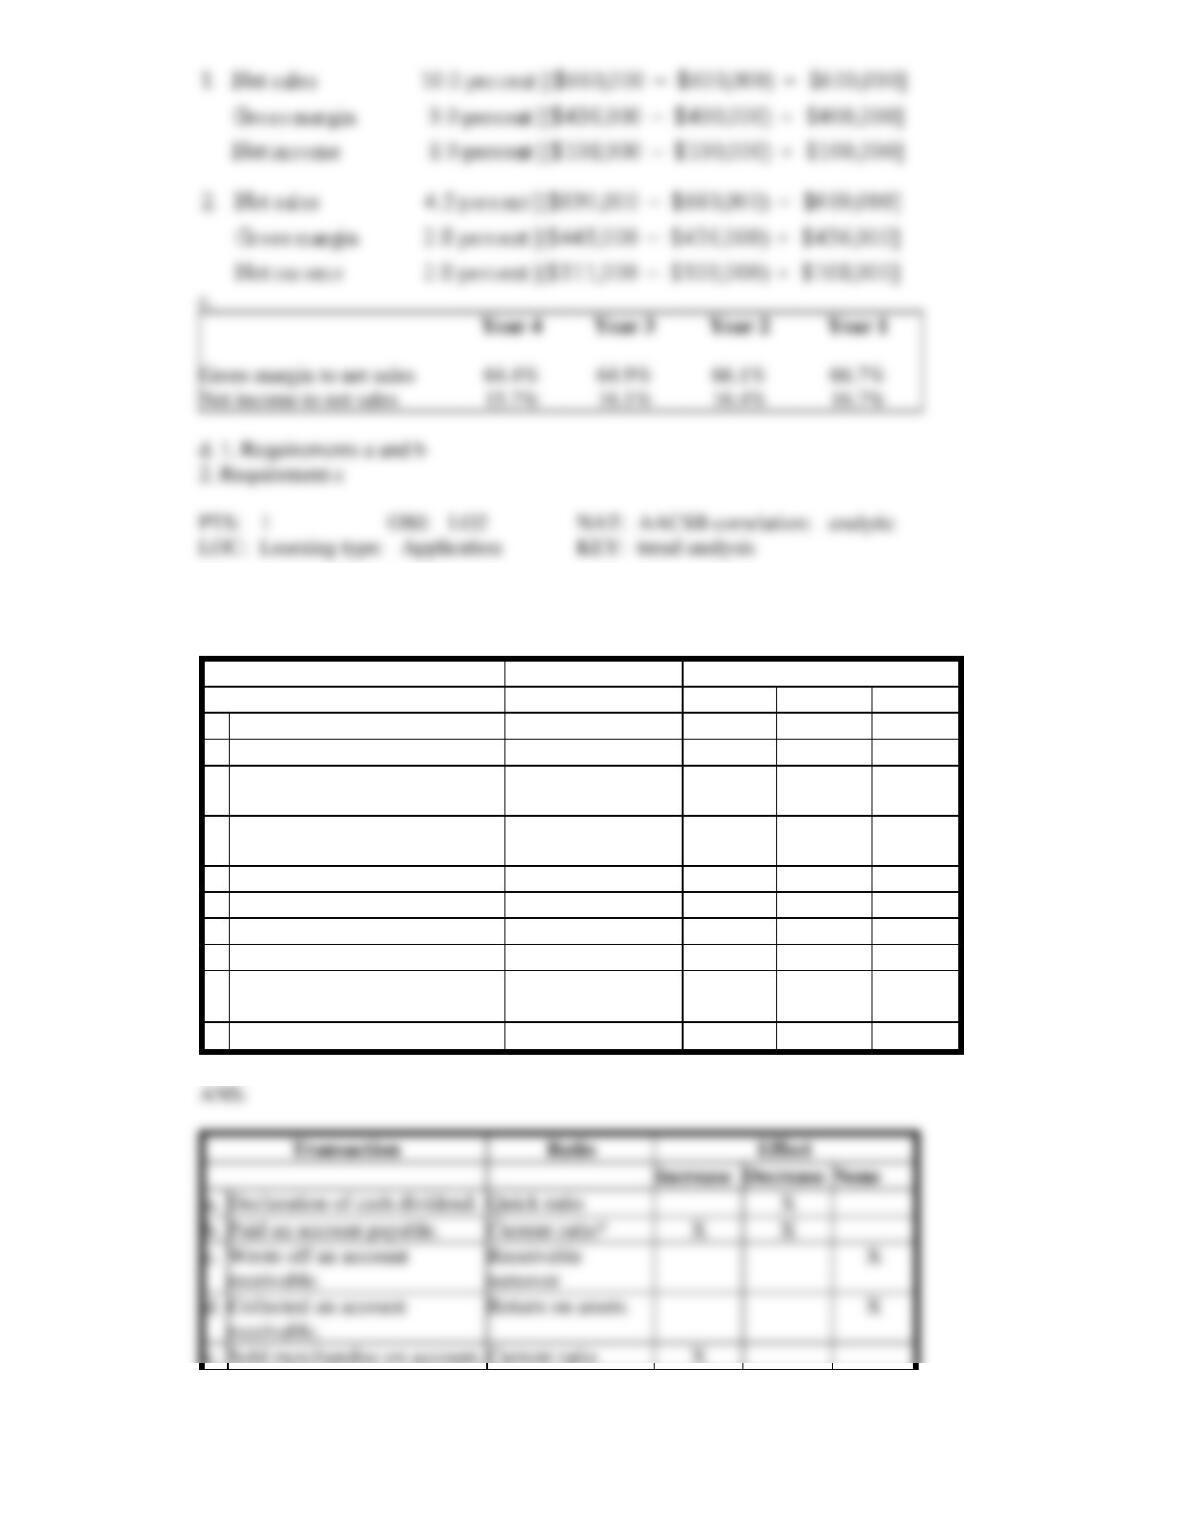
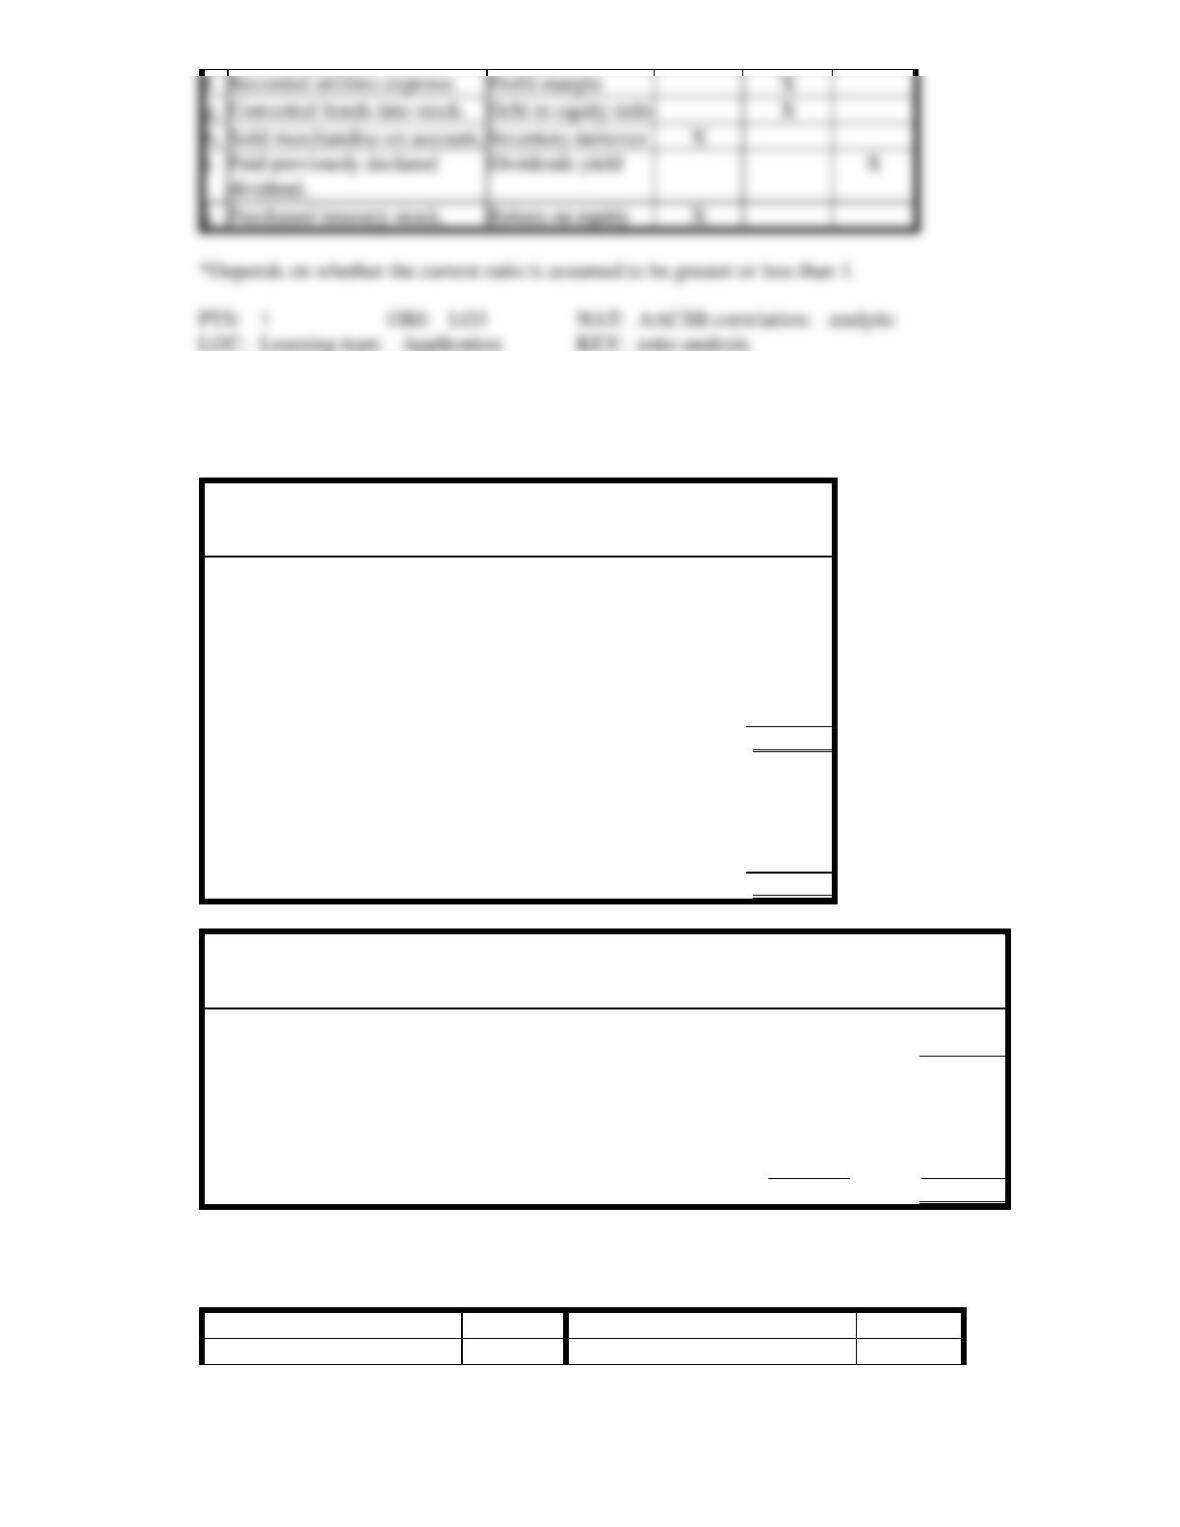
25. After each of the following transactions is a ratio. Mark an X in the appropriate space to indicate the
effect of the transaction on the ratio.
Transaction
Ratio
Effect
Increase
Decrease
None
a.
Declaration of cash dividend.
Quick ratio
b.
Paid an account payable.
Current ratio
c.
Wrote off an account
receivable.
Receivable turnover
d.
Collected an account
receivable.
Return on assets
e.
Sold merchandise on account.
Current ratio
f.
Recorded utilities expense.
Profit margin
g.
Converted bonds into stock.
Debt to equity ratio
h.
Sold merchandise on account.
Inventory turnover
i.
Paid previously declared
dividend.
Dividends yield
j.
Purchased treasury stock.
Return on equity
Declaration of cash dividend.
Quick ratio
Wrote off an account
receivable.
Receivable
turnover
receivable.
Sold merchandise on account.
Current ratio
Gross margin to net sales
Net income to net sales
26. From the following information, compute the ratios indicated and place the proper numbers in the
spaces provided. Assume the average for the year is the same as the ending balances for the balance
sheet accounts. Round percentages to one decimal place, and show your work.
Westwood Corporation
Balance Sheet
December 31, 20xx
Assets
Cash
$ 15,000
Marketable securities
10,000
Accounts receivable (net)
20,000
Inventory
30,000
Prepaid expenses
8,000
Property, plant, and equipment
117,000
Total assets
$200,000
Liabilities and Stockholders’ Equity
Current liabilities
$ 30,000
Long-term liabilities
50,000
Stockholders’ equity
120,000
Total liabilities and stockholders’ equity
$200,000
Westwood Corporation
Income Statement
For the Year Ended December 31, 20xx
Net sales
$160,000
Cost of goods sold
120,000
Gross margin
$ 40,000
Operating expenses
Selling and administrative expenses
$ 16,000
Interest expense
8,000
Income taxes expense
4,000
28,000
Net income
$ 12,000
Westwood had 4,000 shares of common stock issued and outstanding. The market price of common
stock at year end was $15.00 per share. Dividends paid in 20xx were $0.60 per share.
Current ratio
Asset turnover
Quick ratio
Return on assets
Purchased treasury stock.
Return on equity
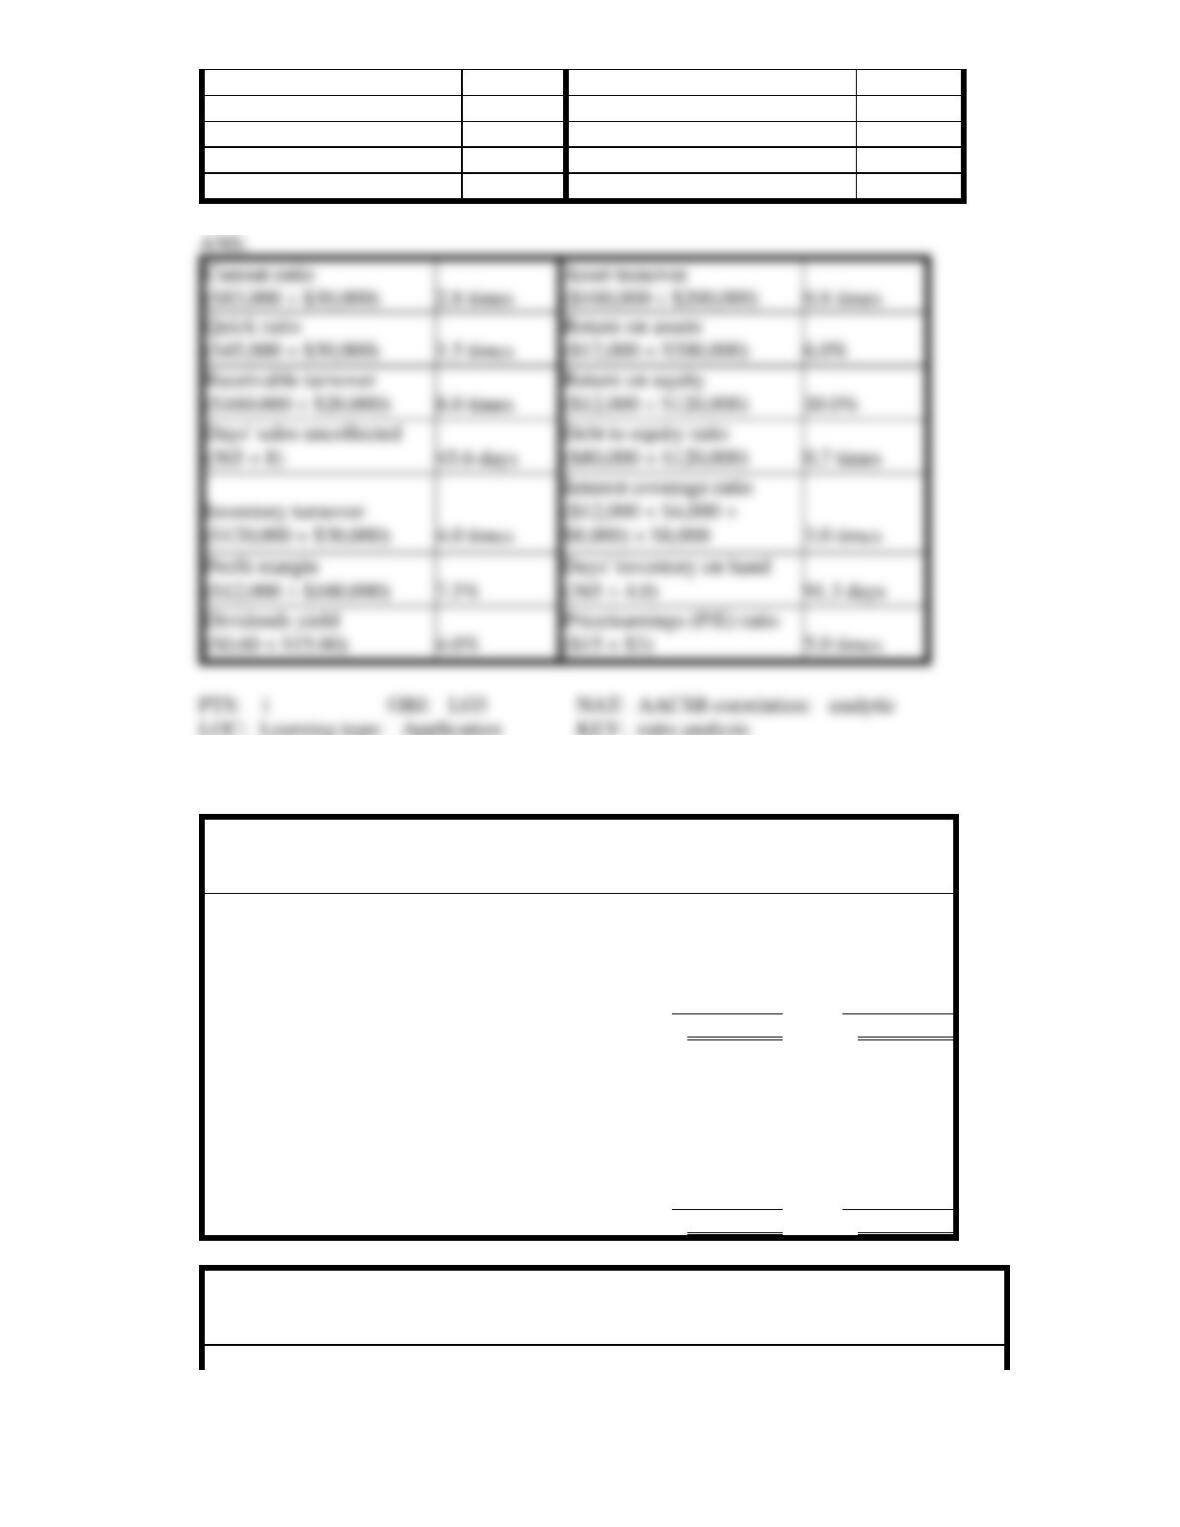
Receivable turnover
Return on equity
Days’ sales uncollected
Debt to equity ratio
Inventory turnover
Interest coverage ratio
Profit margin
Days’ inventory on hand
Dividends yield
Price/earnings (P/E) ratio
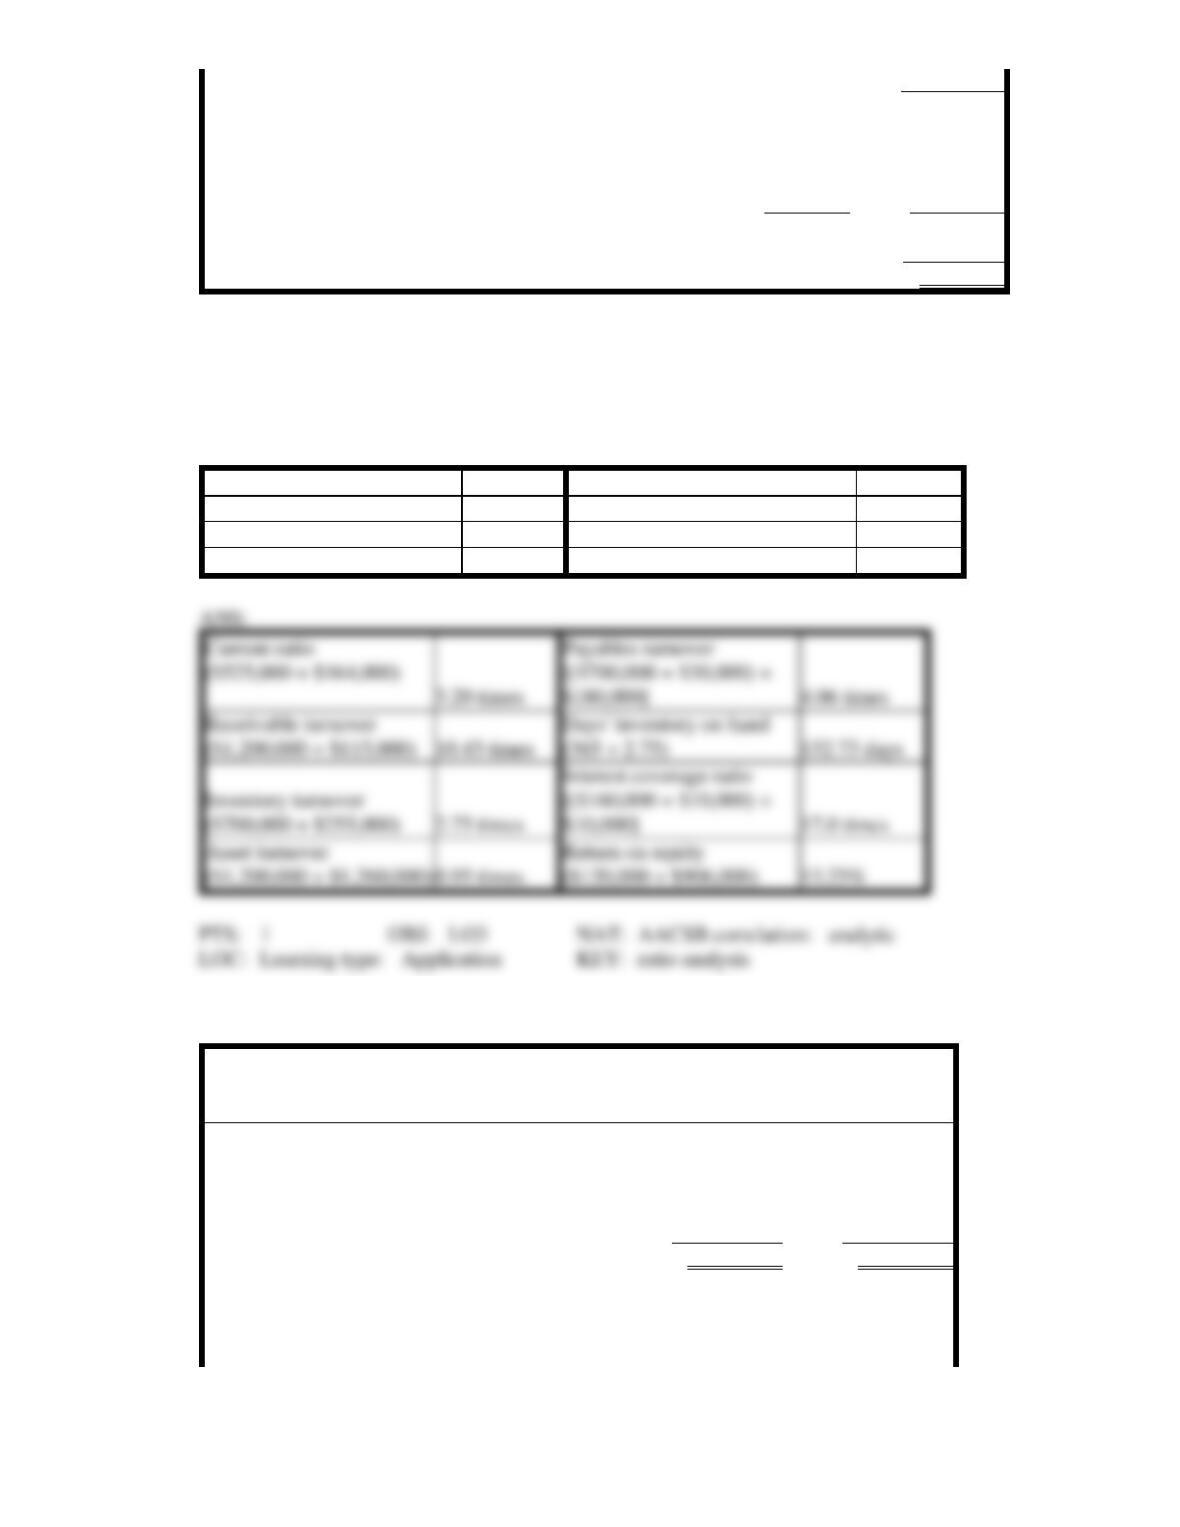
27. Financial statements for Boston Corporation are presented below.
Boston Corporation
Comparative Balance Sheet
December 31
Assets
2010
2009
Cash
$ 120,000
$ 110,000
Accounts receivable (net)
135,000
95,000
Inventory
270,000
240,000
Property, plant, and equipment (net)
750,000
800,000
Total assets
$1,275,000
$1,245,000
Liabilities and Stockholders’ Equity
Accounts payable
$ 152,000
$ 208,000
Accrued liabilities
12,000
16,000
Bonds payable, 10 percent
160,000
160,000
Common stock, $10 par
500,000
500,000
Retained earnings
451,000
361,000
Total liabilities and stockholders’ equity
$1,275,000
$1,245,000
Boston Corporation
Income Statement
For the Year Ended December 31, 2010
Net sales
$1,200,000
Cost of goods sold
700,000
Gross margin
$ 500,000
Operating expenses
Depreciation expense
$ 70,000
Interest expense
10,000
Other expenses
260,000
340,000
Income before income taxes
$ 160,000
Income taxes expense
40,000
Net income
$ 120,000
Note: Dividends of $0.60 per share were declared and paid during 20×8. The market price of the stock
on December 31, 2010 was $18.00 per share.
Compute the following for 2010and place your answers in the spaces provided. Round answers to two
decimal places. Show your work.
Current ratio
Payables turnover
Receivable turnover
Days’ inventory on hand
Inventory turnover
Interest coverage ratio
Asset turnover
Return on equity
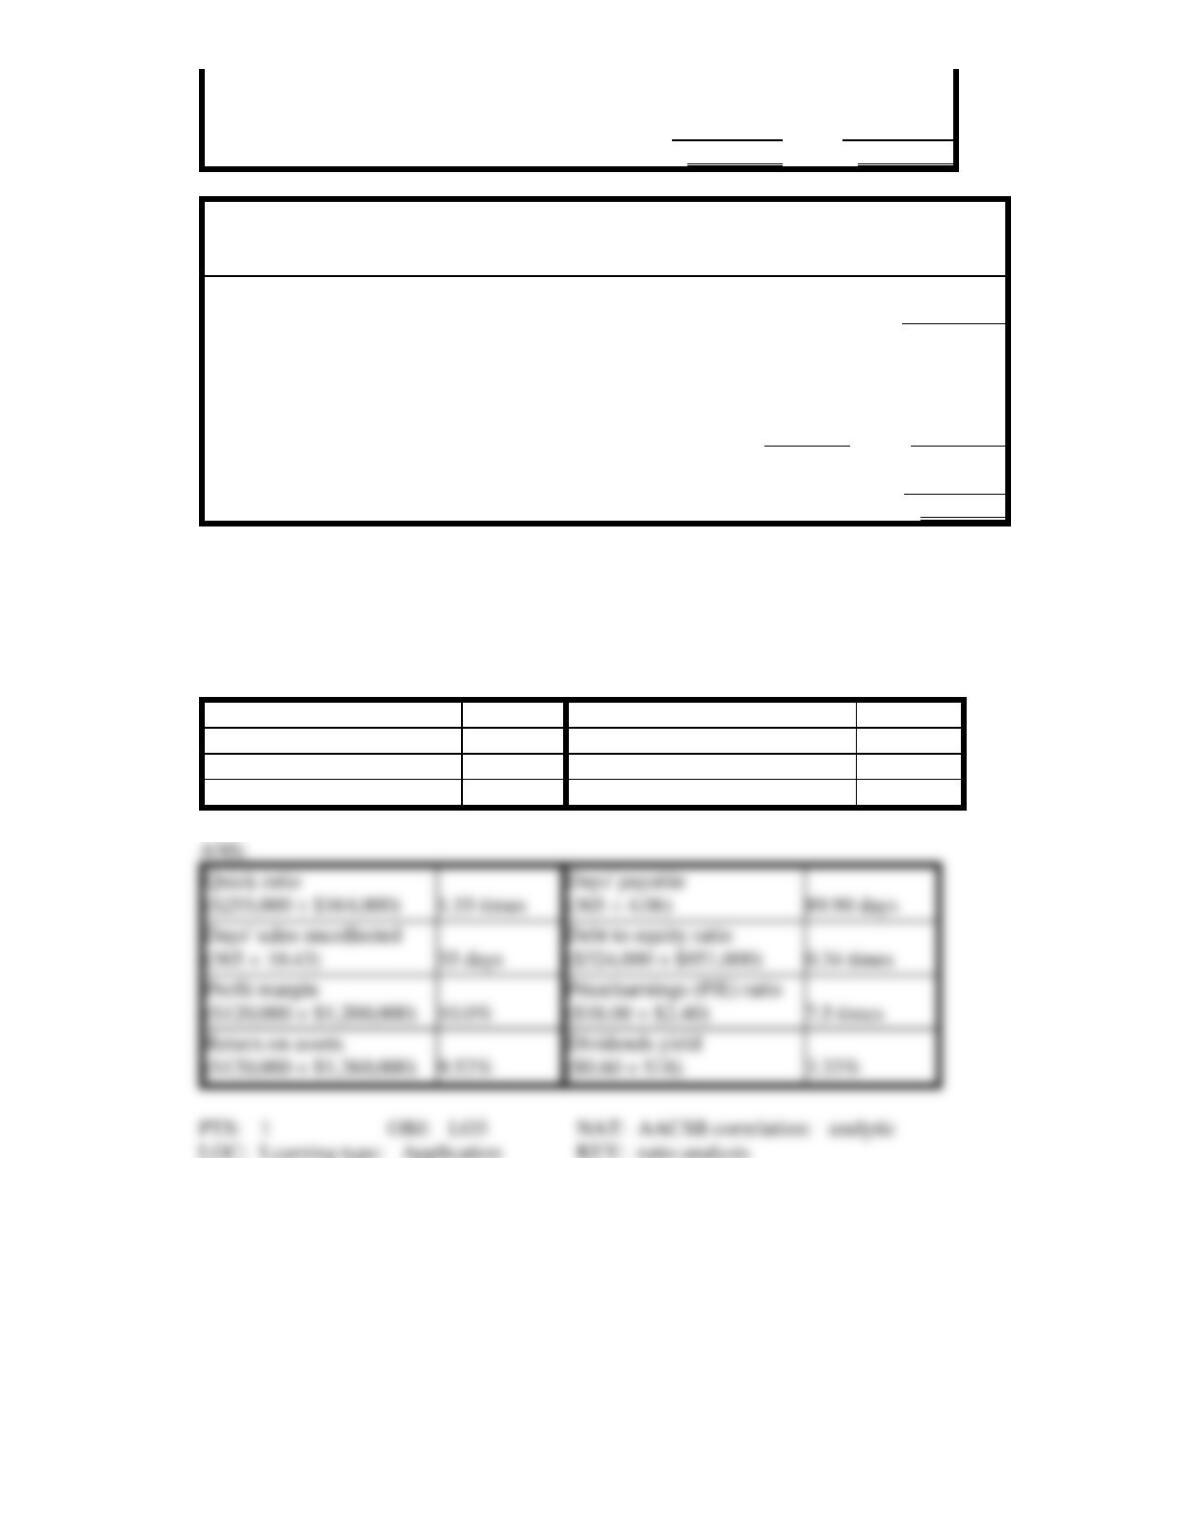
28. Financial statements for Cancun Corporation are presented below.
Cancun Corporation
Comparative Balance Sheet
December 31
Assets
2010
2009
Cash
$ 120,000
$ 110,000
Accounts receivable (net)
135,000
95,000
Inventory
270,000
240,000
Property, plant, and equipment (net)
750,000
800,000
Total assets
$1,275,000
$1,245,000
Liabilities and Stockholders’ Equity
Accounts payable
$ 152,000
$ 208,000
Accrued liabilities
12,000
16,000
Bonds payable, 10 percent
160,000
160,000
Common stock, $10 par
500,000
500,000
Retained earnings
451,000
361,000
Total liabilities and stockholders’ equity
$1,275,000
$1,245,000
Cancun Corporation
Income Statement
For the Year Ended December 31, 2010
Net sales
$1,200,000
Cost of goods sold
700,000
Gross margin
$ 500,000
Operating expenses
Depreciation expense
$ 70,000
Interest expense
10,000
Other expenses
260,000
340,000
Income before income taxes
$ 160,000
Income taxes expense
40,000
Net income
$ 120,000
Note: Dividends of $0.60 per share were declared and paid during 20×8. The market price of the stock
on December 31, 2010 was $18.00 per share.
Compute the following for 2010 and place your answers in the spaces provided. Round answers to two
decimal places. Show your work.
Quick ratio
Days’ payable
Days’ sales uncollected
Debt to equity ratio
Profit margin
Price/earnings (P/E) ratio
Return on assets
Dividends yield
29. Use the following information to calculate the ratios requested below. Round answers to two decimal
places. Show your work.
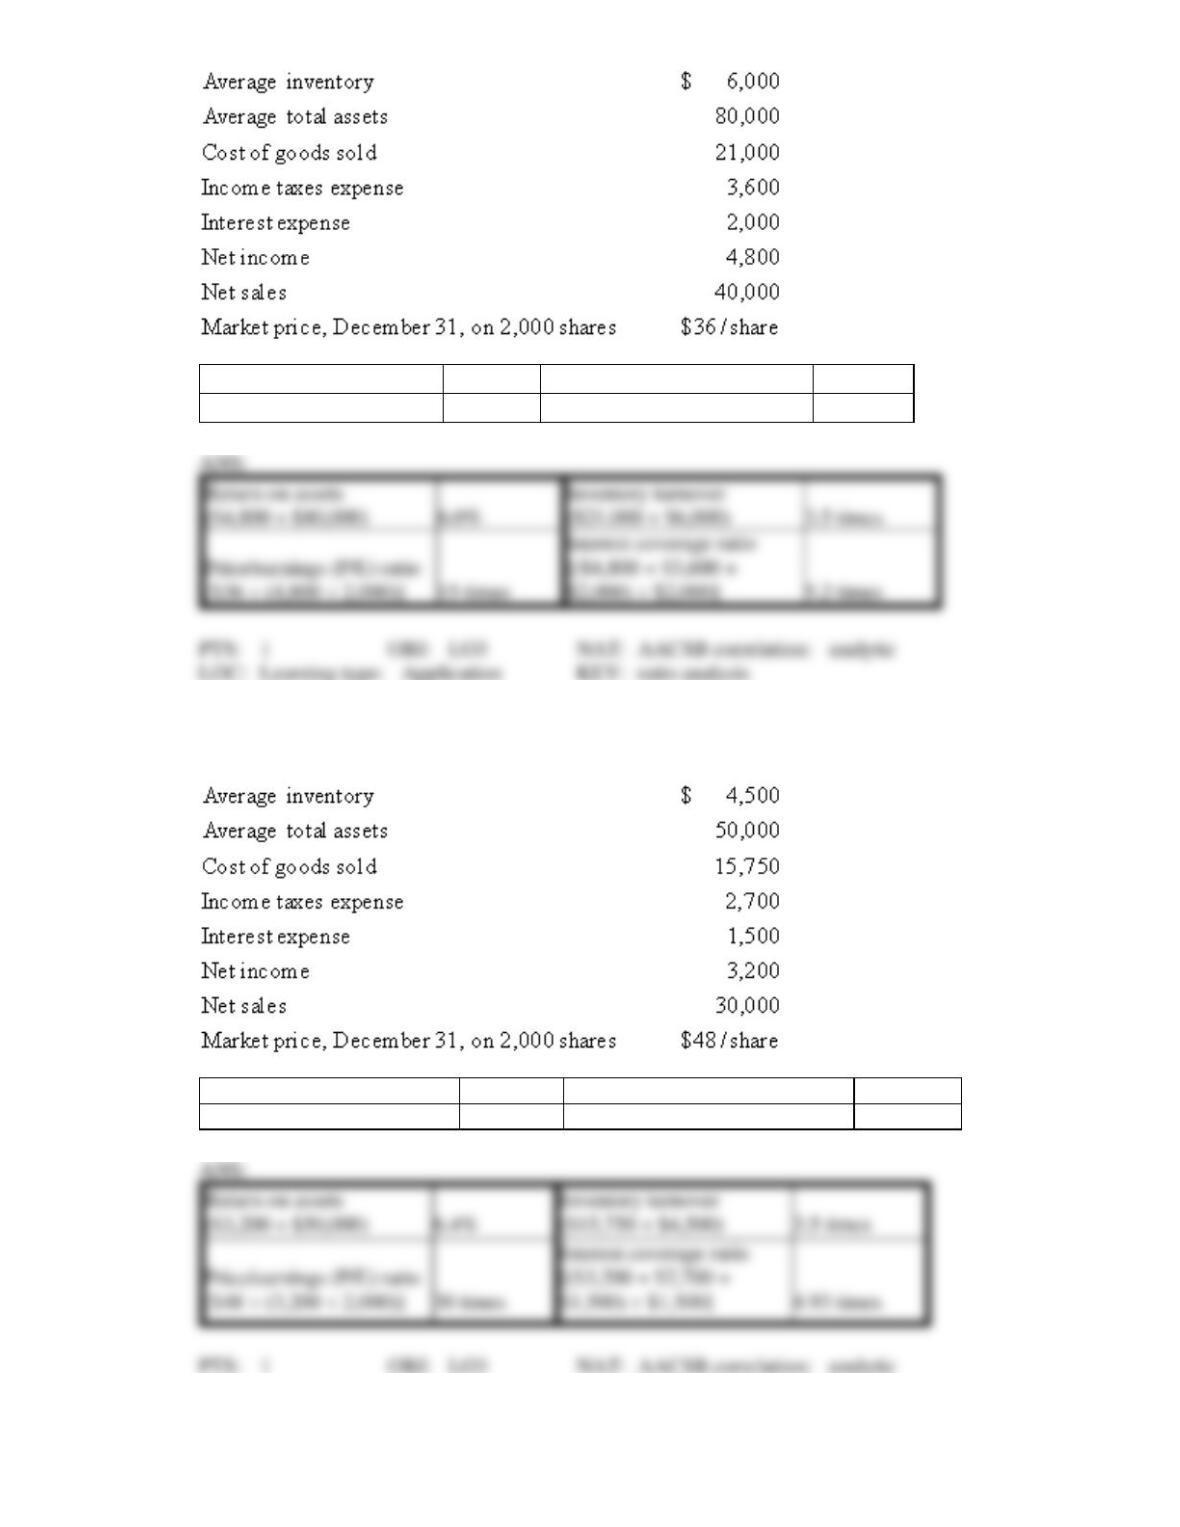
Return on assets
Inventory turnover
Price/earnings (P/E) ratio
Interest coverage ratio
30. Use the following information to calculate the ratios requested below. Round answers to two decimal
places. Show your work.
Return on assets
Inventory turnover
Price/earnings (P/E) ratio
Interest coverage ratio
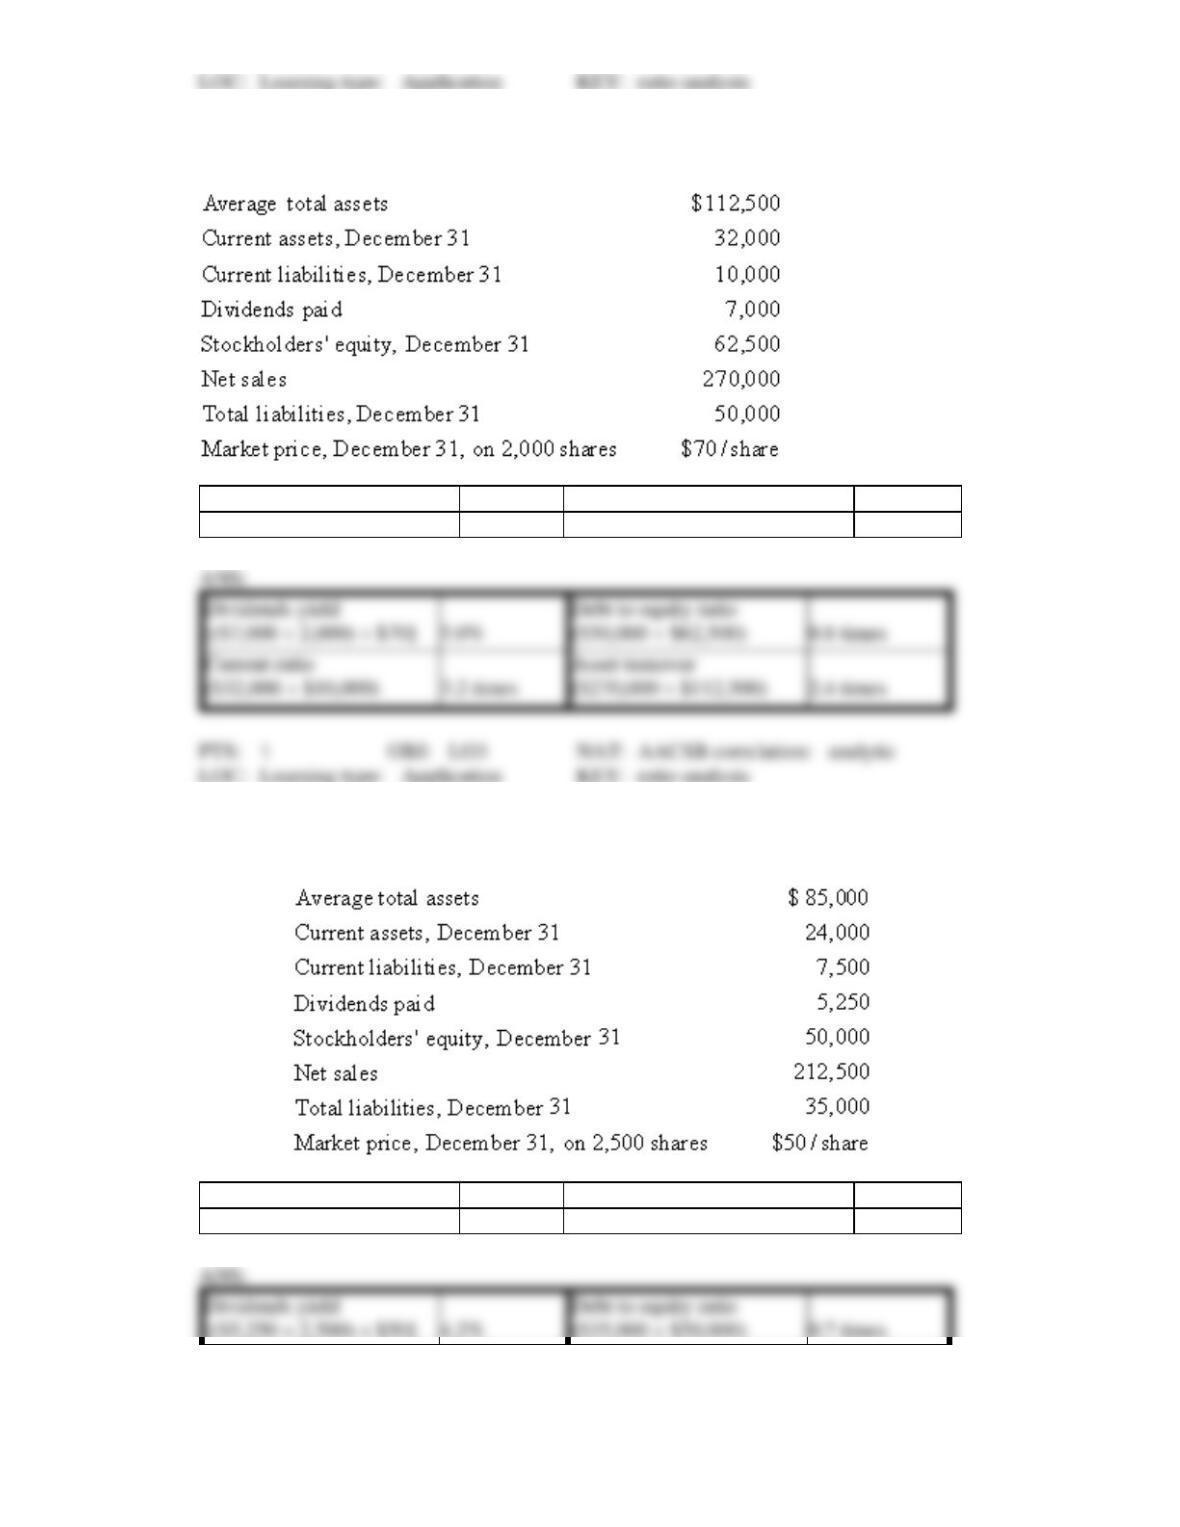
31. Use the following information to calculate the ratios requested below. Round answers to two decimal
places. Show your work.
Dividends yield
Debt to equity ratio
Current ratio
Asset turnover
32. Use the following information to calculate the ratios requested below. Round answers to two decimal
places. Show your work.
Dividends yield
Debt to equity ratio
Current ratio
Asset turnover