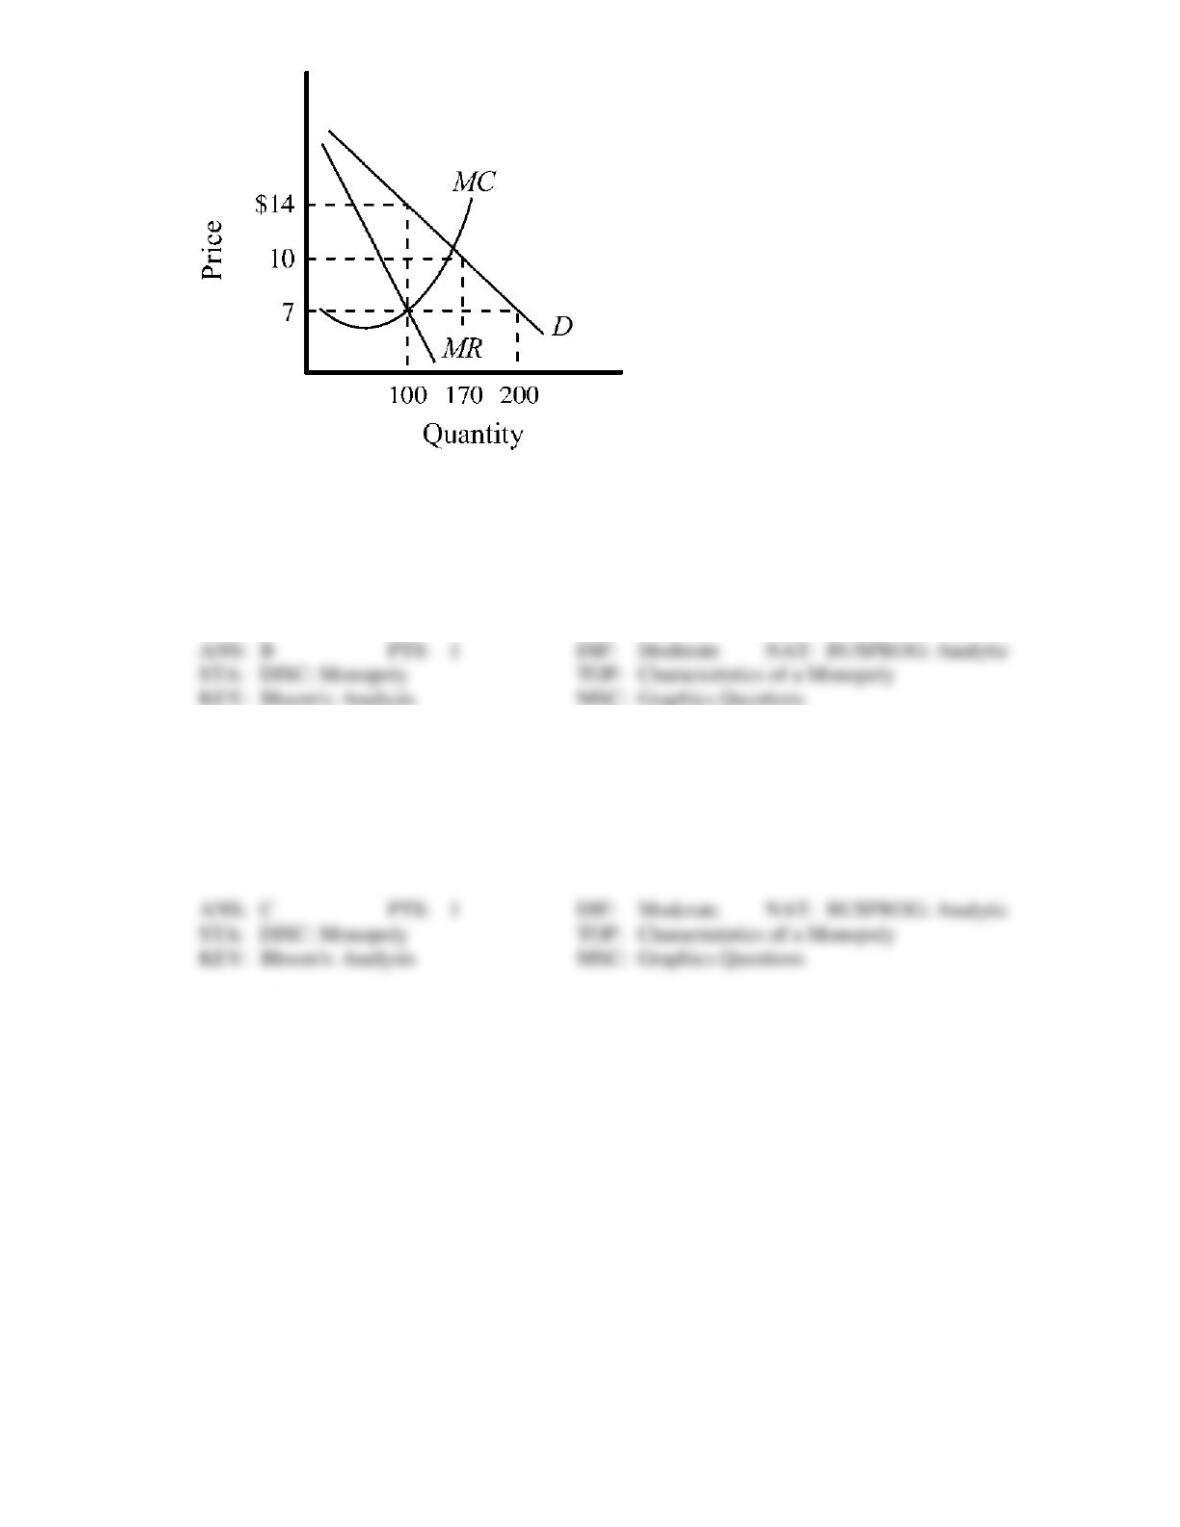
151. The demand and cost conditions in an industry are as depicted in Figure 11-7. In the viewpoint of
economic efficiency, what would the ideal price and output be?
a.
price, $7; quantity produced, 100
b.
price, $10; quantity produced, 170
c.
price, $14; quantity produced, 100
d.
price, $7; quantity produced, 200
152. If the output in the industry is produced by a monopolist, at what price will the good sell and what
quantity will be produced in Figure 11-7?
a.
price, $7; quantity produced, 100
b.
price, $10; quantity produced, 170
c.
price, $14; quantity produced, 100
d.
price, $7; quantity produced, 200
Use the figure to answer the following question(s).
Figure 11-8
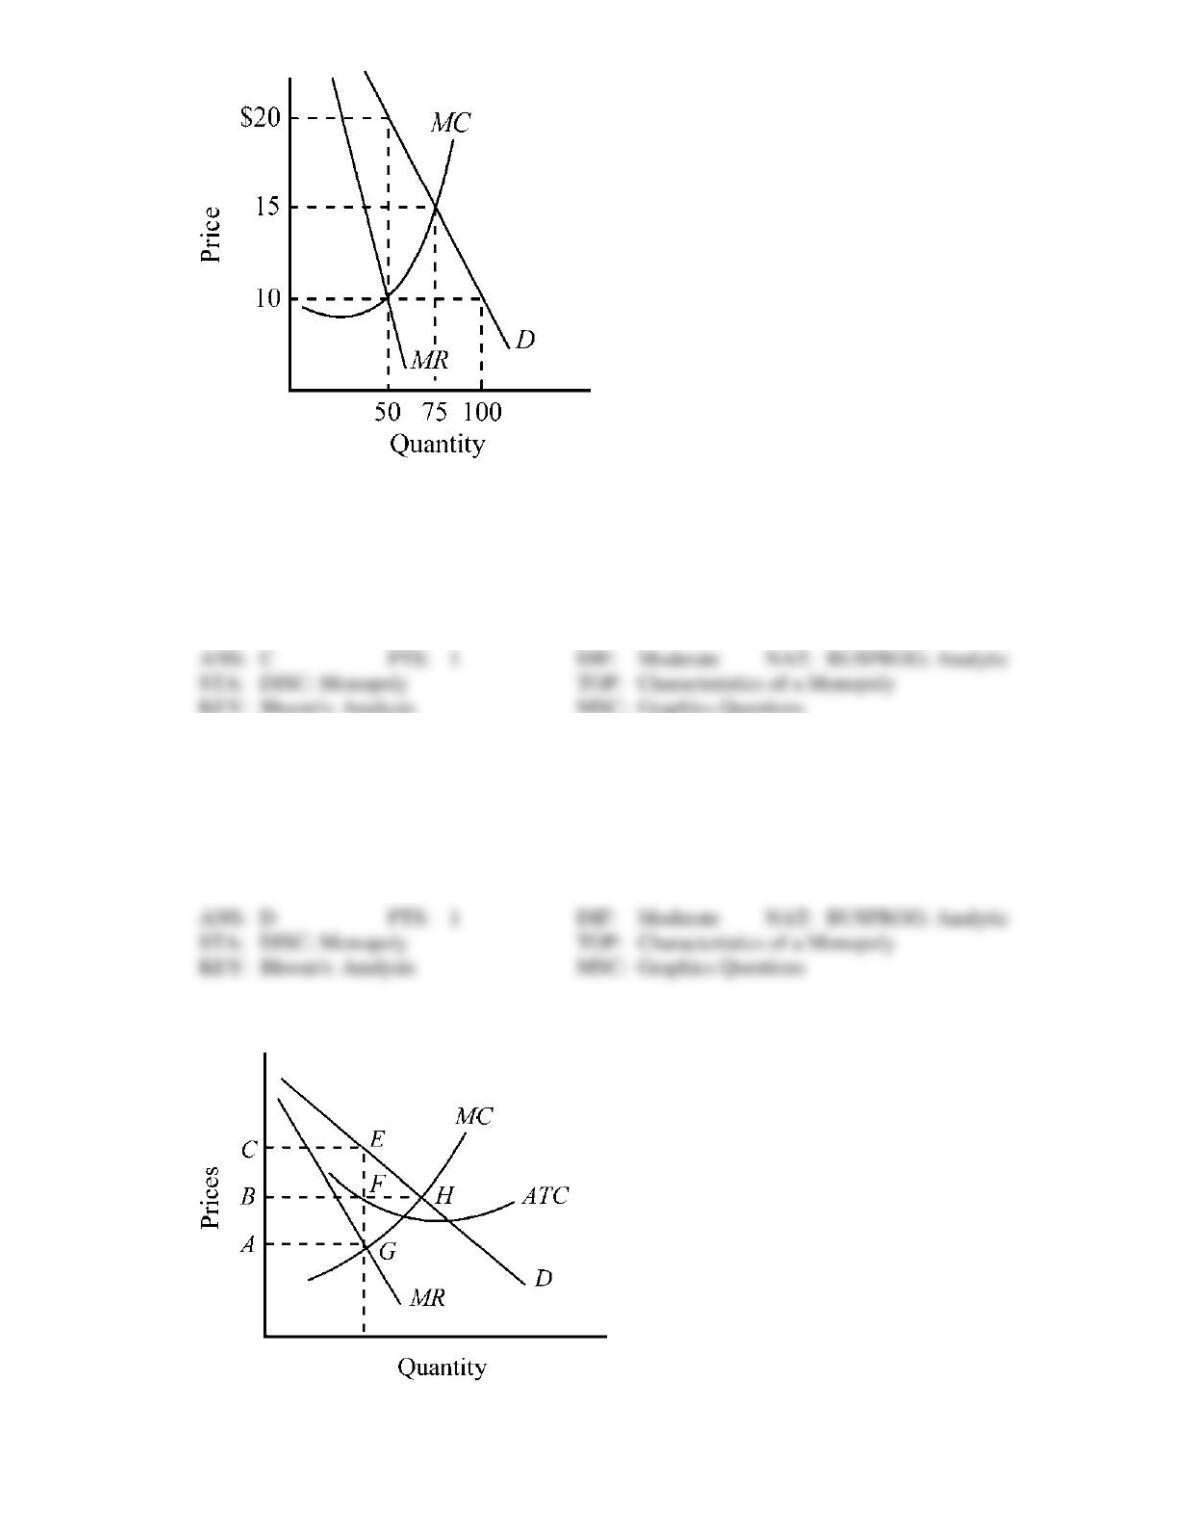
153. The demand and cost conditions in an industry are as depicted in Figure 11-8. In the viewpoint of
economic efficiency, what would the ideal price and output be?
a.
price, $10; quantity produced, 100
b.
price, $15; quantity produced, 50
c.
price, $15; quantity produced, 75
d.
price, $20; quantity produced, 50
154. If the output in the industry is produced by a monopolist, at what price will the good sell and what
quantity will be produced in Figure 11-8?
a.
price, $10; quantity produced, 100
b.
price, $15; quantity produced, 50
c.
price, $15; quantity produced, 75
d.
price, $20; quantity produced, 50
Figure 11-9
155. From Figure 11-9, indicate the maximum profit a pure monopolist with the cost and demand
conditions above would be able to achieve.
a.
BFEC
b.
AGEC
c.
BHEC
d.
EFH
Use the figure to answer the following question(s).
Figure 11-10
156. Given the cost and revenue curves illustrated in Figure 11-10, what price will a profit-maximizing
monopolist charge?
a.
P1
b.
P2
c.
P3
d.
P4
157. If the monopolist is regulated by the “marginal cost pricing” technique, what price in Figure 11-10 will
be charged?
a.
P1
b.
P2
c.
P3
d.
P4
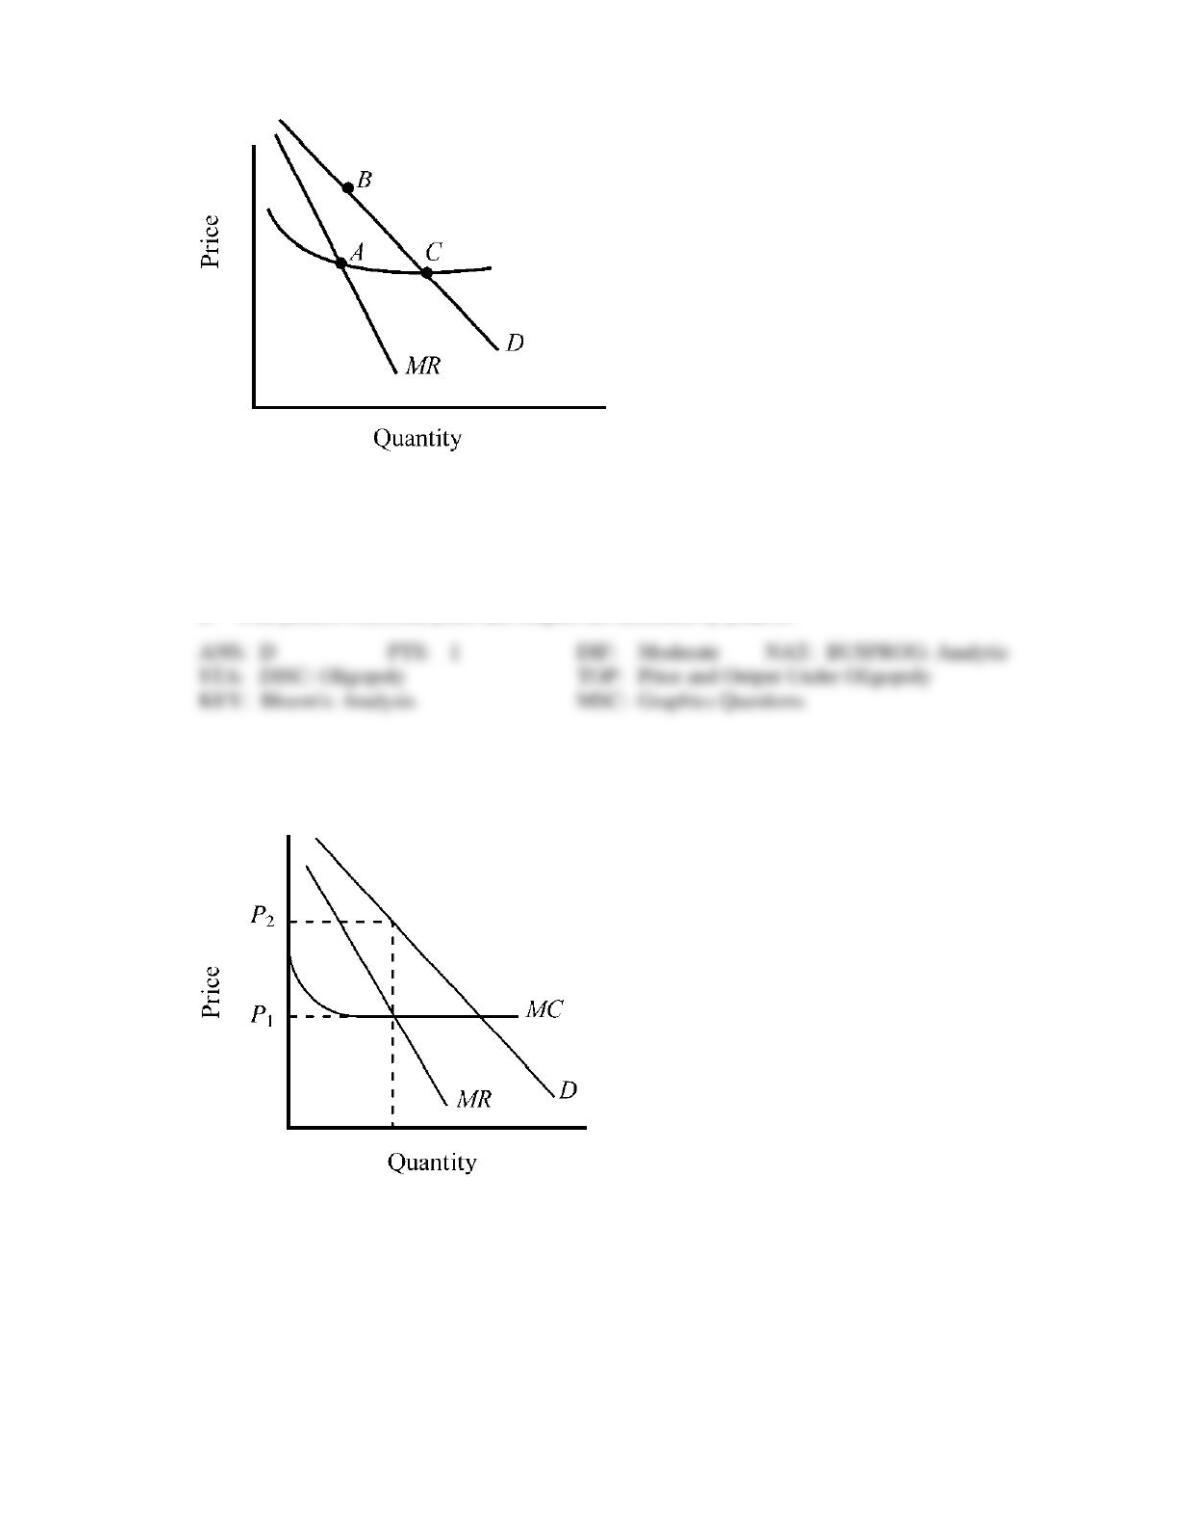
Figure 11-11
158. According to the graph of an oligopolistic industry in Figure 11-11 (points A and C lie on the MC
curve), which of the following statements is correct?
a.
With perfect collusion, price and outputs are indicated by point A.
b.
Without collusion, price and outputs are indicated by point B.
c.
With perfect collusion, price and outputs are indicated by point C.
d.
With perfect collusion, price and outputs are indicated by point B.
Use the figure to answer the following question(s).
Figure 11-12
159. Figure 11-12 indicates the industry cost and demand conditions for a product produced in an
oligopolistic industry. The price of this product is most likely to be
a.
greater than P2.
b.
P2.
c.
P1.
d.
in the range between P1 and P2.
160. If the firms in this oligopolistic industry depicted in Figure 11-12 can collude effectively and restrict
the entry of potential competitors, the price of their product will tend to be
a.
greater than P2.
b.
close to P2.
c.
approximately equal to P1.
d.
less than P1.
Use the figure to answer the following question(s).
Figure 11-13
161. If the firms in the industry depicted in Figure 11-13 compete with each other, what would the
industry’s price and output be?
a.
price, $10; output, 600
b.
price, $15; output, 500
c.
price, $20; output, 400
d.
price, $25; output, 300
162. If the firms in the industry depicted in Figure 11-13 can effectively operate as a cartel, what would the
industry’s price and output be?
a.
price, $10; output, 600
b.
price, $20; output, 400
c.
price, $25; output, 300
d.
price, $30; output, 200
163. Using Figure 11-13, determine the maximum joint monthly profit of the firms if they operate as a
cartel.
a.
zero
b.
$1,500
c.
$3,000
d.
$4,500
Use the figure to answer the following question(s).
Figure 11-14
164. What quantity would the industry depicted in Figure 11-14 produce if member firms were successfully
colluding?
a.
Q1
b.
Q2
c.
Q3
d.
Q4
165. Using Figure 11-14, determine what quantity these firms would produce, in the short run, if the firms
were engaging in vigorous competition.
a.
Q1
b.
Q2
c.
Q3
d.
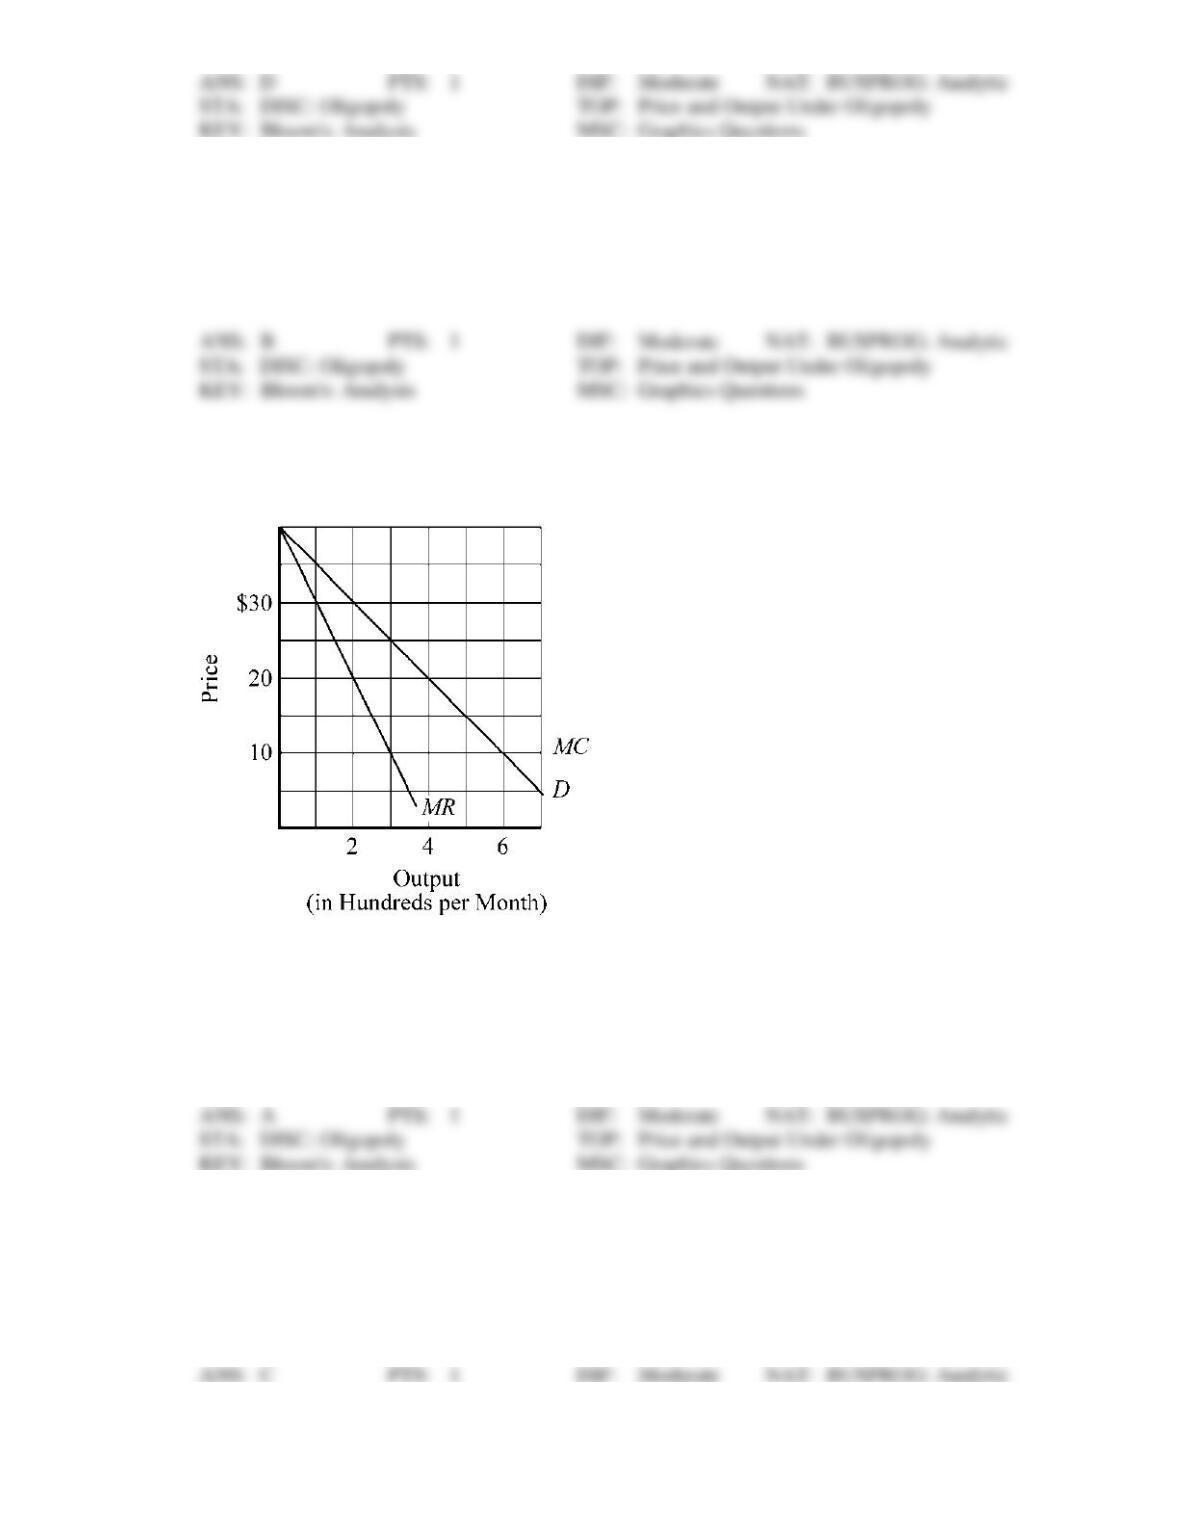
Q4
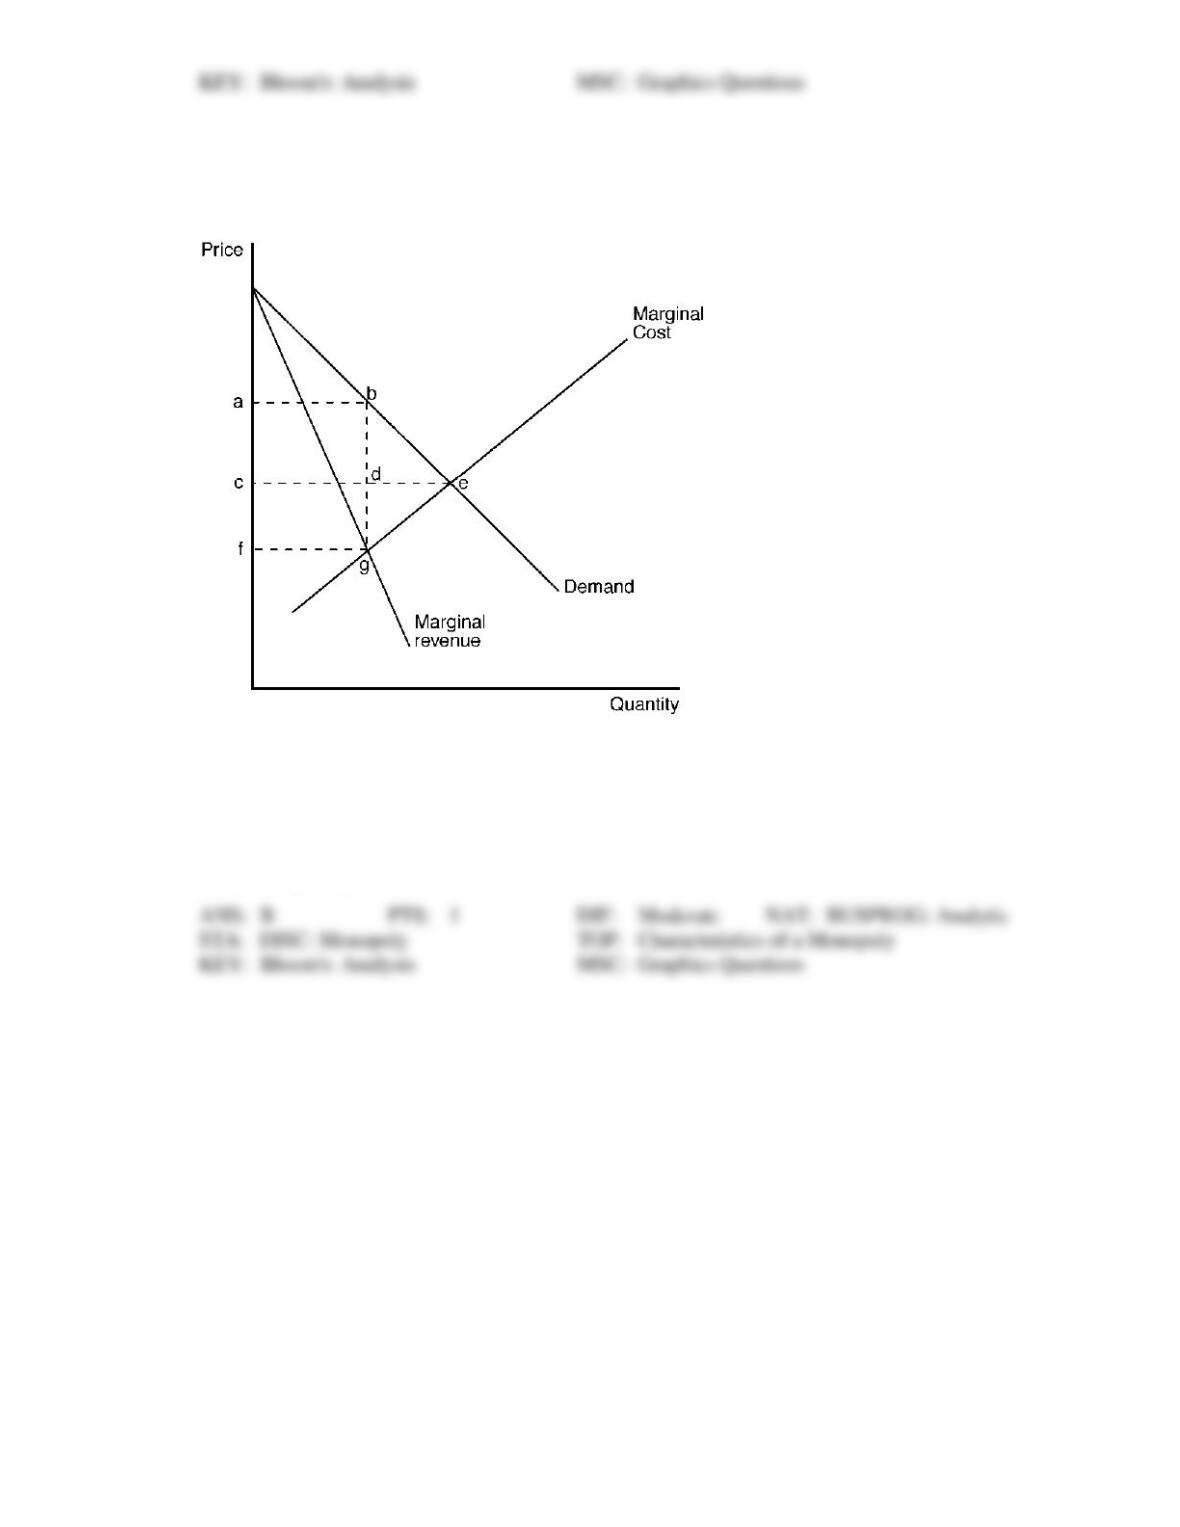
The figure below depicts the demand, marginal revenue and marginal cost curves of a
profit-maximizing monopolist.
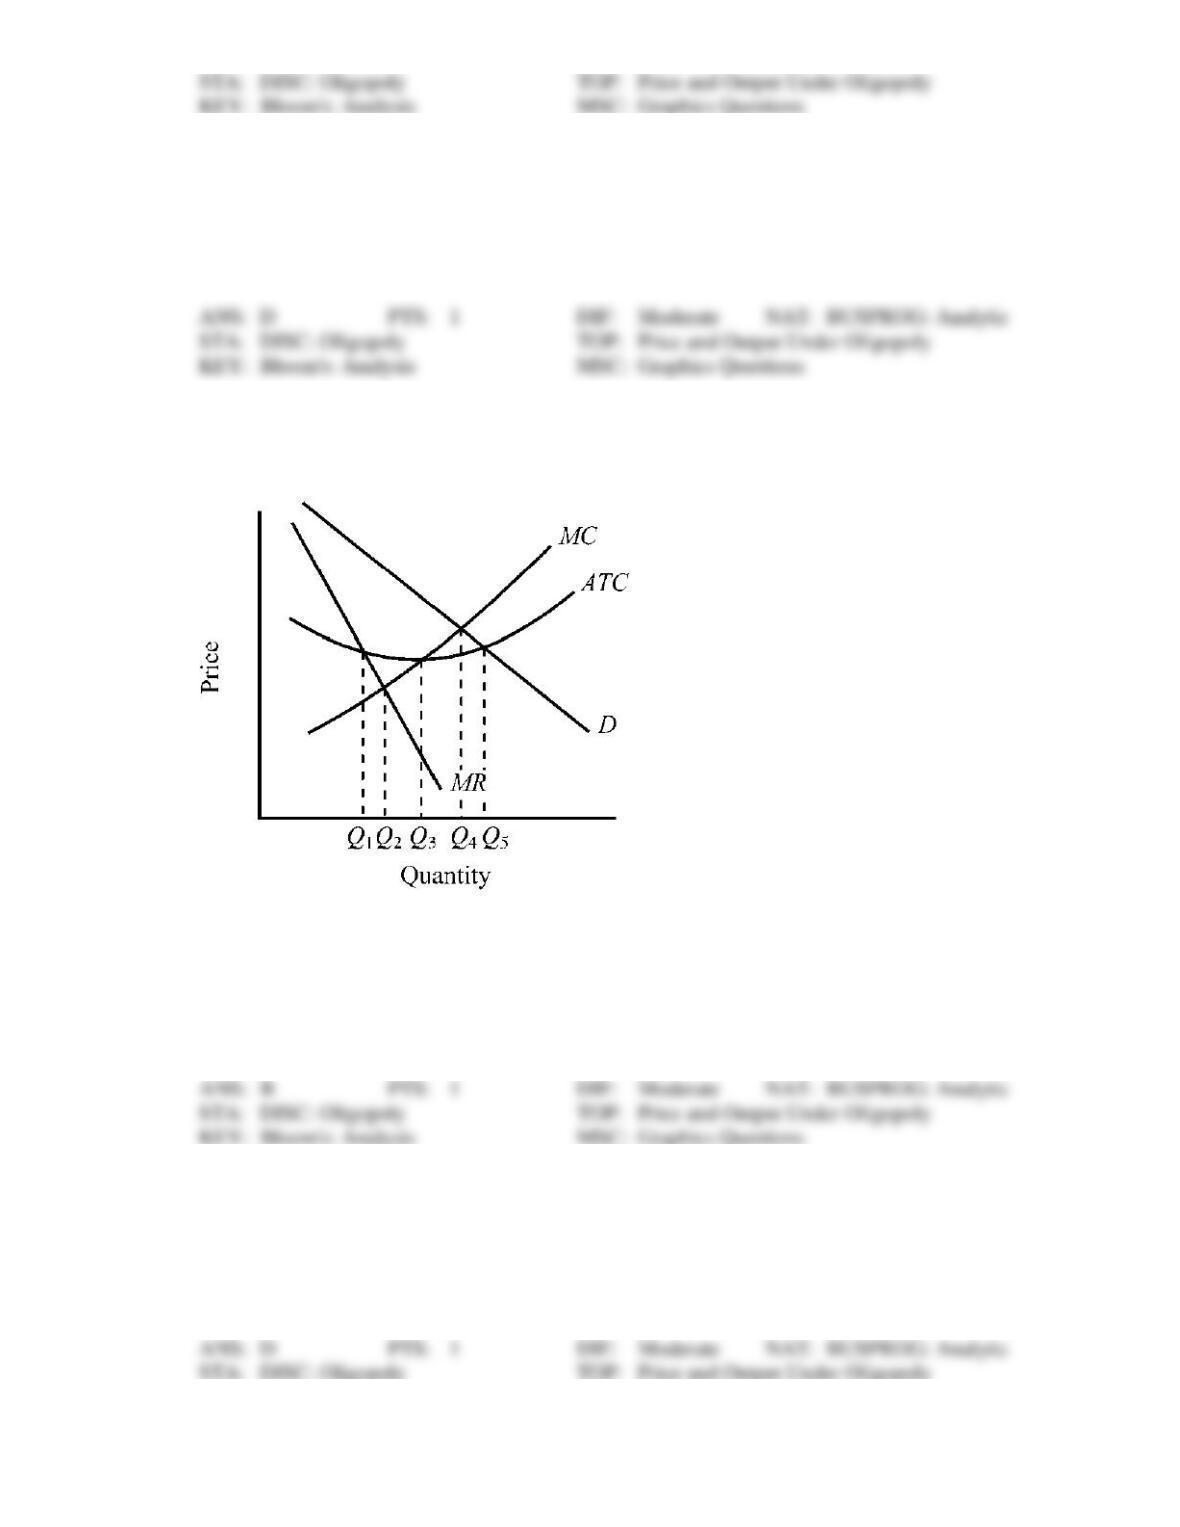
Figure 11-15
166. Refer to Figure 11-15. Which of the following areas represents the deadweight loss due to monopoly
pricing?
a.
Triangle bde
b.
Triangle bge
c.
Rectangle acdb
d.
Rectangle cfgd
Figure 11-16
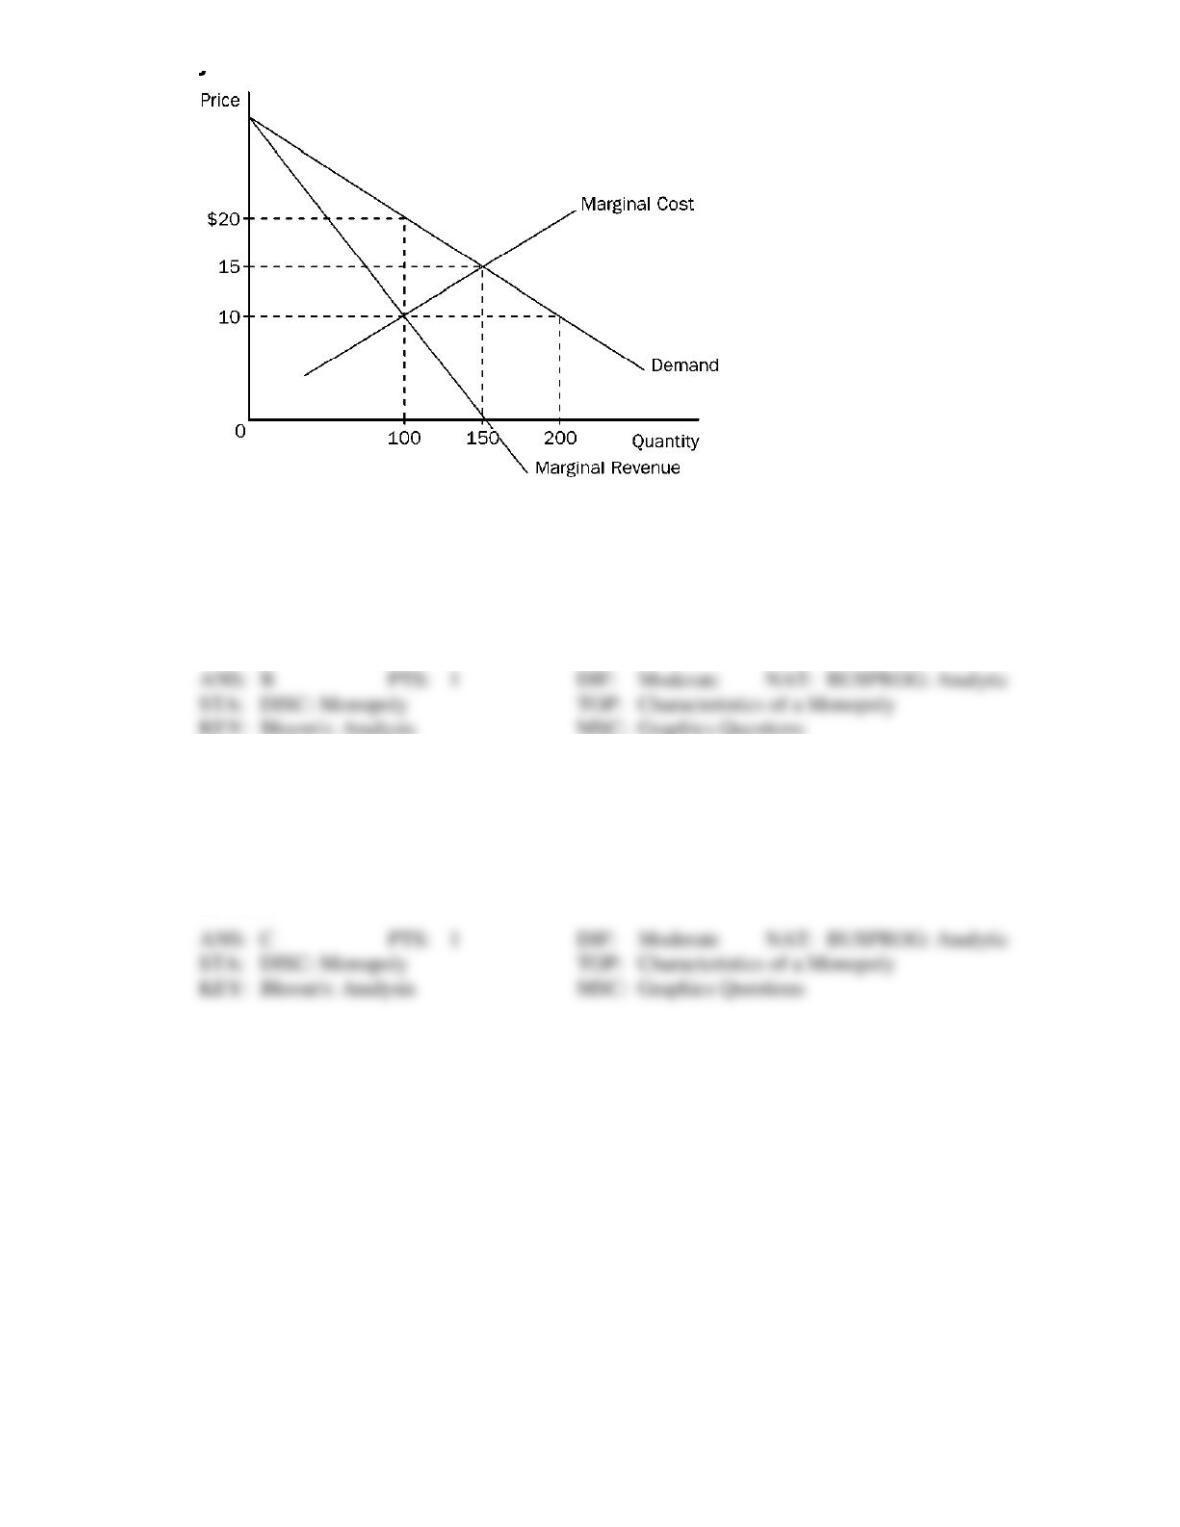
167. Refer to Figure 11-16. To maximize its profit, a monopolist would choose which of the following
outcomes?
a.
100 units of output and a price of $10 per unit
b.
100 units of output and a price of $20 per unit
c.
150 units of output and a price of $15 per unit
d.
200 units of output and a price of $20 per unit
168. Refer to Figure 11-16. The allocative inefficiency caused by a profit-maximizing monopoly amounts
to
a.
$150.
b.
$200.
c.
$250.
d.
$300.
The figure below illustrates the cost and revenue structure for a monopoly firm.
Figure 11-17
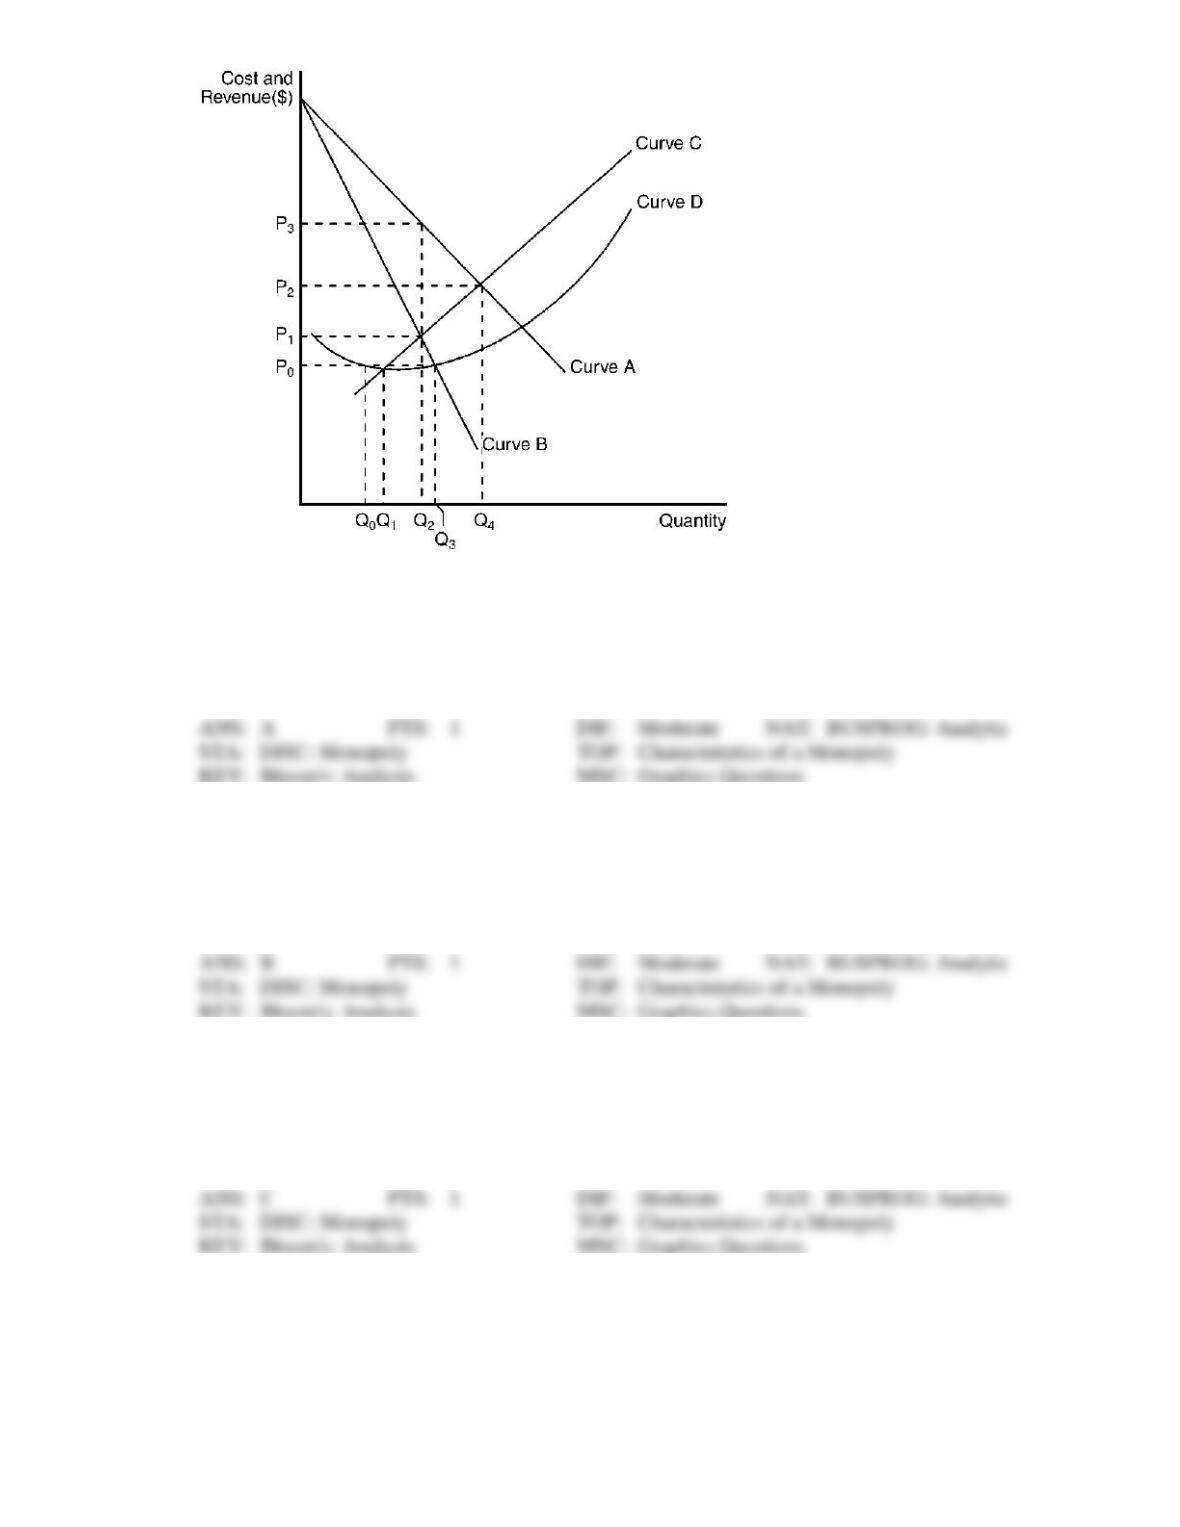
169. Refer to Figure 11-17. The demand curve for a monopoly firm is depicted by curve
a.
A.
b.
B.
c.
C.
d.
D.
170. Refer to Figure 11-17. The marginal revenue curve for a monopoly firm is depicted by curve
a.
A.
b.
B.
c.
C.
d.
D.
171. Refer to Figure 11-17. The marginal cost curve for a monopoly firm is depicted by curve
a.
A.
b.
B.
c.
C.
d.
D.
172. Refer to Figure 11-17. The average total cost curve for a monopoly firm is depicted by curve
a.
A.
b.
B.
c.
C.
d.
D.
173. Refer to Figure 11-17. If the monopoly firm is currently producing Q3 units of output, then a decrease
in output will necessarily cause profit to
a.
remain unchanged.
b.
decrease.
c.
increase as long as the new level of output is at least Q2.
d.
increase as long as the new level of output is at least Q1.
174. Refer to Figure 11-17. If the monopoly firm wants to maximize its profit, it should operate at a level of
output equal to
a.
Q1.
b.
Q2.
c.
Q3.
d.
Q4.
175. Refer to Figure 11-17. Profit will be maximized by charging a price equal to
a.
P0.
b.
P1.
c.
P2.
d.
P3.
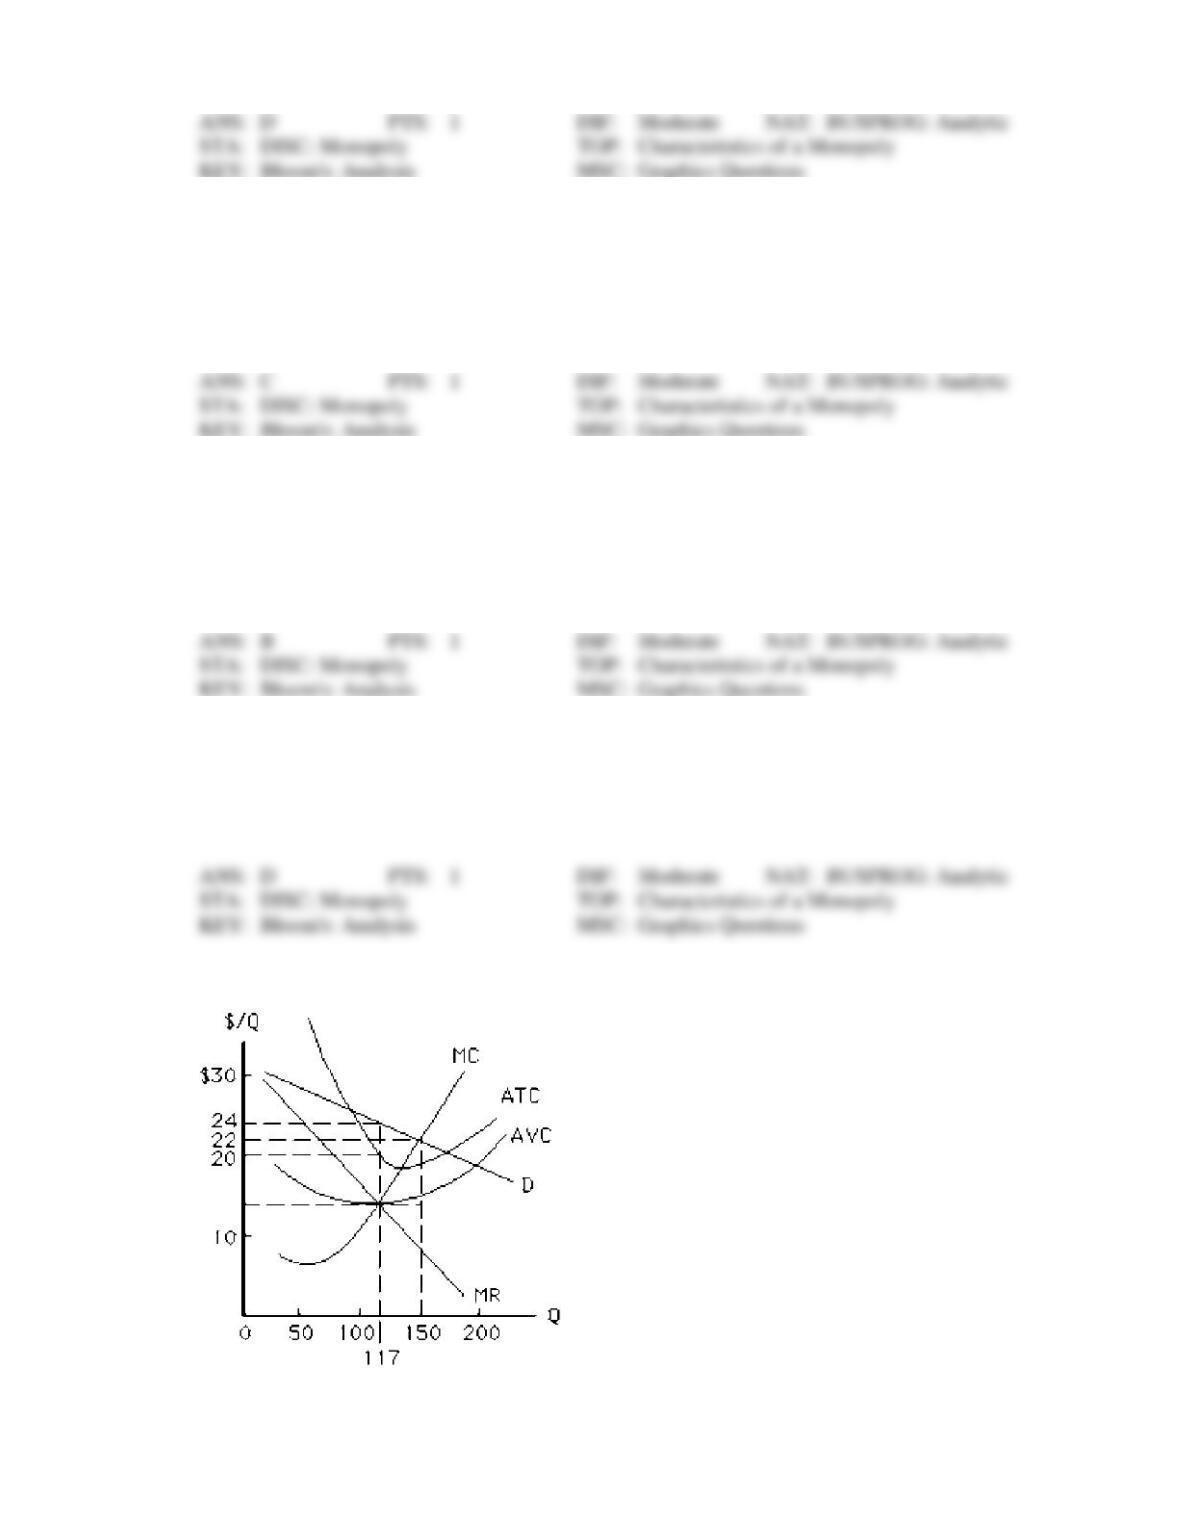
Figure 11-18
176. The profit-maximizing output and price for the firm in Figure 11-18, which charges the same price to
all customers, are
a.
117 and $14
b.
150 and $22
c.
150 and $14
d.
117 and $22
e.
117 and $24
177. The total revenue for the firm in Figure 11-18, a monopolist that maximizes profit while charging all
customers the same price, is
a.
$2,574
b.
$2,808
c.
$2,100
d.
$1,638
e.
$3,300
178. The total cost for the firm in Figure 11-18, a monopolist that maximizes profit while charging all
customers the same price, is
a.
$3,300
b.
$3,400
c.
$2,808
d.
$2,340
e.
$1,638
179. The firm in Figure 11-18, a monopolist that maximizes profit by charging all customers the same
price, is making a profit of
a.
$0
b.
$234
c.
$482
d.
$960
e.
$468
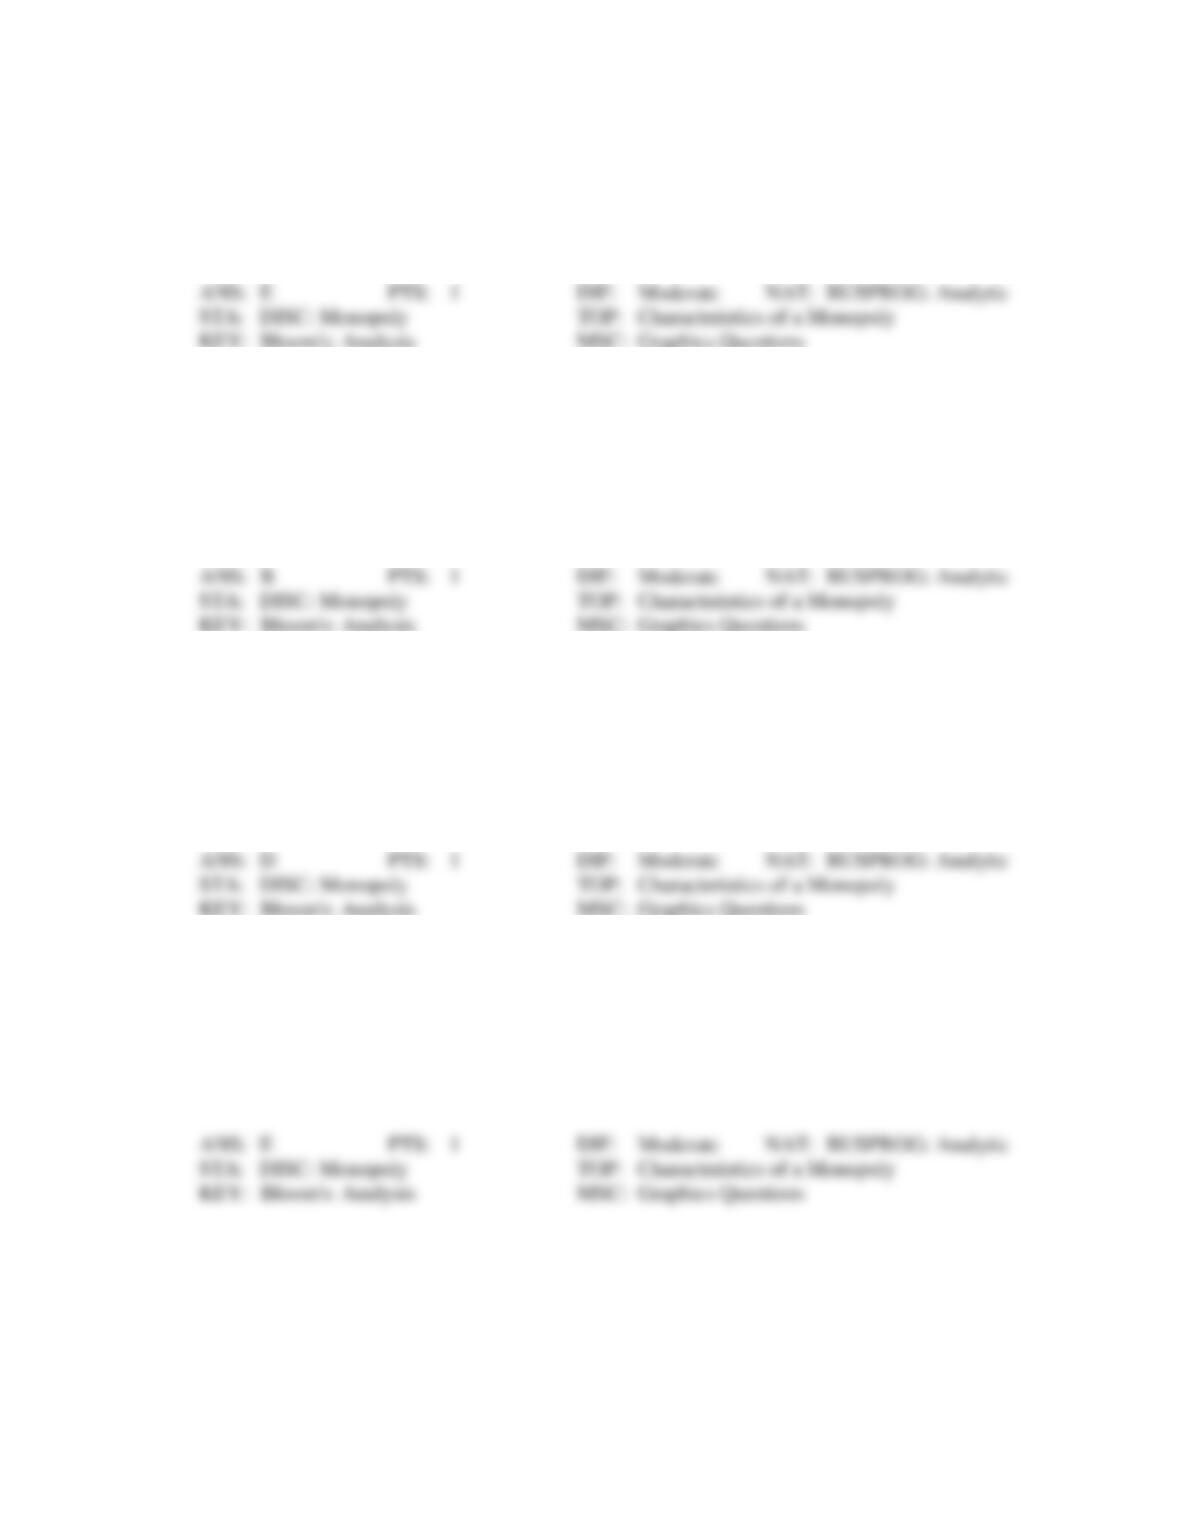
Figure 11-19
180. In the short run, the monopolist depicted in Figure 11-19 should
a.
shut down because P < AVC at some output levels.
b.
shut down because P < ATC at all output levels.
c.
continue producing because P > AVC at some output levels.
d.
continue producing because P > ATC at all output levels.
e.
continue producing because monopolists never shut down.
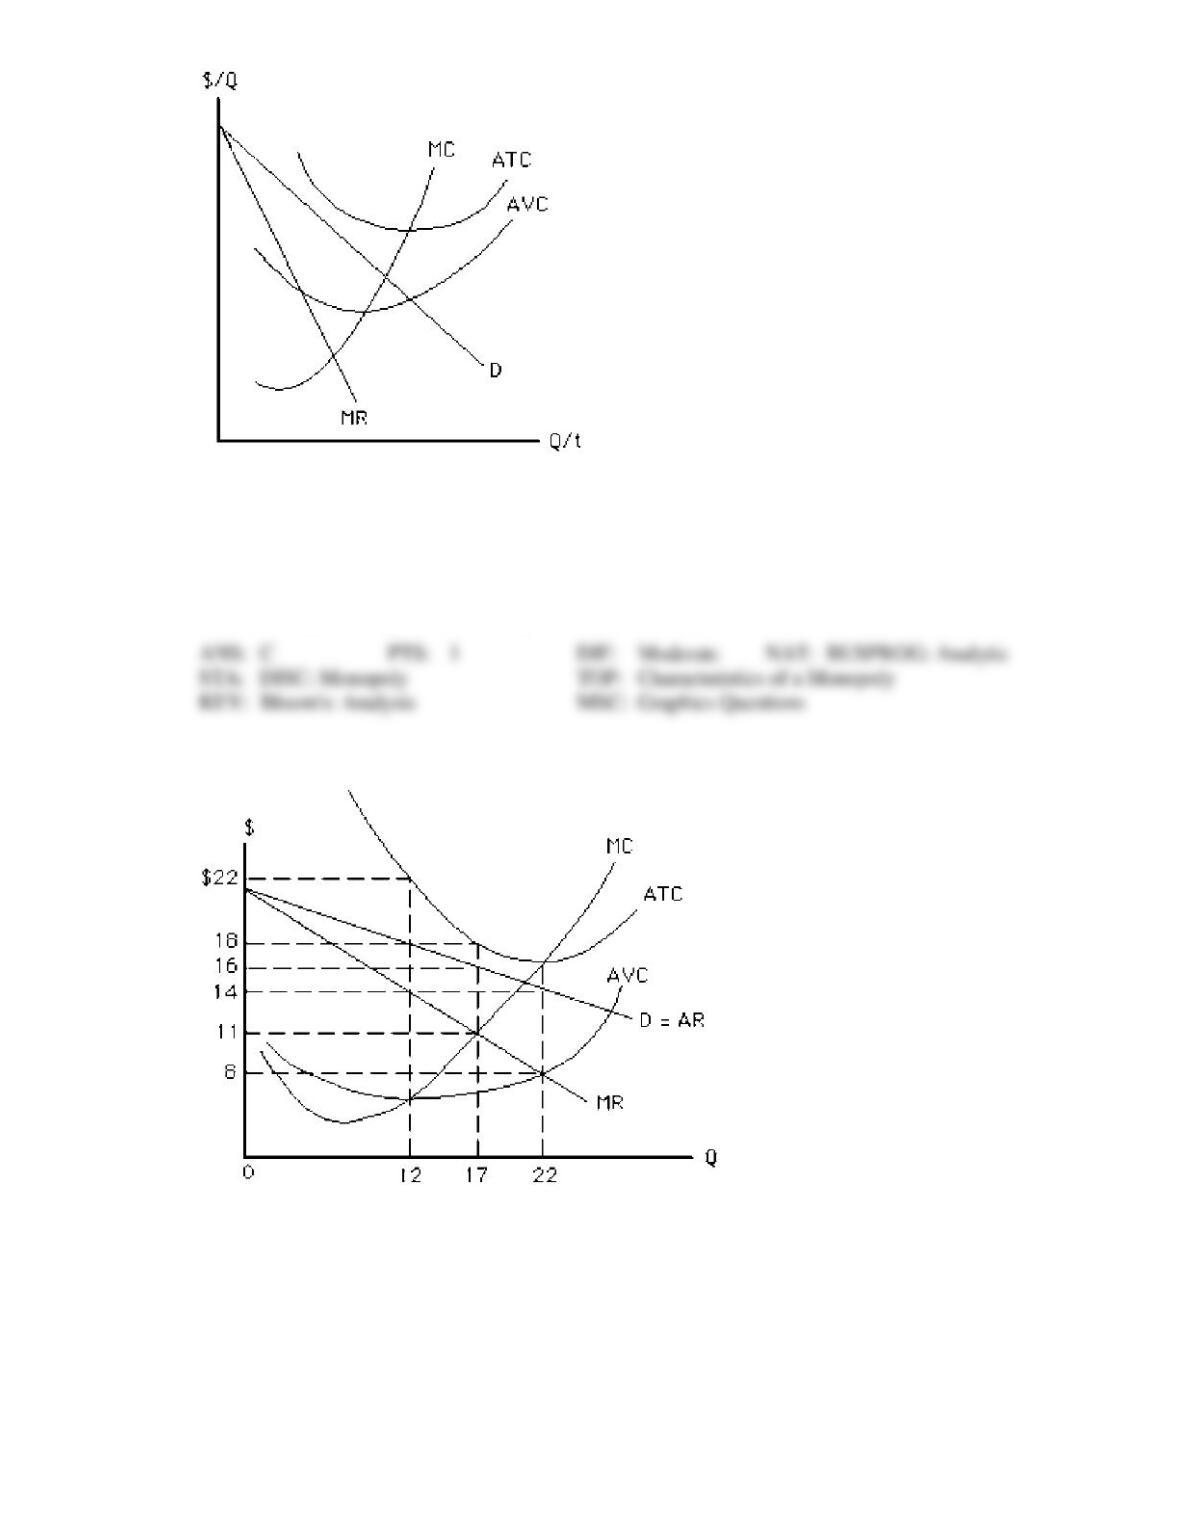
Figure 11-20
181. The production level that will maximize the profit for the monopoly in Figure 11-20 is
a.
0
b.
22
c.
17
d.
12
e.
more than 22
182. The profit-maximizing price the monopoly will charge in Figure 11-20 is
a.
irrelevant since the firm should shut down
b.
$11
c.
$16
d.
$18
e.
$22
183. The firm in Figure 11-20 will have an economic
a.
profit of $85
b.
loss of $48
c.
profit of $132
d.
loss of $96
e.
loss of $34
184. At the profit-maximizing level of production, the monopoly in Figure 11-20 will have total revenue of
a.
$308
b.
$187
c.
$216
d.
$306
e.
$272
185. At the profit-maximizing level of production, the monopoly in Figure 11-20 will have total cost of
a.
$264
b.
$306
c.
$216
d.
$187
e.
$176
186. At the profit-maximizing level of production, the monopoly in Figure 11-20 will have a
a.
profit per unit of output of $2.
b.
loss per unit of output of $2.
c.
loss per unit of output of $5.
d.
profit per unit of output of $5.
e.
loss per unit of output of $4.
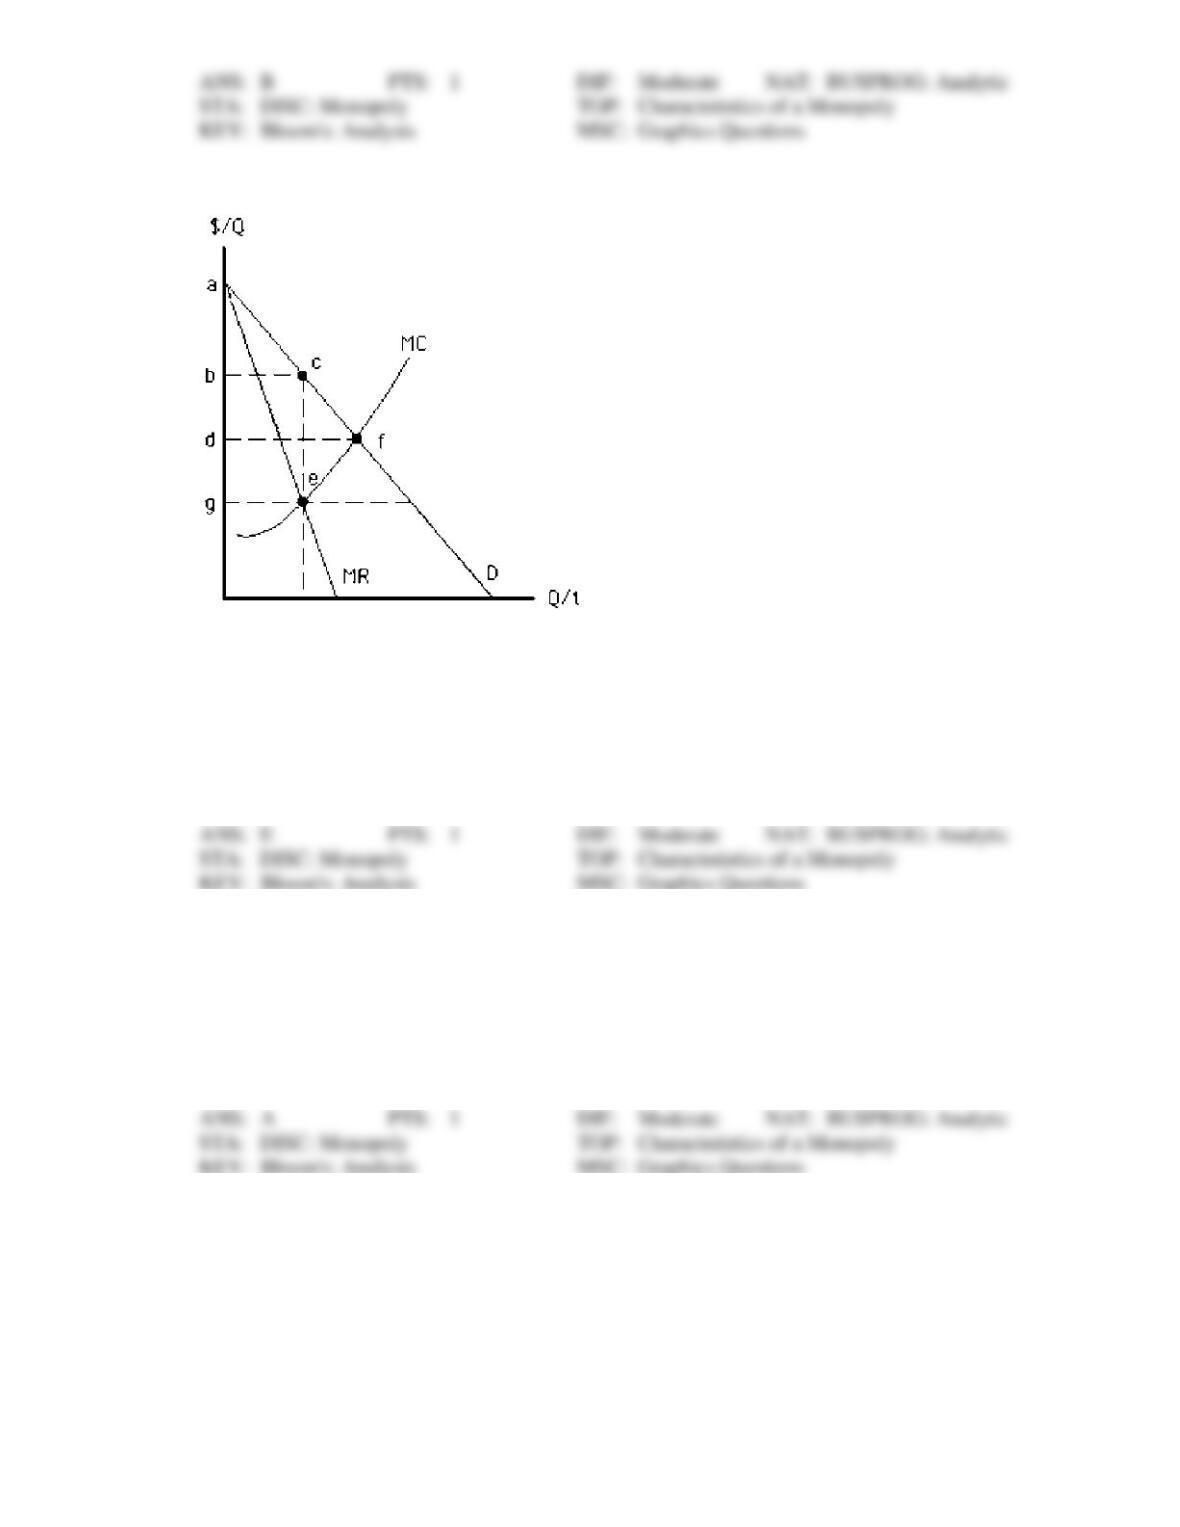
Figure 11-21
187. In Figure 11-21, the increase in consumer surplus that occurs when price is set equal to marginal cost
rather than at the profit-maximizing level, as it would be in an unregulated monopoly, is shown by area
a.
abc
b.
adf
c.
cef
d.
dfeg
e.
bcfd
188. The welfare loss associated with the unregulated natural monopoly in Figure 11-21 is shown by the
area
a.
cef
b.
abc
c.
adf
d.
dfeg
e.
bcfd