34.
According to liquidity preference theory, the money-supply curve is
a.
upward sloping.
b.
downward sloping.
c.
vertical.
d.
horizontal.
35.
According to liquidity preference theory, the money-supply curve would shift rightward
a.
if the money demand curve shifted right.
b.
if the Federal Reserve chose to increase the money supply.
c.
if the interest rate increased.
d.
All of the above are correct.
36.
According to liquidity preference theory, the money-supply curve would shift if the Fed
a.
engaged in open-market operations.
b.
increased money demand.
c.
increase the real income.
d.
did any of the above.
37.
In the graph of the money market, the money supply curve is
a.
vertical. It shifts rightward if the Fed buys bonds.
b.
vertical. It shifts rightward if the Fed sells bonds.
c.
upward sloping. It shifts rightward if the Fed buys bonds.
d.
upward sloping. It shifts rightward if the Fed sells bonds.
38.
Which of the following Fed actions would both decrease the money supply?
a.
buy bonds and raise the reserve requirement
b.
buy bonds and lower the reserve requirement
c.
sell bonds and raise the reserve requirement
d.
sell bonds and lower the reserve requirement
39.
When the Fed buys government bonds, the reserves of the banking system
a.
increase, so the money supply increases.
b.
increase, so the money supply decreases.
c.
decrease, so the money supply increases.
d.
decrease, so the money supply decreases.
40.
When the Fed sells government bonds, the reserves of the banking system
a.
increase, so the money supply increases.
b.
increase, so the money supply decreases.
c.
decrease, so the money supply increases.
d.
decrease, so the money supply decreases.
41.
Liquidity refers to
a.
the relation between the price and interest rate of an asset.
b.
the risk of an asset relative to its selling price.
c.
the ease with which an asset is converted into a medium of exchange.
d.
the sensitivity of investment spending to changes in the interest rate.

42.
Which among the following assets is the most liquid?
a.
capital goods
b.
stocks and bonds with a low risk
c.
real estate
d.
funds in a checking account
43.
Which among the following assets is the most liquid?
a.
corporate bonds
b.
fine art
c.
deposits that can be withdrawn using ATMs
d.
shares of stock
44.
People hold money primarily because it
a.
increases in value when there is inflation.
b.
serves as a store of value.
c.
serves as a medium of exchange.
d.
functions as a unit of account.
45.
According to liquidity preference theory, the opportunity cost of holding money is
a.
the interest rate on bonds.
b.
the inflation rate.
c.
the cost of converting bonds to a medium of exchange.
d.
the difference between the inflation rate and the interest rate on bonds.
46.
When the interest rate increases, the opportunity cost of holding money
a.
increases, so the quantity of money demanded increases.
b.
increases, so the quantity of money demanded decreases.
c.
decreases, so the quantity of money demanded increases.
d.
decreases, so the quantity of money demanded decreases.
47.
When the interest rate decreases, the opportunity cost of holding money
a.
increases, so the quantity of money demanded increases.
b.
increases, so the quantity of money demanded decreases.
c.
decreases, so the quantity of money demanded increases.
d.
decreases, so the quantity of money demanded decreases.
48.
The opportunity cost of holding money
a.
decreases when the interest rate decreases, so people desire to hold more of it.
b.
decreases when the interest rate decreases, so people desire to hold less of it.
c.
increases when the interest rate decreases, so people desire to hold more of it.
d.
increases when the interest rate decreases, so people desire to hold less of it.
49.
In which of the following cases would the quantity of money demanded be smallest?
a. r = 0.06, P = 1.2
b.
r = 0.05, P = 1.0
c.
r = 0.04, P = 1.2
d. r = 0.06, P = 1.0
50.
In which of the following cases would the quantity of money demanded be largest?
a. r = 0.03, P = 1.2
b.
r = 0.03, P = 1.3
c.
r = 0.04, P = 1.2
d. r = 0.05, P = 0.9
51.
People are likely to want to hold more money if the interest rate
a.
increases, making the opportunity cost of holding money rise.
b.
increases, making the opportunity cost of holding money fall.
c.
decreases, making the opportunity cost of holding money rise.
d.
decreases, making the opportunity cost of holding money fall.
52.
According to liquidity preference theory, a decrease in money demand for some reason other than
a change in the
price level causes
a.
the interest rate to fall, so aggregate demand shifts right.
b.
the interest rate to fall, so aggregate demand shifts left.
c.
the interest rate to rise, so aggregate demand shifts right.
d.
the interest rate to rise, so aggregate demand shifts left.
53.
If people decide to hold less money, then
a.
money demand decreases, there is an excess supply of money, and interest rates rise.
b.
money demand decreases, there is an excess supply of money, and interest rates fall.
c.
money demand increases, there is an excess demand for money, and interest rates fall.
d.
money demand increases, there is an excess demand for money, and interest rates rise.
54.
When households decide to hold more money,
a.
interest rates fall and investment decreases.
b.
interest rates fall and investment increases.
c.
interest rates rise and investment increases.
d.
interest rates rise and investment decreases.
55.
According to liquidity preference theory, the slope of the money demand curve is explained as
follows:
a.
Interest rates rise as the Fed reduces the quantity of money demanded.
b.
Interest rates fall as the Fed reduces the supply of money.
c.
People will want to hold less money as the cost of holding it falls.
d.
People will want to hold more money as the cost of holding it falls.
56.
According to liquidity preference theory,
a.
an increase in the interest rate reduces the quantity of money demanded. This is shown as a
movement along
the money-demand curve. An increase in the price level shifts money demand
to the right.
b.
an increase in the interest rate increases the quantity of money demanded. This is shown as a
movement
along the money-demand curve. An increase in the price level shifts money demand
leftward.
c.
an increase in the price level reduces the quantity of money demanded. This is shown as a
movement along
the money-demand curve. An increase in the interest rate shifts money
demand rightward.
d.
an increase in the price level increases the quantity of money demanded. This is shown as a
movement along
the money-demand curve. An increase in the interest rate shifts money
demand leftward.
57.
According to the theory of liquidity preference, which variable adjusts to balance the supply and
demand for
money?
a.
interest rate
b.
money supply
c.
quantity of output
d.
price level
The Influence of Monetary and Fiscal Policy on Aggregate Demand 8255
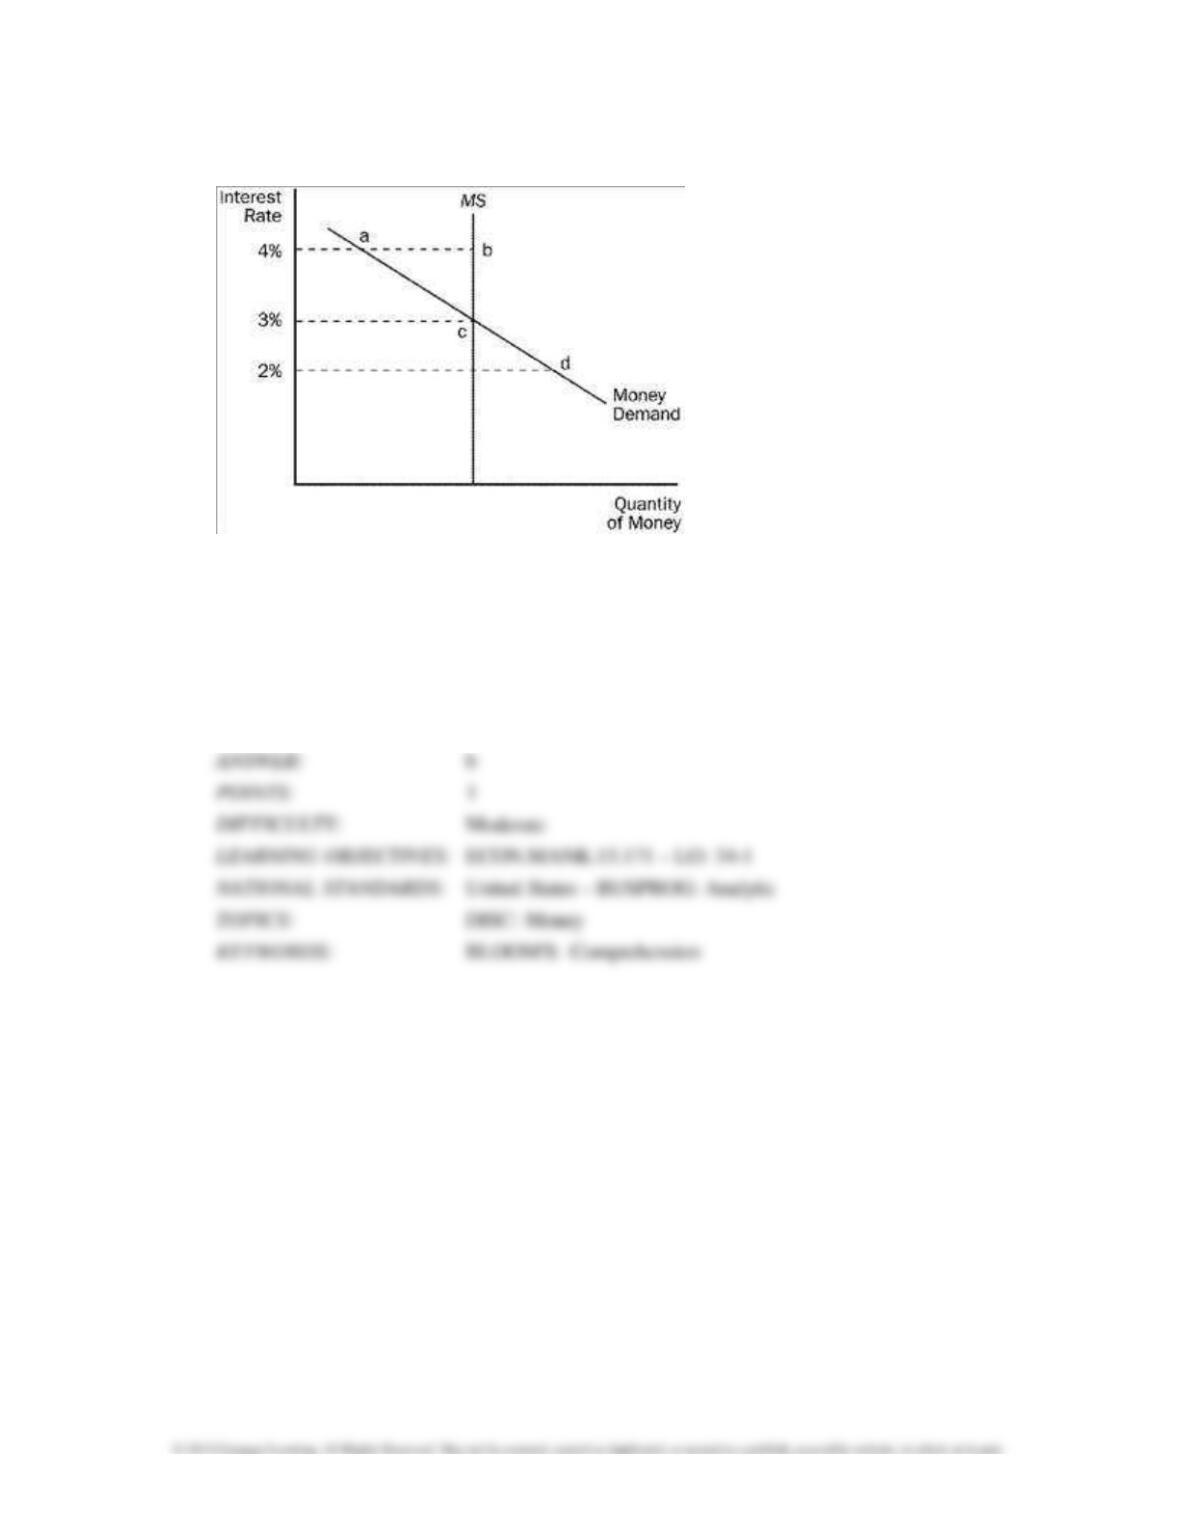
Figure 34-1
58.
Refer to Figure 34-1. If the current interest rate is 2 percent,
a.
there is an excess supply of money.
b.
people will sell more bonds, which drives interest rates up.
c.
as the money market moves to equilibrium, people will buy more goods.
d.
All of the above are correct.

59.
Refer to Figure 34-1. There is an excess demand for money at an interest rate of
a.
2 percent.
b.
3 percent.
c.
4 percent.
d.
None of the above is correct.
60.
Refer to Figure 34-1. At an interest rate of 4 percent, there is an excess
a.
demand for money equal to the distance between points a and b.
b.
demand for money equal to the distance between points b and c.
c.
supply of money equal to the distance between points a and b.
d.
supply of money equal to the distance between points b and c.
61.
Refer to Figure 34-1. Which of the following is correct?
a.
If the interest rate is 4 percent, there is excess money demand, and the interest rate will fall.
b.
If the interest rate is 3 percent, there is excess money supply, and the interest rate will rise.
c.
Starting with an interest rate of 4 percent, the demand for goods and services will increase until
the money
market reaches a new equilibrium.
d.
None of the above is correct.
8258 The Influence of Monetary and Fiscal Policy on Aggregate Demand
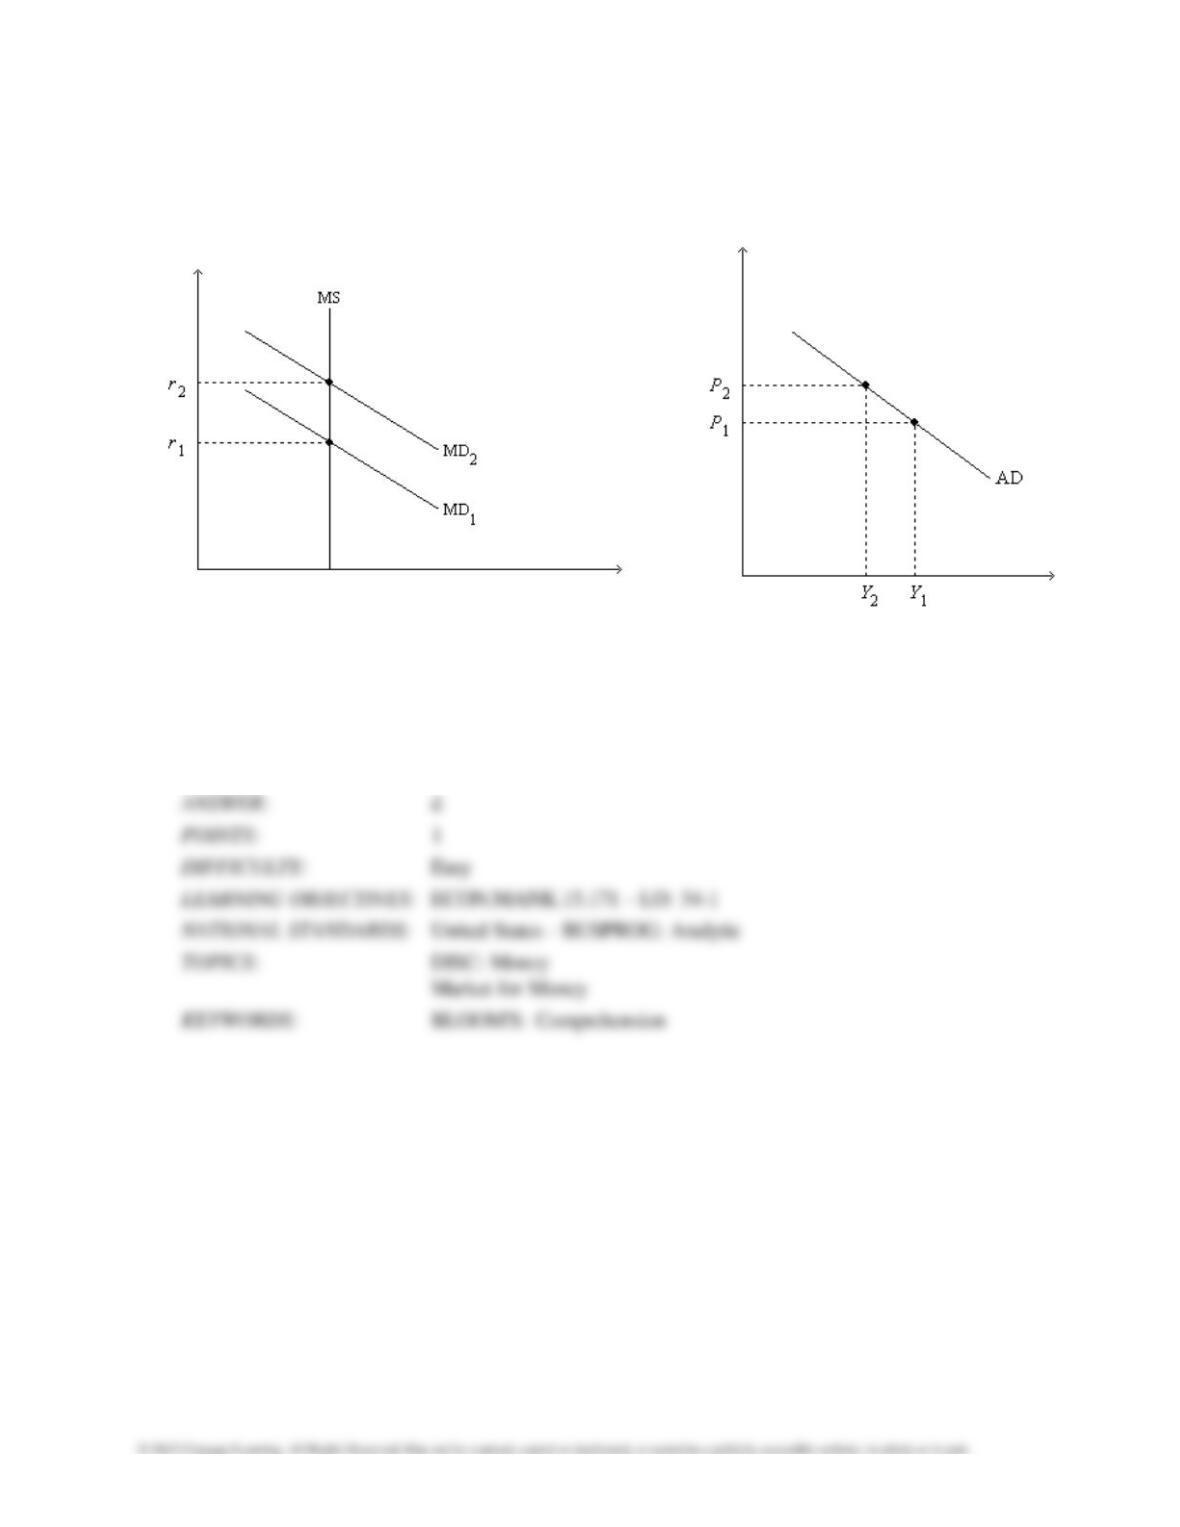
Figure 34-2. On the left-hand graph, MS represents the supply of money and MD represents the
demand for
money; on the right-hand graph, AD represents aggregate demand. The usual
quantities are measured along the
axes of both graphs.
62.
Refer to Figure 34-2. What is measured along the horizontal axis of the left-hand graph?
a.
nominal output
b.
real output
c.
the opportunity cost of holding money
d.
the quantity of money
63.
Refer to Figure 34-2. What does Y represent on the horizontal axis of the right-hand graph?
a.
the quantity of money
b.
the rate of inflation
c.
real output
d.
nominal output
64.
Refer to Figure 34–2. Which of the following quantities is held constant as we move from one
point to another on either graph?
a.
the nominal interest rate
b.
the quantity of money demanded
c.
investment
d.
the expected rate of inflation
65.
Refer to Figure 34-2. If the graphs apply to an economy such as the U.S. economy, then the
slope of the AD
curve is primarily attributable to the
a.
wealth effect.
b.
interest-rate effect.
c.
exchange-rate effect.
d.
Fisher effect.
66.
Refer to Figure 34-2. A decrease in Y from Y1 to Y2 is explained as follows:
a.
The Federal Reserve increases the money supply, causing the money-demand curve to shift
from MD1 to
MD2; this shift of MD causes r to increase from r1 to r2; and this increase in r
causes Y to decrease from
Y1 to Y2.
b.
An increase in P from P1 to P2 causes the money-demand curve to shift from MD1 to MD2;
this shift of
MD causes r to increase from r1 to r2; and this increase in r causes Y to decrease
from Y1 to Y2.
c.
A decrease in P from P2 to P1 causes the money-demand curve to shift from MD1 to MD2;
this shift of MD
causes r to increase from r1 to r2; and this increase in r causes Y to decrease
from Y1 to Y2.
d.
An increase in the price level causes the money-demand curve to shift from MD2 to MD1;
this shift of MD
causes r to decrease from r2 to r1; and this decrease in r causes Y to
decrease from Y1 to Y2.
67.
Refer to Figure 34-2. As we move from one point to another along the money-demand curve
MD1,
a.
the price level is held fixed at P1.
b.
the interest rate is held fixed at r1.
c.
the money supply is changing so as to keep the money market in equilibrium.
d.
the expected inflation rate is changing so as to keep the real interest rate constant.
68.
Refer to Figure 34–2. If the money-supply curve MS on the left-hand graph were to shift to the
left, this would
a.
represent an action taken by the Federal Reserve.
b.
shift the AD curve to the left.
c.
create, until the interest rate adjusted, an excess demand for money at the interest rate that
equilibrated the
money market before the shift.
d.
All of the above are correct.
69.
Refer to Figure 34-2. Assume the money market is always in equilibrium. Under the
assumptions of the model,
a.
the real interest rate is lower at Y2 than it is at Y1.
b.
the quantity of money is the same at Y1 as it is at Y2.
c.
the price level is lower at r2 than it is at r1.
d.
All of the above are correct.
70.
Refer to Figure 34-2. Assume the money market is always in equilibrium. Under the
assumptions of the model,
a.
the quantity of goods and services demanded is higher at P2 than it is at P1.
b.
the quantity of money is higher at Y1 than it is at Y2.
c.
an increase in r from r1 to r2 is associated with a decrease in Y from Y1 to Y2.
d.
All of the above are correct.