194.
The Fed can influence the money supply by
a.
changing how much it lends to banks.
b.
changing the interest rate it pays banks on the reserves they are holding.
c.
using open–market operations.
d.
All of the above are correct.
195.
Which of the following sequences best explains the negative slope of the aggregate-demand
curve?
a.
price level ↑ ⇒ demand for money ↑ ⇒ equilibrium interest rate ↑ ⇒ quantity of goods and
services
demanded ↓
b.
price level ↑ ⇒ demand for money ↓ ⇒ equilibrium interest rate ↑ ⇒ quantity of goods and
services
demanded ↓
c.
price level ↓ ⇒ demand for money ↓ ⇒ equilibrium interest rate ↑ ⇒ quantity of goods and
services
demanded ↓
d.
price level ↑ ⇒ equilibrium interest rate ↑ ⇒ demand for money ↑ ⇒ quantity of goods and
services
demanded ↓
196.
Which of the following sequences best explains the negative slope of the aggregate-demand
curve?
a.
price level ↑ ⇒ demand for money ↓ ⇒ equilibrium interest rate ↑ ⇒ quantity of goods and
services
demanded ↓
b.
price level ↑ ⇒ demand for money ↑ ⇒ equilibrium interest rate ↓ ⇒ quantity of goods and
services
demanded ↓
c.
price level ↓ ⇒ demand for money ↓ ⇒ equilibrium interest rate ↓ ⇒ quantity of goods and
services
demanded ↑
d.
price level ↓ ⇒ equilibrium interest rate ↓ ⇒ demand for money ↑ ⇒ quantity of goods and
services
demanded ↑
197.
Consider the following sequence of events:
price level ↑ ⇒ demand for money ↑ ⇒ equilibrium interest rate ↑
⇒ quantity of goods and services demanded ↓
Τhis sequence explains why the
a.
money-supply curve is vertical.
b.
aggregate-demand curve shifts leftward in response to a monetary injection.
c.
aggregate-demand curve shifts rightward in response to a monetary injection.
d.
aggregate-demand curve slopes downward.
198.
A situation in which the Fed’s target interest rate has fallen as far as it can fall is sometimes
described as a
a.
liquidity preference.
b.
liquidity trap.
c.
open-market trap.
d.
interest-rate contraction.
199.
Economists who are skeptical about the relevance of “liquidity traps” argue that
a.
a central bank continues to have tools to stimulate the economy, even after its interest rate
target hits its
lower bound of zero.
b.
a central bank continues to have the option of committing itself to future monetary
contraction, even after its
interest rate target hits its lower bound of zero.
c.
a central bank can greatly reduce the likelihood of a liquidity trap by setting the target rate of
inflation at
zero.
d.
while the concept of a liquidity trap is theoretically possible, nothing resembling a liquidity trap
ever has been
observed in the real world.
200.
If the inflation rate is zero, then
a.
both the nominal interest rate and the real interest rate can fall below zero.
b.
the nominal interest rate can fall below zero, but the real interest rate cannot fall below zero.
c.
the real interest rate can fall below zero, but the nominal interest rate cannot fall below zero.
d.
neither the nominal interest rate nor the real interest rate can fall below zero.
201.
During the economic downturn of 2008–2009, the Federal Reserve
a.
used open-market operations to purchase mortgages and corporate debt, just as it frequently
does even when
the economy is functioning normally.
b.
took the unusual step of using open-market operations to purchase mortgages and corporate
debt.
c.
explicitly set its target rate of inflation at zero.
d.
explicitly set its target rate of inflation well above zero.
202.
Paul Samuelson, a famous economist, said that
a.
“the bond market has predicted zero out of the past nine recessions.”
b.
“the stock market has predicted zero out of the past nine recessions.”
c.
“the bond market has predicted nine out of the past five recessions.”
d.
“the stock market has predicted nine out of the past five recessions.”
Multiple Choice – Section 02: How Fiscal Policy Influences Aggregate Demand
1.
In the long run, fiscal policy influences
a.
saving, investment, and growth; in the short run, fiscal policy primarily influences technology and
the
production function.
b.
saving, investment, and growth; in the short run, fiscal policy primarily influences the aggregate
demand for
goods and services.
c.
technology and the production function; in the short run, fiscal policy primarily influences saving,
investment,
and growth.
d.
the aggregate demand for goods and services; in the short run, fiscal policy primarily influences
technology
and the production function.
2.
In the long run, fiscal policy primarily affects
a.
aggregate demand. In the short run, it affects primarily aggregate supply.
b.
aggregate supply. In the short run, it affects primarily saving, investment, and growth.
c.
saving, investment, and growth. In the short run, it affects primarily aggregate demand.
d.
saving, investment, and growth. In the short run, it affects primarily aggregate supply.
3.
Fiscal policy refers to the idea that aggregate demand is affected by changes in
a.
the money supply.
b.
government spending and taxes.
c.
trade policy.
d.
All of the above are correct.
4.
Which of the following is an example of an increase in government purchases?
a.
The government builds new roads.
b.
The Federal Reserve purchases government bonds.
c.
The government decreases personal income taxes.
d.
The government increases unemployment insurance benefit payments.
The Influence of Monetary and Fiscal Policy on Aggregate Demand 8329
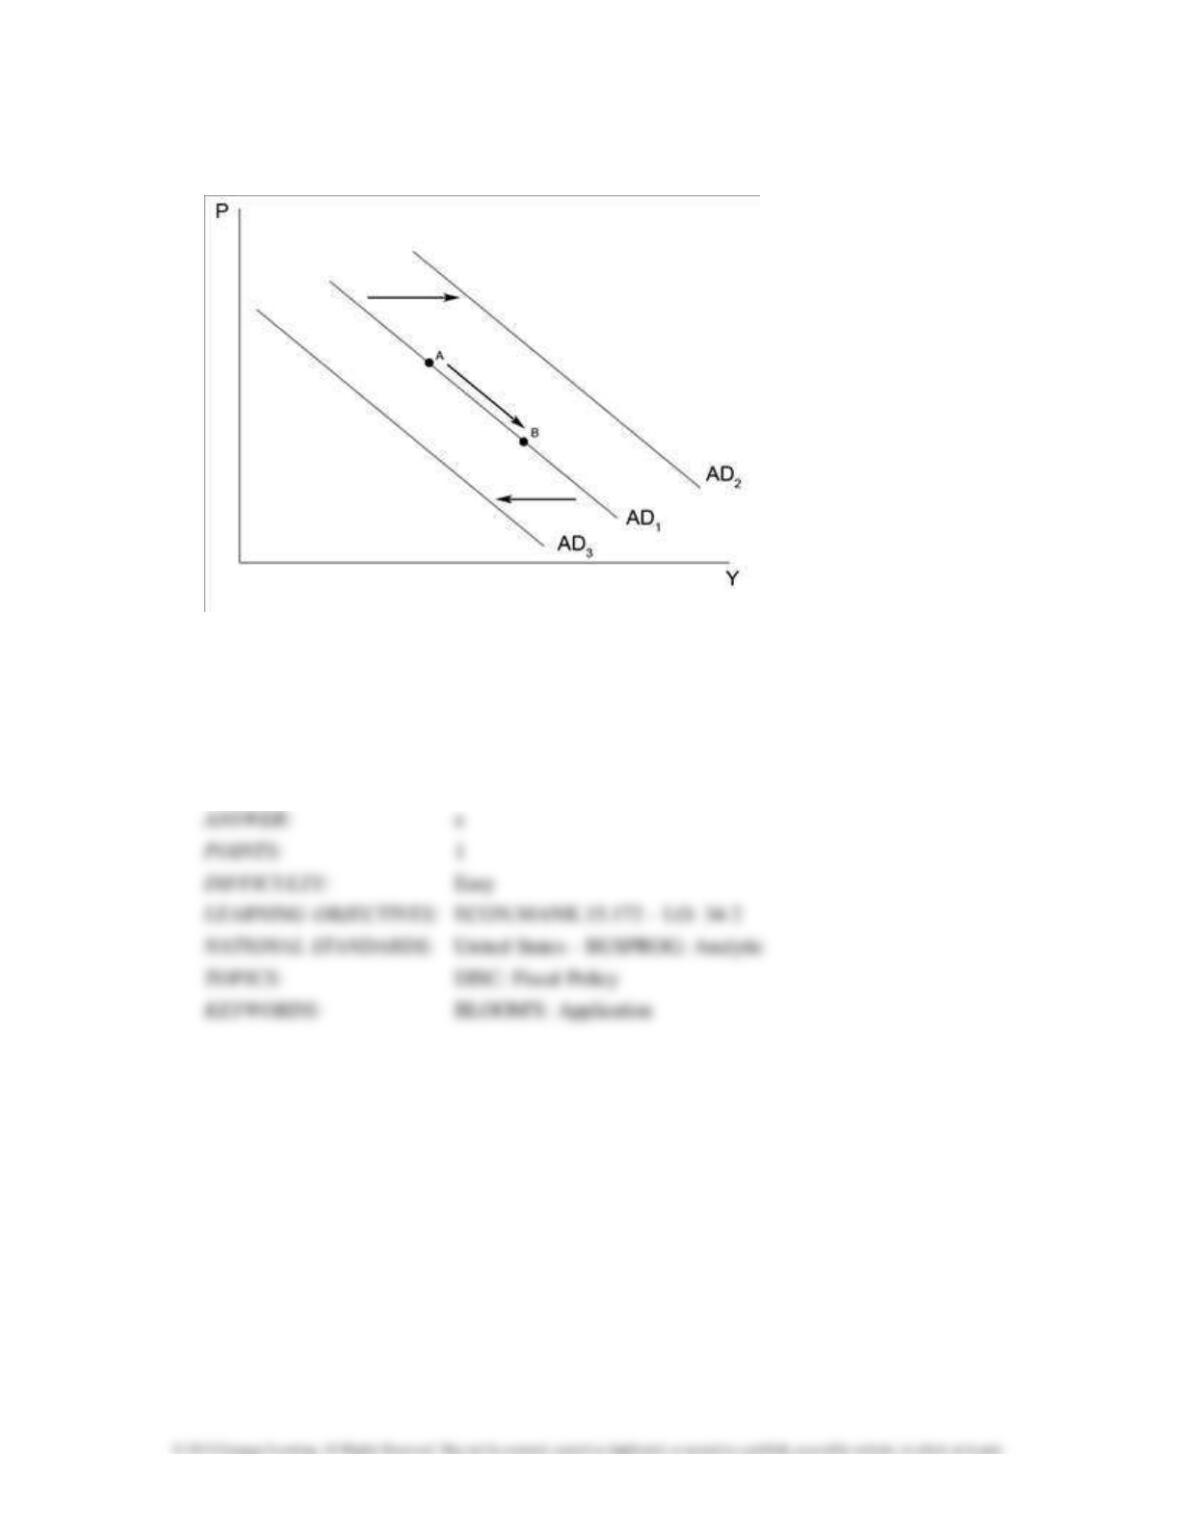
Figure 34-8
5.
Refer to Figure 34–8. An increase in government purchases will
a.
shift aggregate demand from AD1 to AD2.
b.
shift aggregate demand from AD1 to AD3.
c.
cause movement from point A to point B along AD1.
d.
have no effect on aggregate demand.
6.
Refer to Figure 34-8. An increase in taxes will
a.
shift aggregate demand from AD1 to AD2.
b.
shift aggregate demand from AD1 to AD3.
c.
cause movement from point A to point B along AD1.
d.
have no effect on aggregate demand.
7.
The marginal propensity to consume (MPC) is defined as the fraction of
a.
extra income that a household consumes rather than saves.
b.
extra income that a household either consumes or saves.
c.
total income that a household consumes rather than saves.
d.
total income that a household either consumes or saves.
8.
The multiplier for changes in government spending is calculated as
a. 1/(1+MPC).
b. (1 – MPC)/MPC.
c. 1/MPC.
d. 1/(1 – MPC).
9.
The multiplier for changes in government spending is calculated as
a.
1/MPC.
b.
1/(1 – MPC).
c.
MPC/(1 – MPC).
d.
(1 – MPC)/MPC.
10.
If the MPC = 4/5, then the government purchases multiplier is
a.
5/4.
b.
4/5.
c.
5.
d.
20.
11.
If the MPC = 0.75, then the government purchases multiplier is about
a.
1.33.
b.
7.
c.
4.
d.
3.
12.
If the multiplier is 3, then the MPC is
a.
1/3.
b.
3/4.
c.
4/3.
d.
2/3.
13.
If the multiplier is 6, then the MPC is
a. 0.16.
b. 0.83.
c. 0.71.
d. 0.86.
14.
If the multiplier is 5.25, then the MPC is
a. 0.19.
b. 0.68.
c. 0.81.
d. 0.84.
15.
In a certain economy, when income is $100, consumer spending is $60. The value of the multiplier
for this economy
is 4. It follows that, when income is $101, consumer spending is
a. $60.25.
b. $60.75.
c. $61.33.
d. $64.00.
16.
In a certain economy, when income is $500, consumer spending is $375. The value of the
multiplier for this
economy is 5. It follows that, when income is $510, consumer spending is
a.
$381.67.
b. $378.
c. $383.
d. $383.33.
17.
In a certain economy, when income is $1000, consumer spending is $800. The value of the
multiplier for this
economy is 2.5. It follows that, when income is $1020, consumer spending is
a.
$816. For this economy, an initial increase of $100 in consumer spending translates into a $250
increase in
aggregate demand.
b.
$816. For this economy, an initial increase of $100 in consumer spending translates into a $400
increase in
aggregate demand.
c.
$812. For this economy, an initial increase of $100 in consumer spending translates into a $250
increase in
aggregate demand.
d.
$812. For this economy, an initial increase of $100 in consumer spending translates into an $800
increase in
aggregate demand.
18.
In a certain economy, when income is $400, consumer spending is $325. The value of the
multiplier for this
economy is 3.33. It follows that, when income is $450, consumer spending is
a.
$360. For this economy, an initial increase of $50 in consumer spending translates into a
$266.67 increase in
aggregate demand.
b.
$360. For this economy, an initial increase of $50 in consumer spending translates into a
$166.50 increase in
aggregate demand.
c.
$341.67. For this economy, an initial increase of $50 in consumer spending translates into a
$266.67 increase
in aggregate demand.
d.
$341.67. For this economy, an initial increase of $50 in consumer spending translates into a
$166.25 increase
in aggregate demand.
19.
Suppose an economy’s marginal propensity to consume (MPC) is 0.6. Then
a.
1 + MPC + MPC 2 + MPC 3 = 1.844 and, if we continued adding up terms in this geometric
series, we would
get closer and closer to the multiplier value of 1.96.
b.
1 + MPC + MPC 2 + MPC 3 = 1.844 and, if we continued adding up terms in this geometric
series, we would
get closer and closer to the multiplier value of 3.
c.
1 + MPC + MPC 2 + MPC 3 = 2.176 and, if we continued adding up terms in this geometric
series, we would
get closer and closer to the multiplier value of 3.
d.
1 + MPC + MPC 2 + MPC 3 = 2.176 and, if we continued adding up terms in this geometric
series, we would
get closer and closer to the multiplier value of 2.5.
20.
Which of the following policy actions shifts the aggregate-demand curve?
a.
an increase in the money supply
b.
an increase in taxes
c.
an increase in government spending
d.
All of the above are correct.
21.
Government purchases are said to have a
a.
multiplier effect on aggregate supply.
b.
multiplier effect on aggregate demand.
c.
liquidity-enhancing effect on aggregate supply.
d.
liquidity-enhancing effect on aggregate demand.
22.
The logic of the multiplier effect applies
a.
only to changes in government spending.
b.
to any change in spending on any component of GDP.
c.
only to changes in the money supply.
d.
only when the crowding–out effect is sufficiently strong.
23.
The multiplier effect states that there are additional shifts in aggregate demand from fiscal policy,
because it
a.
reduces investment and thereby increases consumer spending.
b.
increases the money supply and thereby reduces interest rates.
c.
increases income and thereby increases consumer spending.
d.
decreases income and thereby increases consumer spending.
24.
In order to simplify the equation for the multiplier to its familiar, relatively simple form, we make
use of the
a.
assumption that increases in government purchases have no effect on consumer spending.
b.
assumption that the feedback effects associated with changes in government purchases become
negligible
after two or three rounds of spending have occurred.
c.
empirical evidence that points to a value of about 3/4 for the MPC.
d.
fact that the multiplier effect is represented by an infinite geometric series.
25.
Refer to Scenario 34-1. The marginal propensity to consume for this economy is
a. 0.650.
b. 0.750.
c.
0.650 or 0.664, depending on whether income is $10,000 or $11,000.
d. 0.800.
26.
Refer to Scenario 34-1. The multiplier for this economy is
a. 2.85.
b. 1.53.
c. 4.00.
d. 7.00.
27.
Refer to Scenario 34-1. For this economy, an initial increase of $200 in net exports translates
into a(n)
a.
$570 increase in aggregate demand when the crowding-out effect is taken into account.
b.
$800 increase in aggregate demand when the crowding-out effect is taken into account.
c.
$1,400 increase in aggregate demand in the absence of the crowding-out effect.
d.
$800 increase in aggregate demand in the absence of the crowding-out effect.
The Influence of Monetary and Fiscal Policy on Aggregate Demand 8341
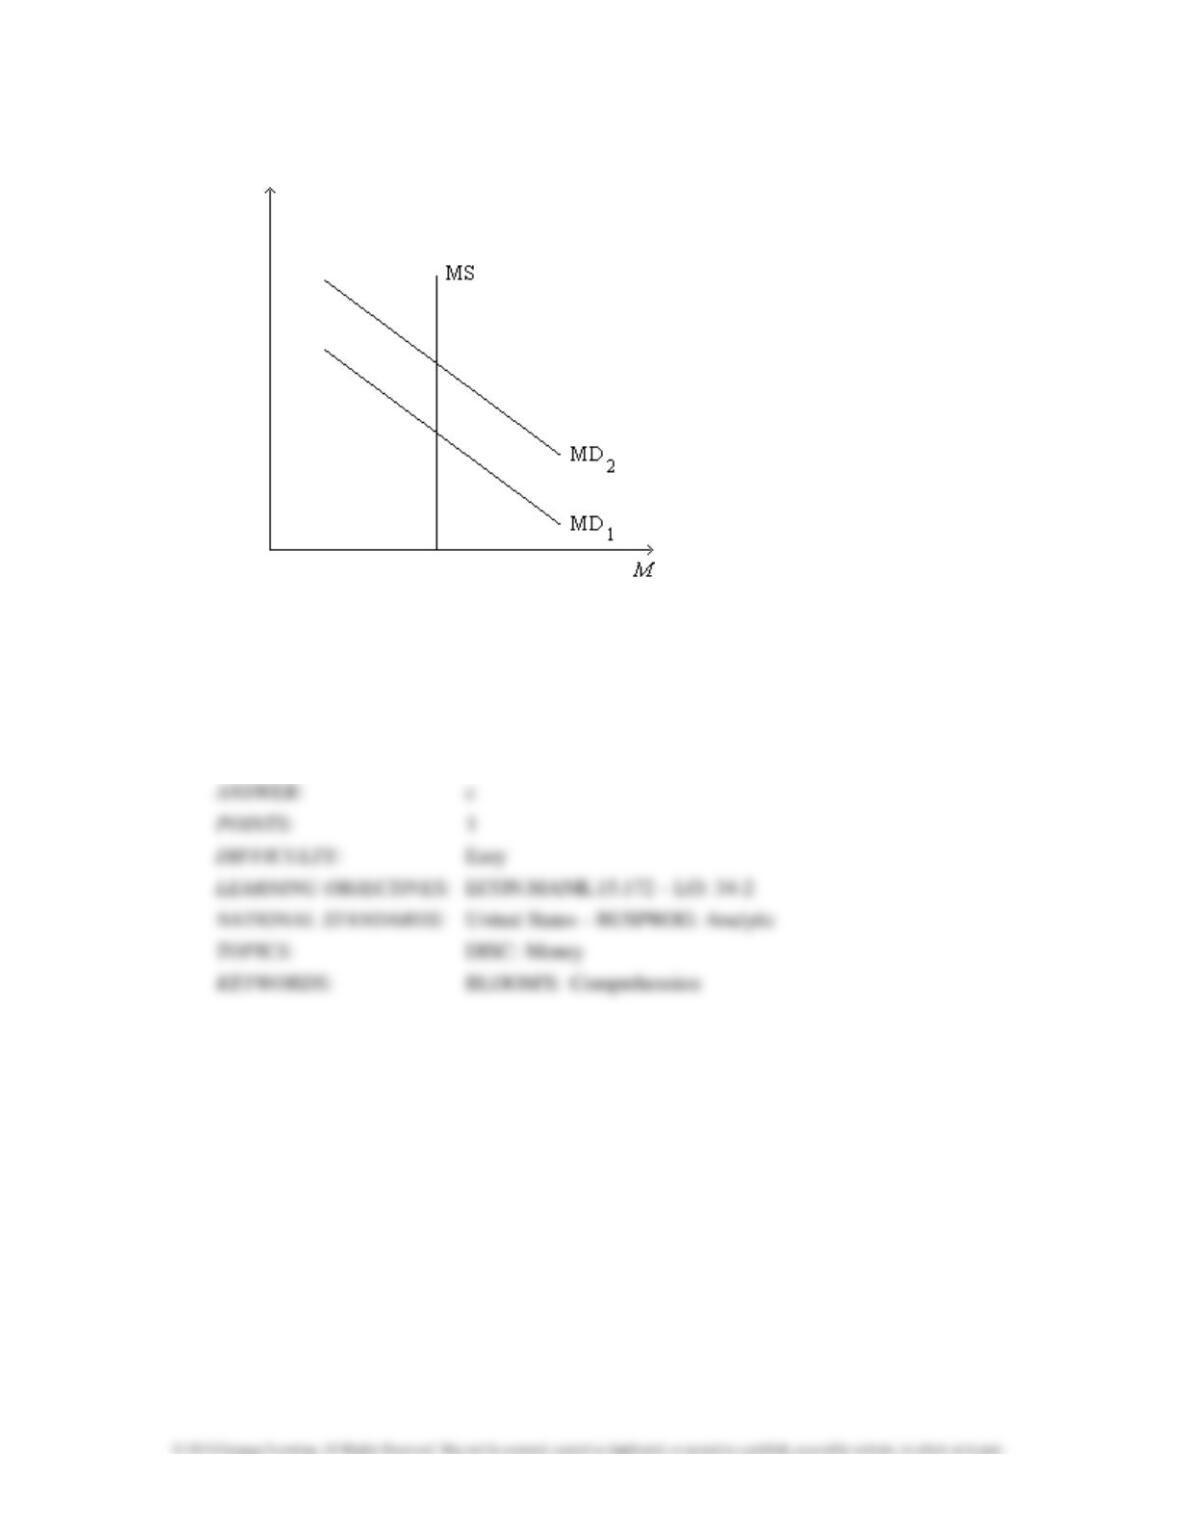
Figure 34-5. On the figure, MS represents money supply and MD represents money demand.
28.
Refer to Figure 34-5. What is measured along the vertical axis of the graph?
a.
the quantity of output
b.
the amount of crowding out
c.
the interest rate
d.
the price level
29.
Refer to Figure 34–5. A shift of the money-demand curve from MD1 to MD2 could be a result
of
a.
a decrease in taxes.
b.
an increase in government spending.
c.
an increase in the price level.
d.
All of the above are correct.
30.
Refer to Figure 34-5. A shift of the money-demand curve from MD2 to MD1 is consistent with
which of the
following sets of events?
a.
The government cuts taxes, resulting in an increase in people’s incomes.
b.
The government reduces government spending, resulting in a decrease in people’s incomes.
c.
The Federal Reserve increases the supply of money, which decreases the interest rate.
d.
All of the above are correct.