Money Growth and Inflation 7369
60.
Open-market purchases by the Fed
a.
make the price level and value of money fall.
b.
make the price level rise, and make the value of money fall.
c.
make the price level and make the value of money rise.
d.
make the price level fall, and make the value of money rise.
61.
Which of the following is correct?
a.
If the Fed purchases bonds in the open market, then the money supply curve shifts right. A
change in the
price level does not shift the money supply curve.
b.
If the Fed sells bonds in the open market, then the money supply curve shifts right. A change in
the price
level does not shift the money supply curve.
c.
If the Fed purchases bonds, then the money supply curve shifts right. An increase in the price
level shifts the
money supply curve right.
d.
If the Fed sells bonds, then the money supply curve shifts right. A decrease in the price level
shifts the
money supply curve right.
62.
When the money market is drawn with the value of money on the vertical axis, if the Federal
Reserve sells bonds,
then the money supply curve
a.
shifts right, causing the price level to rise.
b.
shifts right, causing the price level to fall.
c.
shifts left, causing the price level to rise.
d.
shifts left, causing the price level to fall.
63.
When the money market is drawn with the value of money on the vertical axis, if the Federal
Reserve buys bonds,
then the money supply curve
a.
shifts rightward, causing the value of money measured in terms of goods and services to rise.
b.
shifts rightward, causing the value of money measured in terms of goods and services to fall.
c.
shifts leftward, causing the value of money measured in terms of goods and services to rise.
d.
shifts leftward, causing the value of money measured in terms of goods and services to fall.

64.
When the money market is drawn with the value of money on the vertical axis, if the Fed sells
bonds then
a.
the money supply and the price level increase.
b.
the money supply and the price level decrease.
c.
the money supply increases and the price level decreases.
d.
the money supply increases and the price level increases.
65.
When the money market is drawn with the value of money on the vertical axis, a decrease in the
money supply
leads people to
a.
spend more so the value of a dollar rises.
b.
spend more so the value of a dollar falls.
c.
spend less so the value of a dollar rises.
d.
spend less so the value of a dollar falls.
66.
When the money market is drawn with the value of money on the vertical axis, if money supply
and money demand
both shift to the right
a.
the price level must have risen
b.
the price level must have fallen.
c.
the price level rises if money supply shifts farther than money demand.
d.
the price level falls if money supply shifts farther than money demand.
67.
Consider the money market drawn with the value of money on the vertical axis. If money demand
is unchanged
and the price level rises, then
a.
the money supply must have increased, perhaps because the Fed bought bonds.
b.
the money supply must have increased, perhaps because the Fed sold bonds.
c.
the money supply must have decreased, perhaps because the Fed bought bonds.
d.
the money supply must have decreased, perhaps because the Fed sold bonds.
68.
Suppose there is a surplus in the money market.
a.
This could have been created by an increase in the money supply. The value of money will rise.
b.
This could have been created by an increase in the money supply. The value of money will fall.
c.
This could have been created by a decrease in the money supply. The value of money will rise.
d.
This could have been created by a decrease in the money supply. The value of money will fall.
69.
The value of money falls. This might be because the Federal Reserve
a.
bought bonds, which increased the money supply.
b.
bought bonds, which decreased the money supply.
c.
sold bonds, which increased the money supply.
d.
sold bonds, which decreased the money supply.
70.
When the money market is drawn with the value of money on the vertical axis, if money demand
shifts leftward,
then initially there is an
a.
excess demand for money which causes the price level to rise.
b.
excess demand for money which causes the price level to fall.
c.
excess supply of money which causes the price level to rise.
d.
excess supply of money which causes the price level to fall.
71.
The price level rises if either
a.
money demand shifts rightward or money supply shifts leftward; this rise in the price level is
associated with
a rise in the value of money.
b.
money demand shifts rightward or money supply shifts leftward; this rise in the price level is
associated with
a fall in the value of money.
c.
money demand shifts leftward or money supply shifts rightward; this rise in the price level is
associated with
a rise in the value of money.
d.
money demand shifts leftward or money supply shifts rightward; this rise in the price level is
associated with
a fall in the value of money.
72.
When the money market is drawn with the value of money on the vertical axis, the price level
increases if
a.
either money demand or money supply shifts right.
b.
either money demand or money supply shifts left.
c.
money demand shifts right or money supply shifts left.
d.
money demand shifts left or money supply shifts right.
73.
When the money market is drawn with the value of money on the vertical axis, the price level
increases if
a.
money demand shifts right and decreases if money supply shifts right.
b.
money demand shifts right and decreases if money supply shifts left.
c.
money demand shifts left and decreases if money supply shifts right.
d.
money demand shifts left and decreases if money supply shifts left.
74.
The price level rises if either
a.
money demand or money supply shifts rightward.
b.
money demand shifts rightward or money supply shifts leftward.
c.
money demand shifts leftward or money supply shifts rightward.
d.
money demand or money supply shifts leftward.
75.
When the money market is drawn with the value of money on the vertical axis, the price level
decreases if
a.
either money demand or money supply shifts right.
b.
either money demand or money supply shifts left.
c.
money demand shifts right or money supply shifts left.
d.
money demand shifts left or money supply shifts right.
76.
When the money market is drawn with the value of money on the vertical axis, the value of
money decreases if
a.
either money demand or money supply shifts right.
b.
either money demand or money supply shifts left.
c.
money demand shifts right or money supply shifts left.
d.
money demand shifts left or money supply shifts right.
7378 Money Growth and Inflation
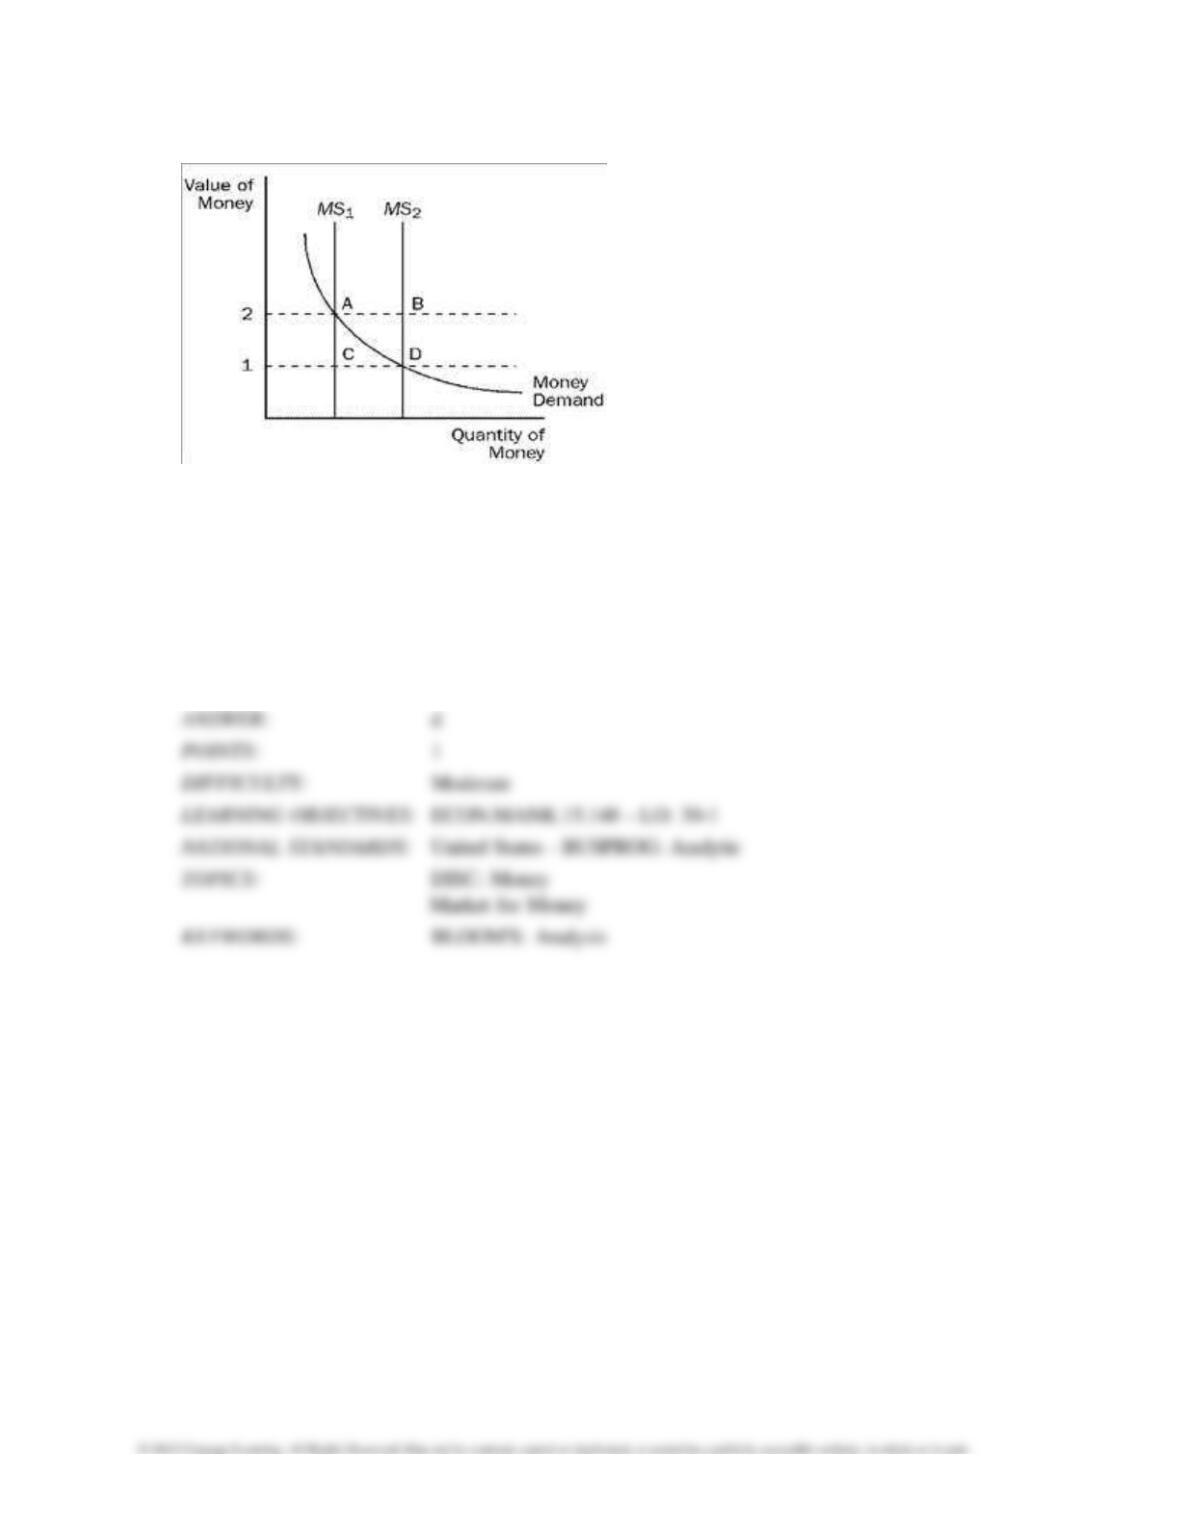
Figure 30-1
77.
Refer to Figure 30–1. If the money supply is MS2 and the value of money is 2, then there is an
excess
a.
demand for money that is represented by the distance between points A and C.
b.
demand for money that is represented by the distance between points A and B.
c.
supply of money that is represented by the distance between points A and C.
d.
supply of money that is represented by the distance between points A and B.
78.
Refer to Figure 30-1. If the money supply is MS2 and the value of money is 2, then
a.
the quantity of money demanded is greater than the quantity supplied; the price level will rise.
b.
the quantity of money demanded is greater than the quantity supplied; the price level will fall.
c.
the quantity of money supplied is greater than the quantity demanded; the price level will rise.
d.
the quantity of money supplied is greater than the quantity demanded; the price level will fall.
79.
Refer to Figure 30–1. When the money supply curve shifts from MS1 to MS2,
a.
the demand for goods and services decreases.
b.
the economy‘s ability to produce goods and services increases.
c.
the equilibrium price level decreases.
d.
None of the above is correct.
80.
Refer to Figure 30–1. When the money supply curve shifts from MS1 to MS2,
a.
the equilibrium value of money decreases.
b.
the equilibrium price level decreases.
c.
the supply of money has decreased.
d.
the demand for goods and services will decrease.
81.
Refer to Figure 30–1. If the current money supply is MS1, then
a.
equilibrium exists when the value of money is 2.
b.
equilibrium exists when the equilibrium is at point D.
c.
equilibrium exists when the value of money is 1.
d.
there is excess demand if the value of money is 2.
Money Growth and Inflation 7381
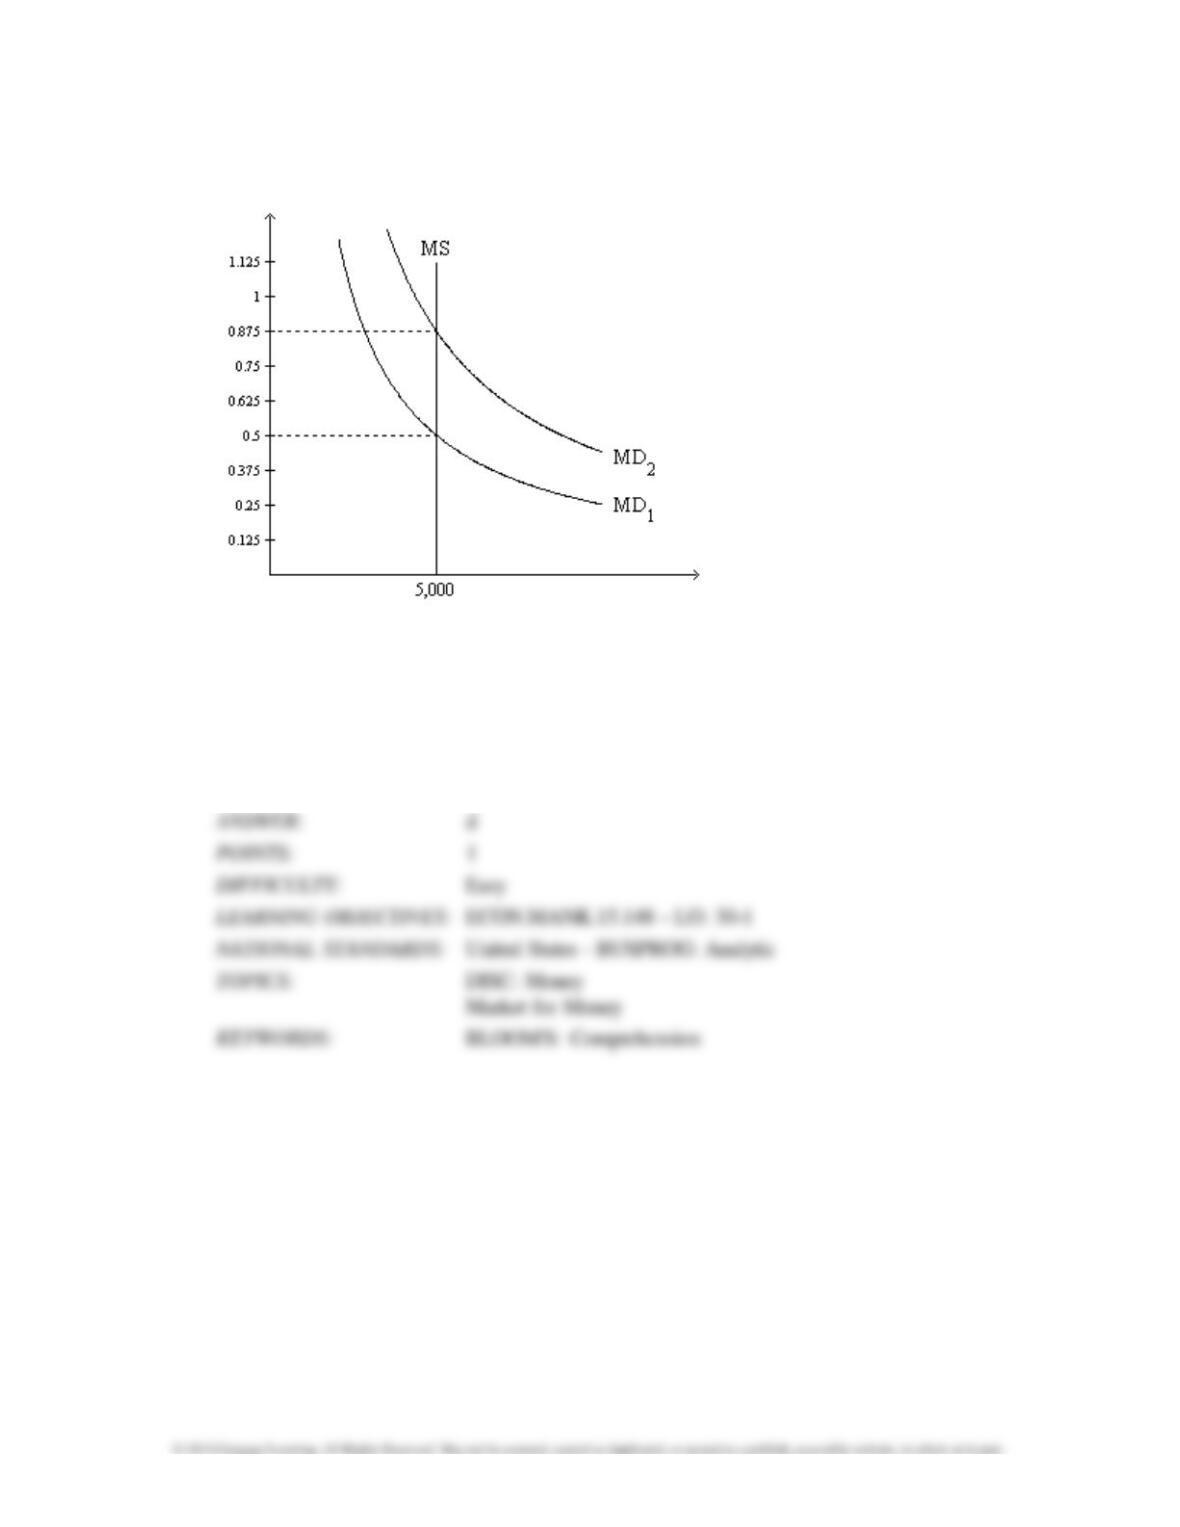
Figure 30-2. On the graph, MS represents the money supply and MD represents money
demand. The usual
quantities are measured along the axes.
82.
Refer to Figure 30-2. What quantity is measured along the horizontal axis?
a.
the price level
b.
the real interest rate
c.
the value of money
d.
the quantity of money
83.
Refer to Figure 30–2. If the relevant money-demand curve is the one labeled MD1, then the
equilibrium value of
money is
a.
0.5 and the equilibrium price level is 2.
b.
2 and the equilibrium price level is 0.5.
c.
0.5 and the equilibrium price level cannot be determined from the graph.
d.
2 and the equilibrium price level cannot be determined from the graph.
84.
Refer to Figure 30-2. If the relevant money-demand curve is the one labeled MD1, then
a.
when the money market is in equilibrium, one dollar purchases one-half of a basket of goods
and services.
b.
when the money market is in equilibrium, one unit of goods and services sells for 2 dollars.
c.
there is an excess demand for money if the value of money in terms of goods and services is
0.375.
d.
All of the above are correct.
85.
Refer to Figure 30–2. Which of the following events could explain a shift of the money-demand
curve from MD1 to MD2?
a.
an increase in the value of money
b.
a decrease in the price level
c.
an open-market purchase of bonds by the Federal Reserve
d.
None of the above is correct.
86.
Refer to Figure 30-2. Suppose the relevant money-demand curve is the one labeled MD1; also
suppose the
velocity of money is 4. If the money market is in equilibrium, then the economy’s real
GDP amounts to
a. 2,500.
b. 7,500.
c. 10,000.
d. 40,000.
87.
Refer to Figure 30–2. Suppose the relevant money-demand curve is the one labeled MD1; also
suppose the
economy’s real GDP is 20,000 for the year. If the money market is in equilibrium,
then how many times per year is
the typical dollar bill used to pay for a newly produced good or
service?
a.
4
b.
2
c.
8
d.
10
88.
Refer to Figure 30–2. At the end of 2009 the relevant money-demand curve was the one
labeled MD2. At the
end of 2010 the relevant money-demand curve was the one labeled MD1.
Assuming the economy is always in
equilibrium, what was the economy’s approximate inflation
rate for 2010?
a.
-43 percent
b.
-57 percent
c.
57 percent
d.
75 percent
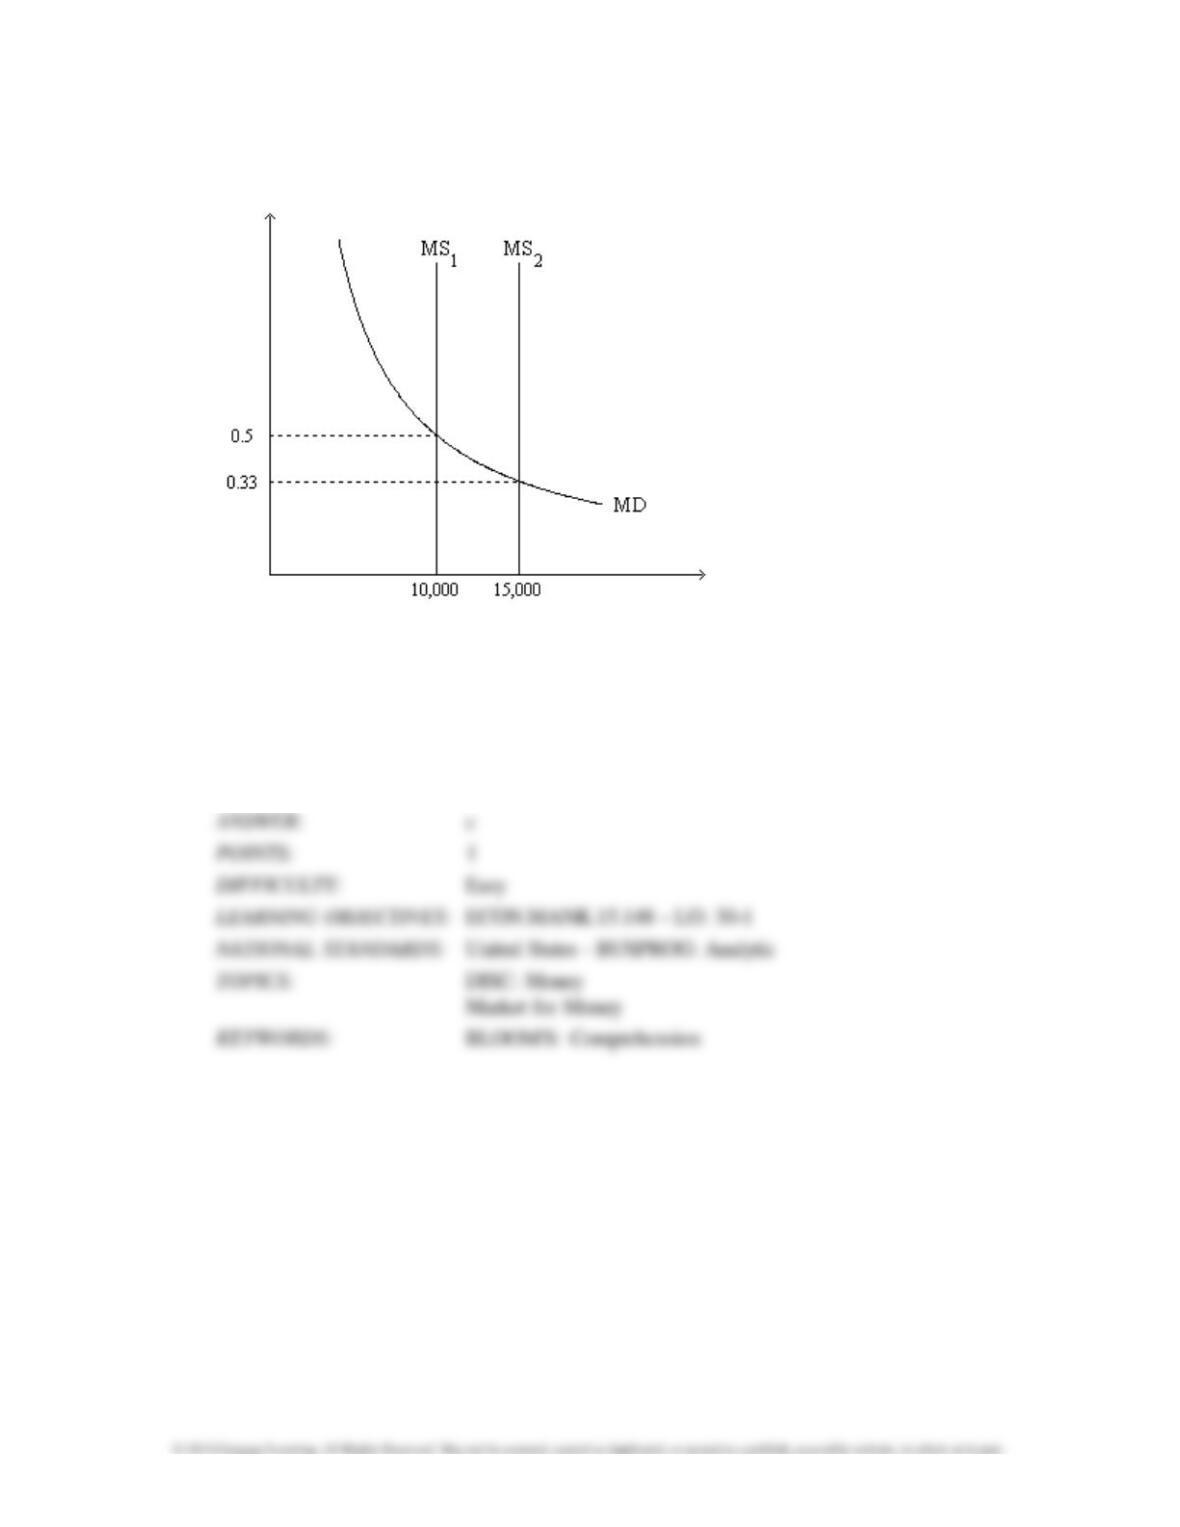
Money Growth and Inflation 7385
Figure 30-3. On the graph, MS represents the money supply and MD represents money
demand. The usual
quantities are measured along the axes.
89.
Refer to Figure 30-3. What quantity is measured along the vertical axis?
a.
the price level
b.
the velocity of money
c.
the value of money
d.
the quantity of money

90.
Refer to Figure 30-3. If the relevant money-supply curve is the one labeled MS1, then the
equilibrium price level
is
a.
0.5 and the equilibrium value of money is 2.
b.
2 and the equilibrium value of money is 0.5.
c.
0.5 and the equilibrium value of money cannot be determined from the graph.
d.
2 and the equilibrium value of money cannot be determined from the graph.
91.
Refer to Figure 30-3. If the relevant money-supply curve is the one labeled MS2, then
a.
when the money market is in equilibrium, one dollar purchases about one-third of a basket of
goods and
services.
b.
when the money market is in equilibrium, one unit of goods and services sells for 33 cents.
c.
there is an excess demand for money if the value of money in terms of goods and services is
0.5.
d.
All of the above are correct.
92.
Refer to Figure 30-3. Which of the following events could explain a shift of the money-supply
curve from MS1 to
MS2?
a.
an increase in the value of money
b.
a decrease in the price level
c.
an open-market purchase of bonds by the Federal Reserve
d.
the Federal Reserve sells bonds.
93.
Refer to Figure 30-3. Suppose the relevant money-supply curve is the one labeled MS1; also
suppose the
economy’s real GDP is 30,000 for the year. If the money market is in equilibrium,
then the velocity of money is
approximately
a.
3.0
b.
6.0
c.
9.0
d.
1.5
94.
Refer to Figure 30–3. At the end of 2009 the relevant money-supply curve was the one labeled
MS1. At the end
of 2010 the relevant money-supply curve was the one labeled MS2. Assuming
the economy is always in equilibrium,
what was the economy’s approximate inflation rate for
2010?
a.
-33 percent
b.
17 percent
c.
50 percent
d.
67 percent
95.
Economic variables whose values are measured in monetary units are called
a.
dichotomous variables.
b.
nominal variables.
c.
classical variables.
d.
real variables.