The Short-Run Trade-off between Inflation and Unemployment 8485
33. In the long run, policy that changes aggregate demand changes
a. both unemployment and the price level.
b. neither unemployment nor the price level.
c. only unemployment.
d. only the price level.
34. If policymakers expand aggregate demand, then in the long run
a. prices will be higher and unemployment will be lower.
b. prices will be higher and unemployment will be unchanged.
c. prices and unemployment will be unchanged.
d. None of the above is correct.
8486 The Short-Run Trade-off between Inflation and Unemployment
35. If policymakers decrease aggregate demand, then in the long run
a. prices will be lower and unemployment will be higher.
b. prices will be lower and unemployment will be unchanged.
c. prices and unemployment will be unchanged.
d. None of the above is correct.
36. In 2001, Congress and President Bush instituted tax cuts. According to the short-run Phillips
curve, in the short run this change should have
a. reduced inflation and unemployment.
b. raised inflation and unemployment.
c. reduce inflation and raised unemployment.
d. raised inflation and reduced unemployment.
The Short-Run Trade-off between Inflation and Unemployment 8487
37. According to the short-run Phillips curve, if the central bank increases the money supply, then
a. inflation and unemployment will both fall.
b. inflation and unemployment will both rise.
c. inflation will fall and unemployment will rise.
d. inflation will rise and unemployment will fall.
38. The economy will move to a point on the short-run Phillips curve where unemployment is higher if
a. the inflation rate decreases.
b. the government increases its expenditures.
c. the Fed increases the money supply.
d. None of the above is correct.
39. If the short–run Phillips curve were stable, which of the following would be unusual?
a. an increase in government spending and a fall in unemployment
b. an increase in inflation and a decrease in output
c. a decrease in the inflation rate and a rise in the unemployment rate
d. a decrease in the money supply and a rise in the unemployment rate.
40. Which of the following would we not expect if government policy moved the economy up along a
given short-run Phillips curve?
a. Teresa reads in the newspaper that the central bank recently raised the money supply.
b. Jackie gets fewer job offers.
c. Miguel makes larger increases in the prices at his health food store.
d. Julie’s nominal wage increase is larger.
41. The government of Blenova considers two policies. Policy A would shift AD right by 500 units
while policy B would shift AD right by 300 units. According to the short-run Phillips curve, policy
A will lead
a. to a lower unemployment rate and a lower inflation rate than policy B.
b. to a lower unemployment rate and a higher inflation rate than policy B.
c. to a higher unemployment rate and lower inflation rate than policy B.
d. to a higher unemployment rate and higher inflation rate than policy B.
The Short-Run Trade-off between Inflation and Unemployment 8489
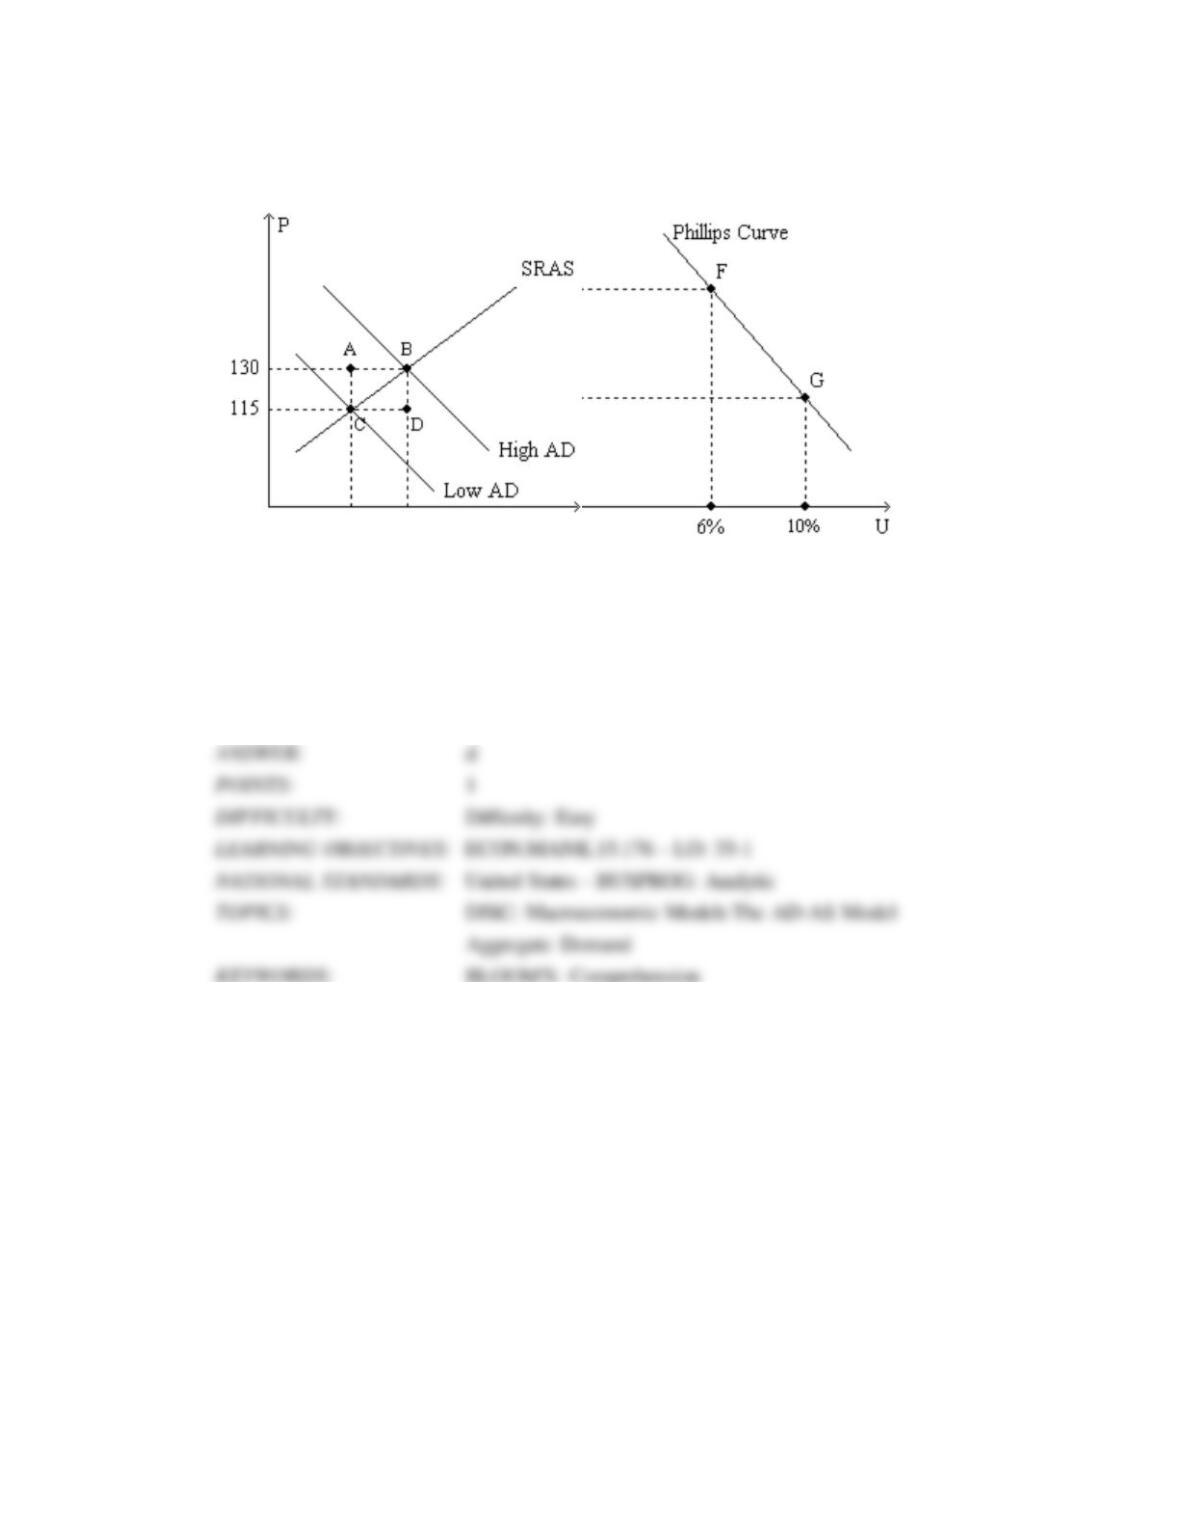
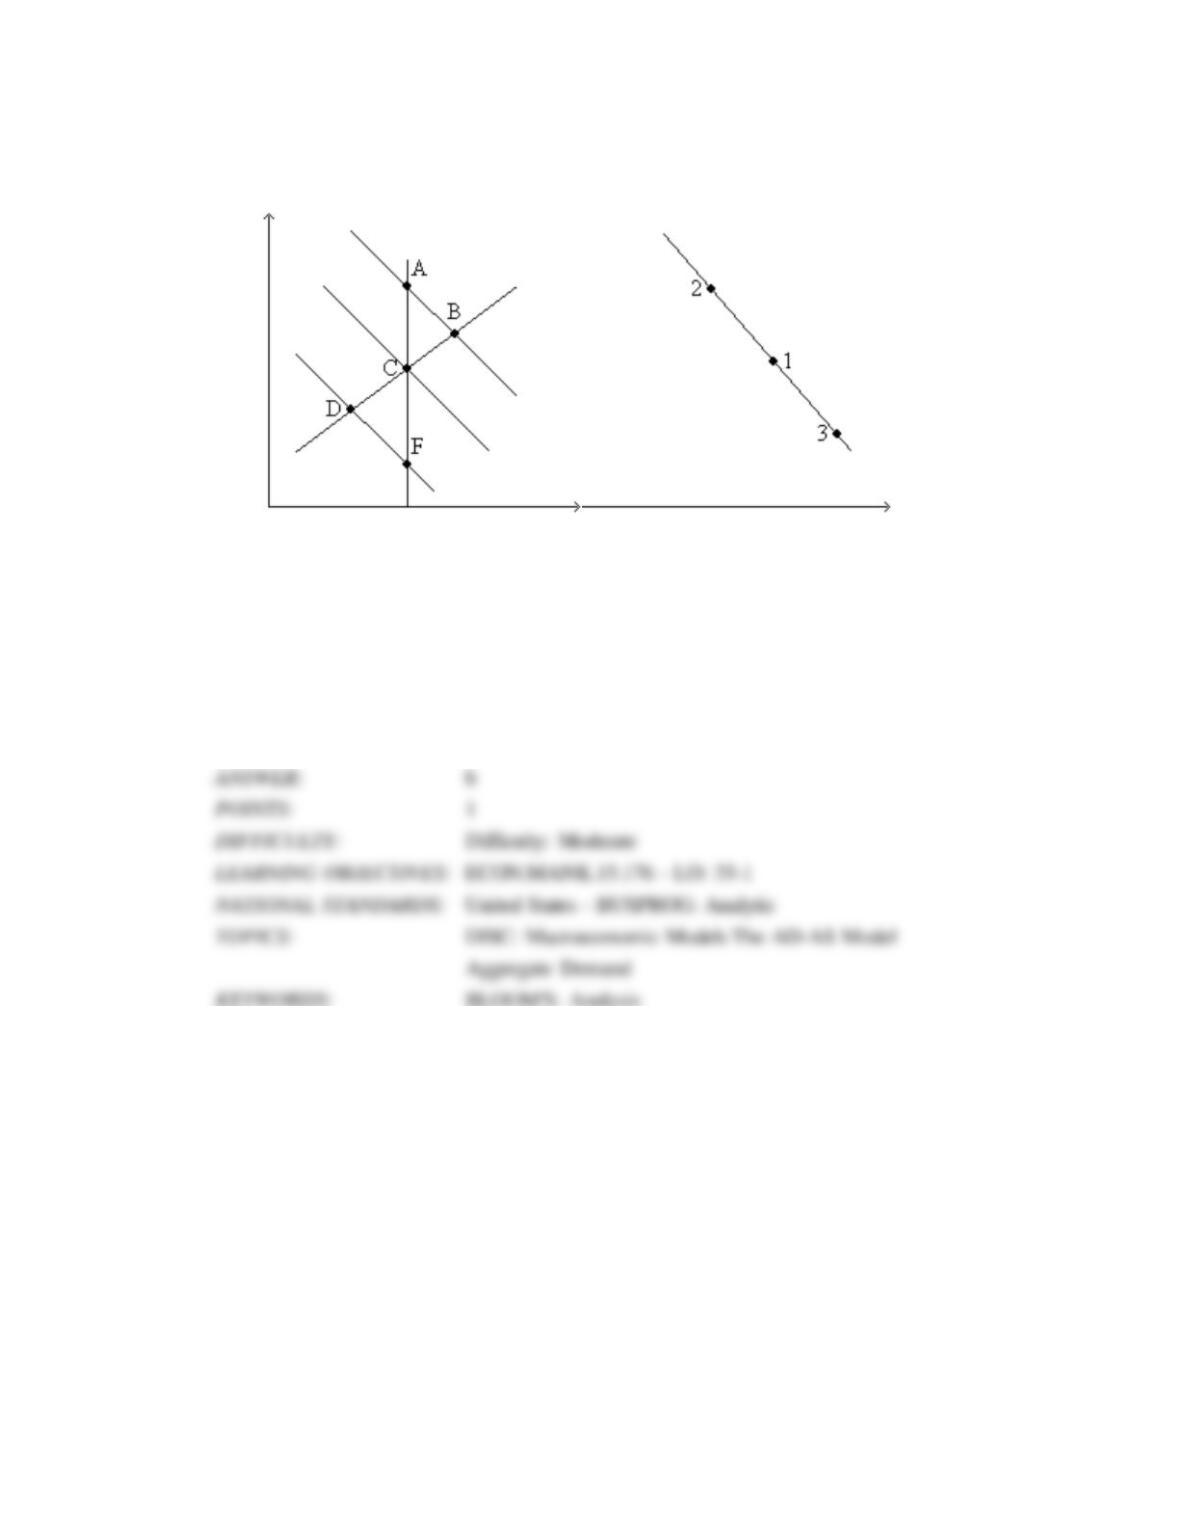
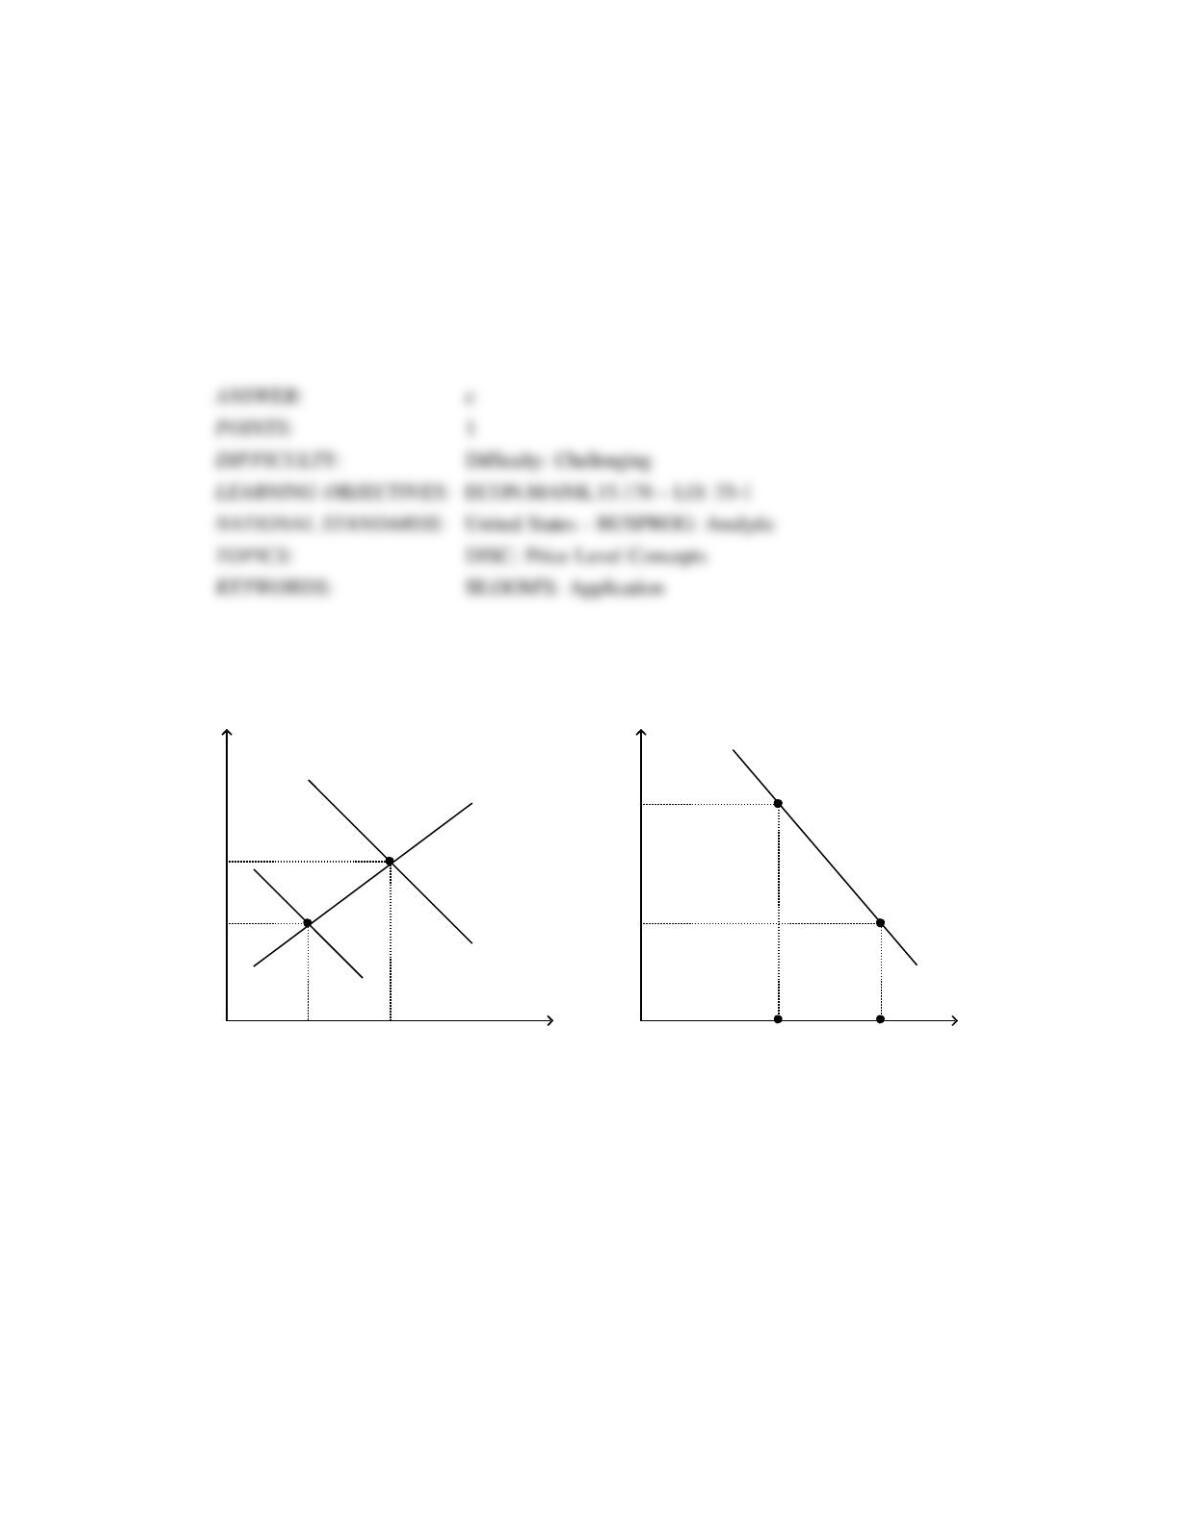
Figure 35-1. The left-hand graph shows a short-run aggregate-supply (SRAS) curve and two
aggregate-demand (AD) curves. On the right-hand diagram, U represents the unemployment rate.
42. Refer to Figure 35-1. What is measured along the horizontal axis of the left-hand graph?
a. the wage rate
b. the inflation rate
c. employment
d. output
8490 The Short-Run Trade-off between Inflation and Unemployment
43. Refer to Figure 35-1. What is measured along the vertical axis of the right-hand graph?
a. the interest rate
b. the inflation rate
c. the wage rate
d. the growth rate of the nominal money supply
44. Refer to Figure 35-1. Assuming the price level in the previous year was 100, point F on the
right-hand graph corresponds to
a. point A on the left-hand graph.
b. point B on the left-hand graph.
c. point C on the left-hand graph.
d. point D on the left-hand graph.
The Short-Run Trade-off between Inflation and Unemployment 8491
45. Refer to Figure 35-1. Assuming the price level in the previous year was 100, point G on the
right-hand graph corresponds to
a. point A on the left-hand graph.
b. point B on the left-hand graph.
c. point C on the left-hand graph.
d. point D on the left-hand graph.
46. Refer to Figure 35-1. Suppose points F and G on the right-hand graph represent two possible
outcomes for an imaginary economy in the year 2012, and those two points correspond to points
B and C, respectively, on the left- hand graph. Then it is apparent that the price index equaled
a. 130 in 2011.
b. 115 in 2011.
c. 110 in 2011.
d. 100 in 2011.
8492 The Short-Run Trade-off between Inflation and Unemployment
47. Refer to Figure 35-1. Suppose points F and G on the right-hand graph represent two possible
outcomes for an imaginary economy in the year 2012, and those two points correspond to points
B and C, respectively, on the left- hand graph. Also suppose we know that the price index equaled
120 in 2011. Then the numbers 115 and 130 on the vertical axis of the left-hand graph would have
to be replaced by
a. 155 and 175, respectively.
b. 138 and 156, respectively.
c. 137.5 and 154.75, respectively.
d. 135 and 150, respectively.
48. Refer to Figure 35-1. The curve that is depicted on the right-hand graph offers policymakers a
“menu” of combinations
a. that applies both in the short run and in the long run.
b. that is relevant to choices involving fiscal policy, but not to choices involving monetary policy.
c. of inflation and unemployment.
d. All of the above are correct.
The Short-Run Trade-off between Inflation and Unemployment 8493
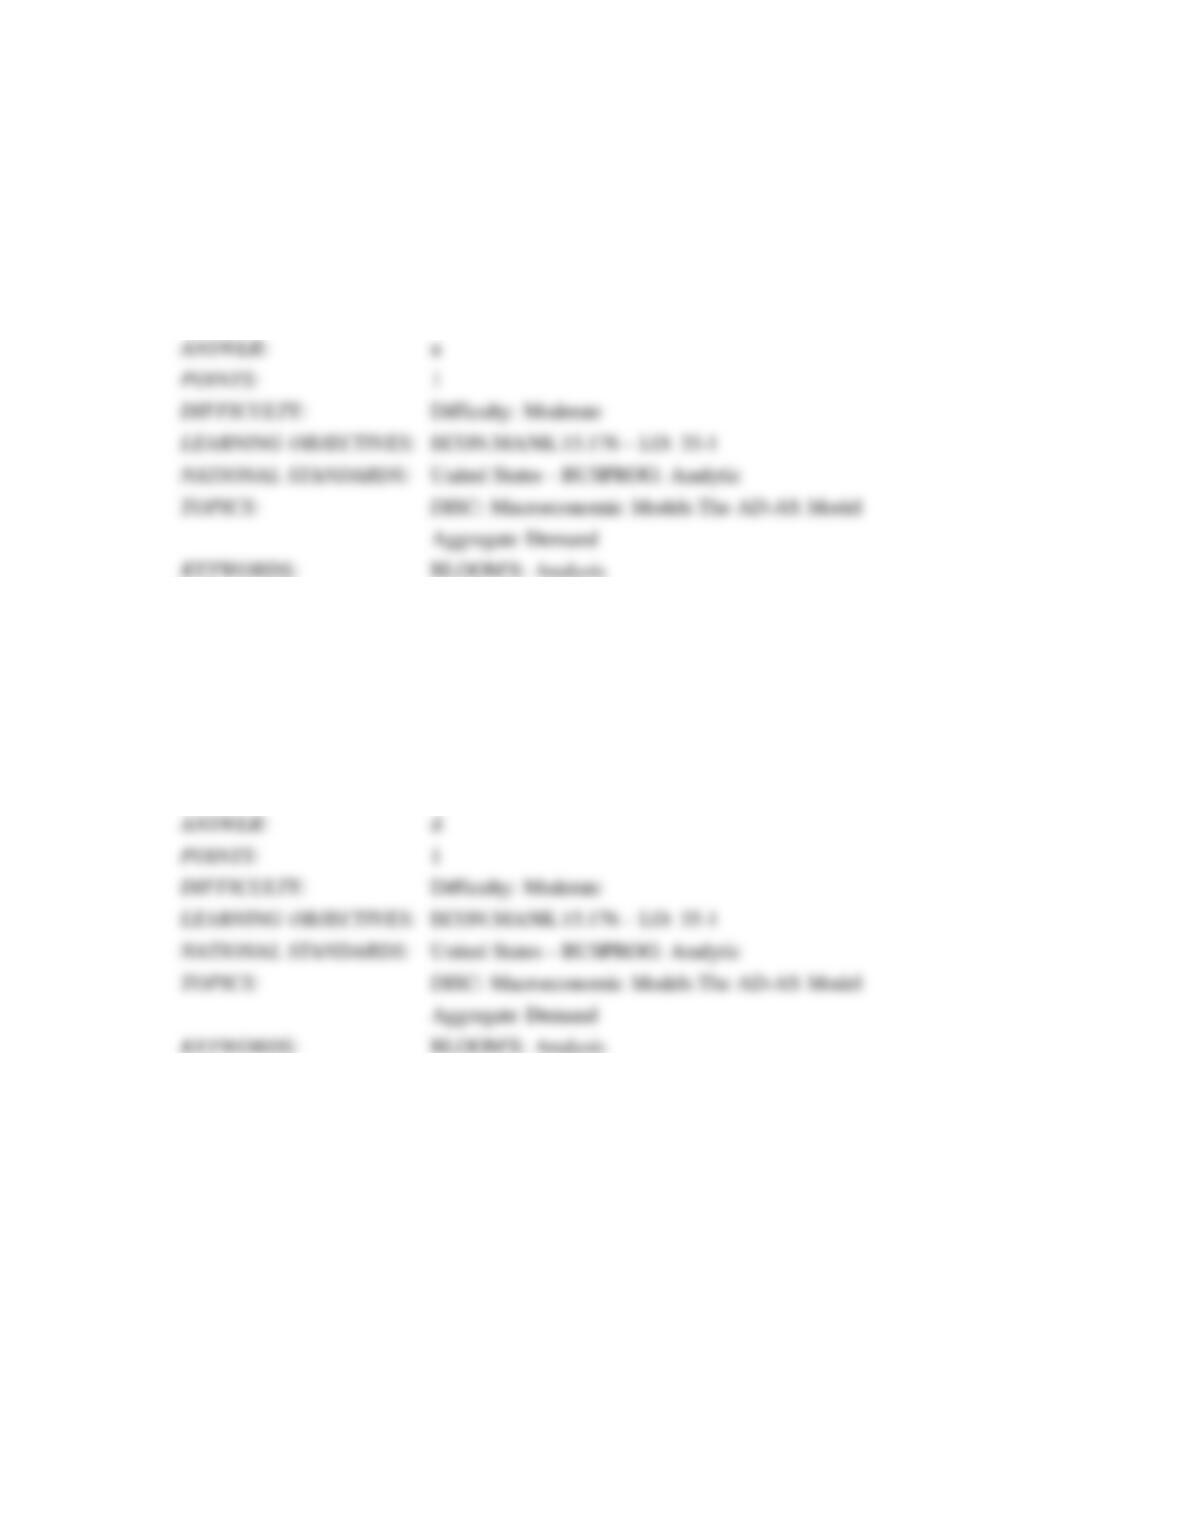
Figure 35–2
Use the pair of diagrams below to answer the following questions.
49. Refer to Figure 35-2. If the economy starts at C and 1, then in the short run, an increase in the
money supply growth rate moves the economy to
a. A and 1
b. B and 2
c. C and 3
d. None of the above is correct.
8494 The Short-Run Trade-off between Inflation and Unemployment
50. Refer to Figure 35–2. If the economy starts at C and 1, then in the short run, an increase in
government expenditures moves the economy to
a. B and 2.
b. B and 3.
c. B and 3.
d. None of the above is correct.
51. Refer to Figure 35-2. If the economy starts at C and 1, then in the short run, a decrease in
taxes moves the economy to
a. D and 2.
b. D and 3.
c. back to C and 1.
d. None of the above is correct.
The Short-Run Trade-off between Inflation and Unemployment 8495
52. Refer to Figure 35-2. If the economy starts at C and 1, then in the short run, a decrease in
aggregate demand moves the economy to
a. A and 2.
b. D and 3.
c. E and 3.
d. None of the above is correct.
53. Refer to Figure 35-2. If the economy starts at C and 1, then in the short run, a decrease in the
money supply moves the economy to
a. E and 1.
b. D and 2.
c. D and 3.
d. None of the above is correct.

8496 The Short-Run Trade-off between Inflation and Unemployment
54. Refer to Figure 35-2. If the economy starts at C and 1, then in the short run, a decrease in
government expenditures moves the economy to
a. D and 2
b. D and 3.
c. E and 3.
d. None of the above is correct.
55. Refer to Figure 35-2. If the economy starts at C and 1, then in the short run, an increase in
taxes moves the economy to
a. B and 2.
b. D and 3.
c. E and 2.
d. None of the above is correct.
The Short-Run Trade-off between Inflation and Unemployment 8497
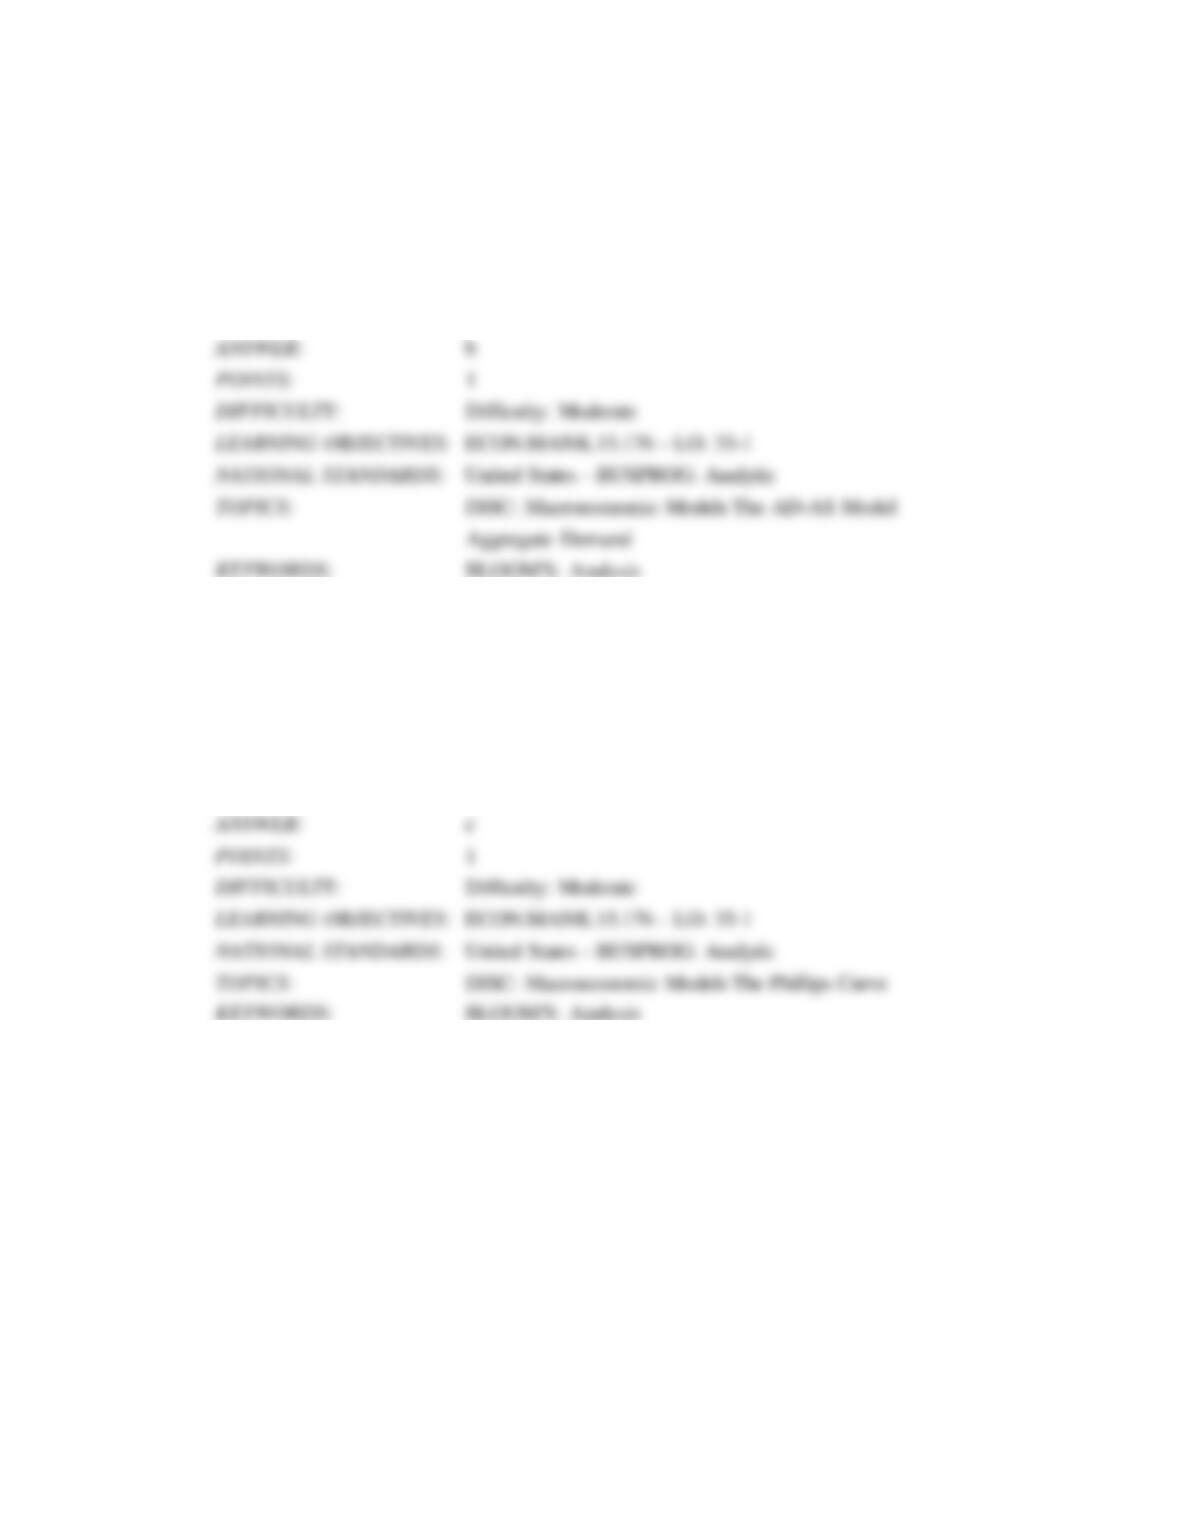
Figure 35-3. The left-hand graph shows a short-run aggregate-supply (SRAS) curve and two
aggregate-demand (AD) curves. On the left-hand diagram, Y represents output and on the right-hand
diagram, U represents the unemployment rate.
56. Refer to Figure 35-3. What is measured along the vertical axis of the left-hand graph?
a. the wage rate
b. the inflation rate
c. the price level
d. the change in output from one year to the next
SRAS
Low AD
156 A
High AD
B
Y
Phillips Curve
9% B
4% A
4.5% 7.5%
U
8498 The Short-Run Trade-off between Inflation and Unemployment
57. Refer to Figure 35-3. What is measured along the vertical axis of the right-hand graph?
a. the interest rate
b. the inflation rate
c. the government’s budget deficit as a percent of GDP
d. the growth rate of the nominal money supply
58. Refer to Figure 35-3. Assume the figure depicts possible outcomes for the year 2018. In 2018,
the economy is at point A on the left-hand graph, which corresponds to point A on the right-hand
graph. The price level in the year 2017 was
a. 144.
b. 150.
c. 152.
d. 156.
The Short-Run Trade-off between Inflation and Unemployment 8499
59. Refer to Figure 35-3. Assume the figure charts possible outcomes for the year 2018. In 2018,
the economy is at point B on the left-hand graph, which corresponds to point B on the right-hand
graph. Also, point A on the left-hand graph corresponds to A on the right-hand graph. The price
level in the year 2018 is
a. 155.56.
b. 159.00.
c. 163.50.
d. 170.04.
Figure 35-4. The left-hand graph shows a short-run aggregate-supply (SRAS) curve and two
aggregate-demand (AD) curves. On the left-hand diagram, the price level is measured on the vertical
axis; on the right-hand diagram, the inflation rate is measured on the vertical axis.
SRAS
Low AD
112.2 A
High AD
B
Phillips Curve
4.5% B
2% A
7.5% 12.5%
8500 The Short-Run Trade-off between Inflation and Unemployment
60. Refer to Figure 35-4. What is measured along the horizontal axis of the left-hand graph?
a. the wage rate
b. the inflation rate
c. output
d. the interest rate
61. Refer to Figure 35-4. What is measured along the horizontal axis of the right-hand graph?
a. the interest rate
b. the price level
c. the government’s budget deficit as a percent of GDP
d. the unemployment rate
The Short-Run Trade-off between Inflation and Unemployment 8501
62. Refer to Figure 35-4. Assume the figure depicts possible outcomes for the year 2018. In 2018,
the economy is at point A on the left-hand graph, which corresponds to point A on the right-hand
graph. The price level in the year 2017 was
a. 106.
b. 108.
c. 110.
d. 112.
63. Refer to Figure 35-4. Assume the figure charts possible outcomes for the year 2018. In 2018,
the economy is at point B on the left-hand graph, which corresponds to point B on the right-hand
graph. Also, point A on the left-hand graph corresponds to A on the right-hand graph. The price
level in the year 2018 is
a. 117.25.
b. 114.95.
c. 113.12.
d. 111.10.
8502 The Short-Run Trade-off between Inflation and Unemployment
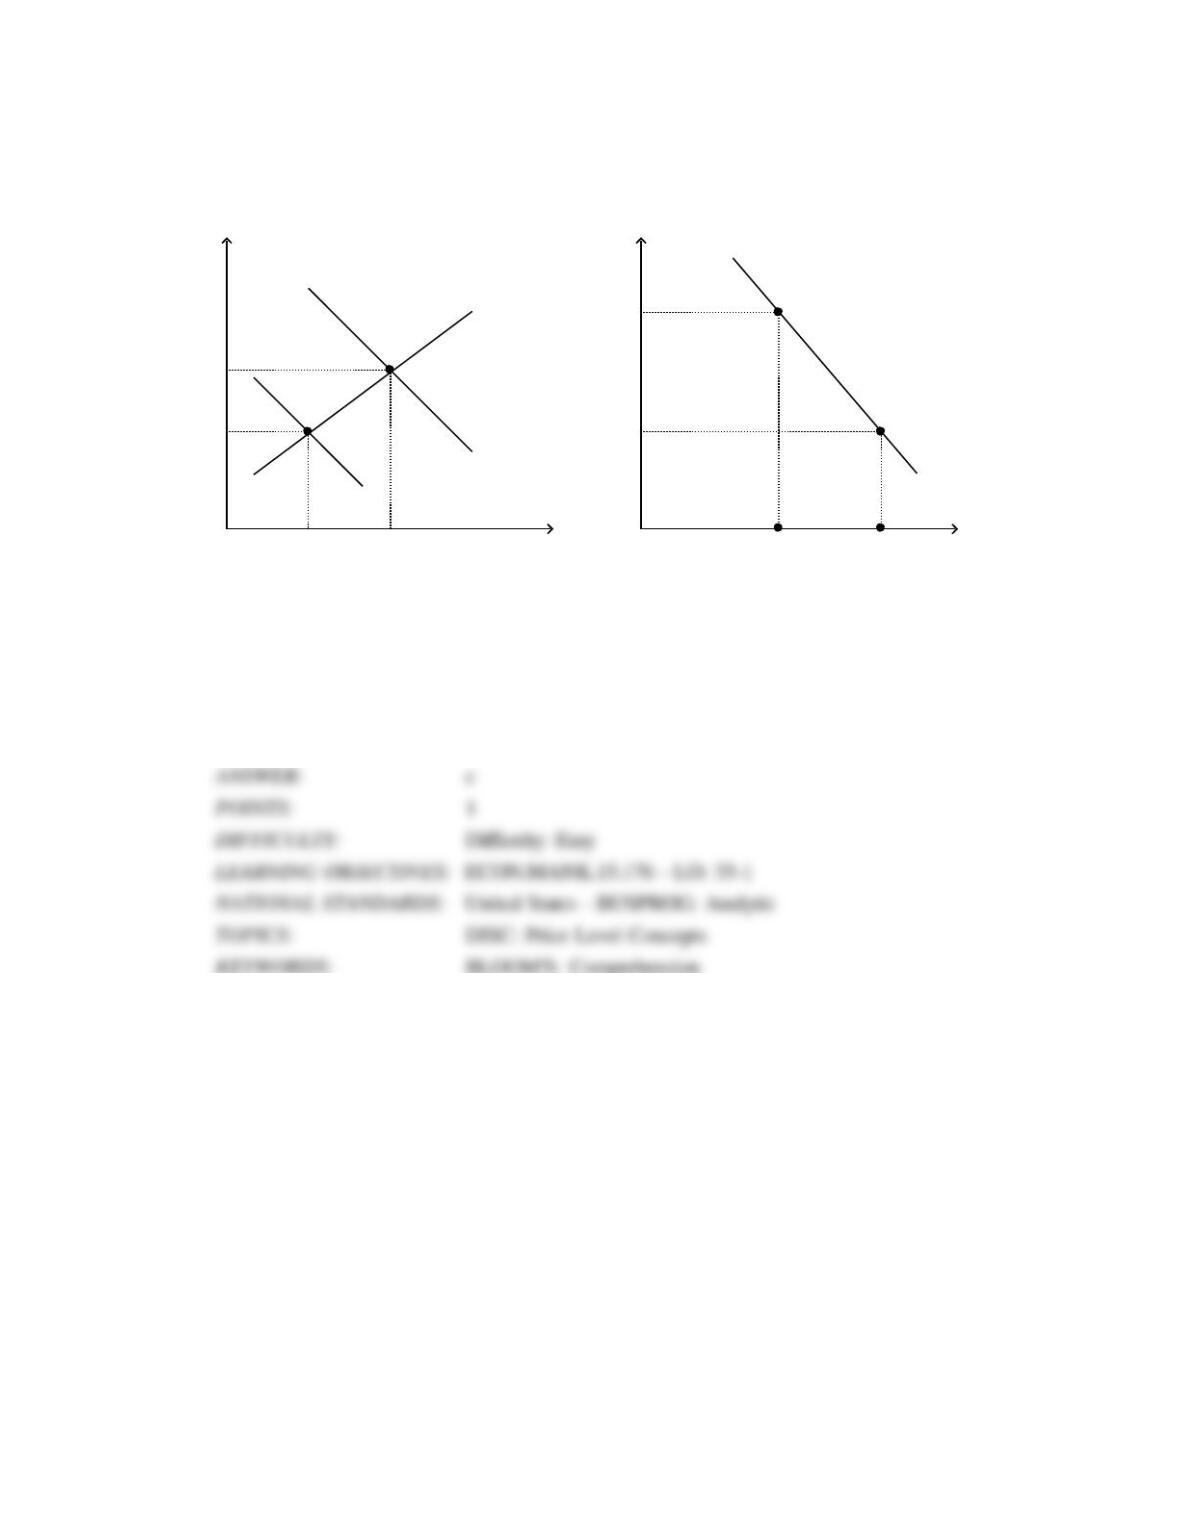
64. As the aggregate demand curve shifts leftward along a given aggregate supply curve,
a. unemployment and inflation are higher.
b. unemployment and inflation are lower.
c. unemployment is higher and inflation is lower.
d. unemployment is lower and inflation is higher.
65. As the aggregate demand curve shifts rightward along a given aggregate supply curve,
a. unemployment and inflation are higher.
b. unemployment and inflation are lower.
c. unemployment is higher and inflation is lower.
d. unemployment is lower and inflation is higher.
The Short-Run Trade-off between Inflation and Unemployment 8503
66. From 2008–2009 the Federal Reserve created a very large increase in the money supply.
According to the short-run Phillips curve this policy should have
a. raised inflation and unemployment.
b. raised inflation and reduced unemployment.
c. reduced inflation and raised unemployment.
d. reduced inflation and unemployment.
67. In 2009 Congress and President Obama approved tax cuts and increased government spending.
According to the short–run Phillips curve these policies should have
a. raised unemployment and inflation.
b. raised unemployment and reduced inflation.
c. reduced unemployment and raised inflation.
d. reduced unemployment and inflation.
8504 The Short-Run Trade-off between Inflation and Unemployment
68. In 2007 and 2008 households and firms reduced desired expenditures. During the same period
inflation fell and unemployment rose.
a. The change in inflation, but not the change in unemployment is consistent with what a given
short-run Phillips curve implies.
b. The change in unemployment, but not the change in inflation is consistent with what a given
short-run Phillips curve implies.
c. Both the change in inflation and the change in unemployment are consistent with what a given
short-run Phillips curve implies.
d. Neither the change in inflation nor the change in unemployment are consistent with what a
given short-run Phillips curve implies.
69. According to the short-run Phillips curve, inflation
a. and unemployment would fall if the policymakers decreased the money supply.
b. would fall and unemployment would rise if policymakers decreased the money supply.
c. and unemployment would fall if the policymakers increased the money supply.
d. would fall and unemployment would rise if policymakers increased the money supply.