Use the figure to answer the following question(s).
Figure 9-3
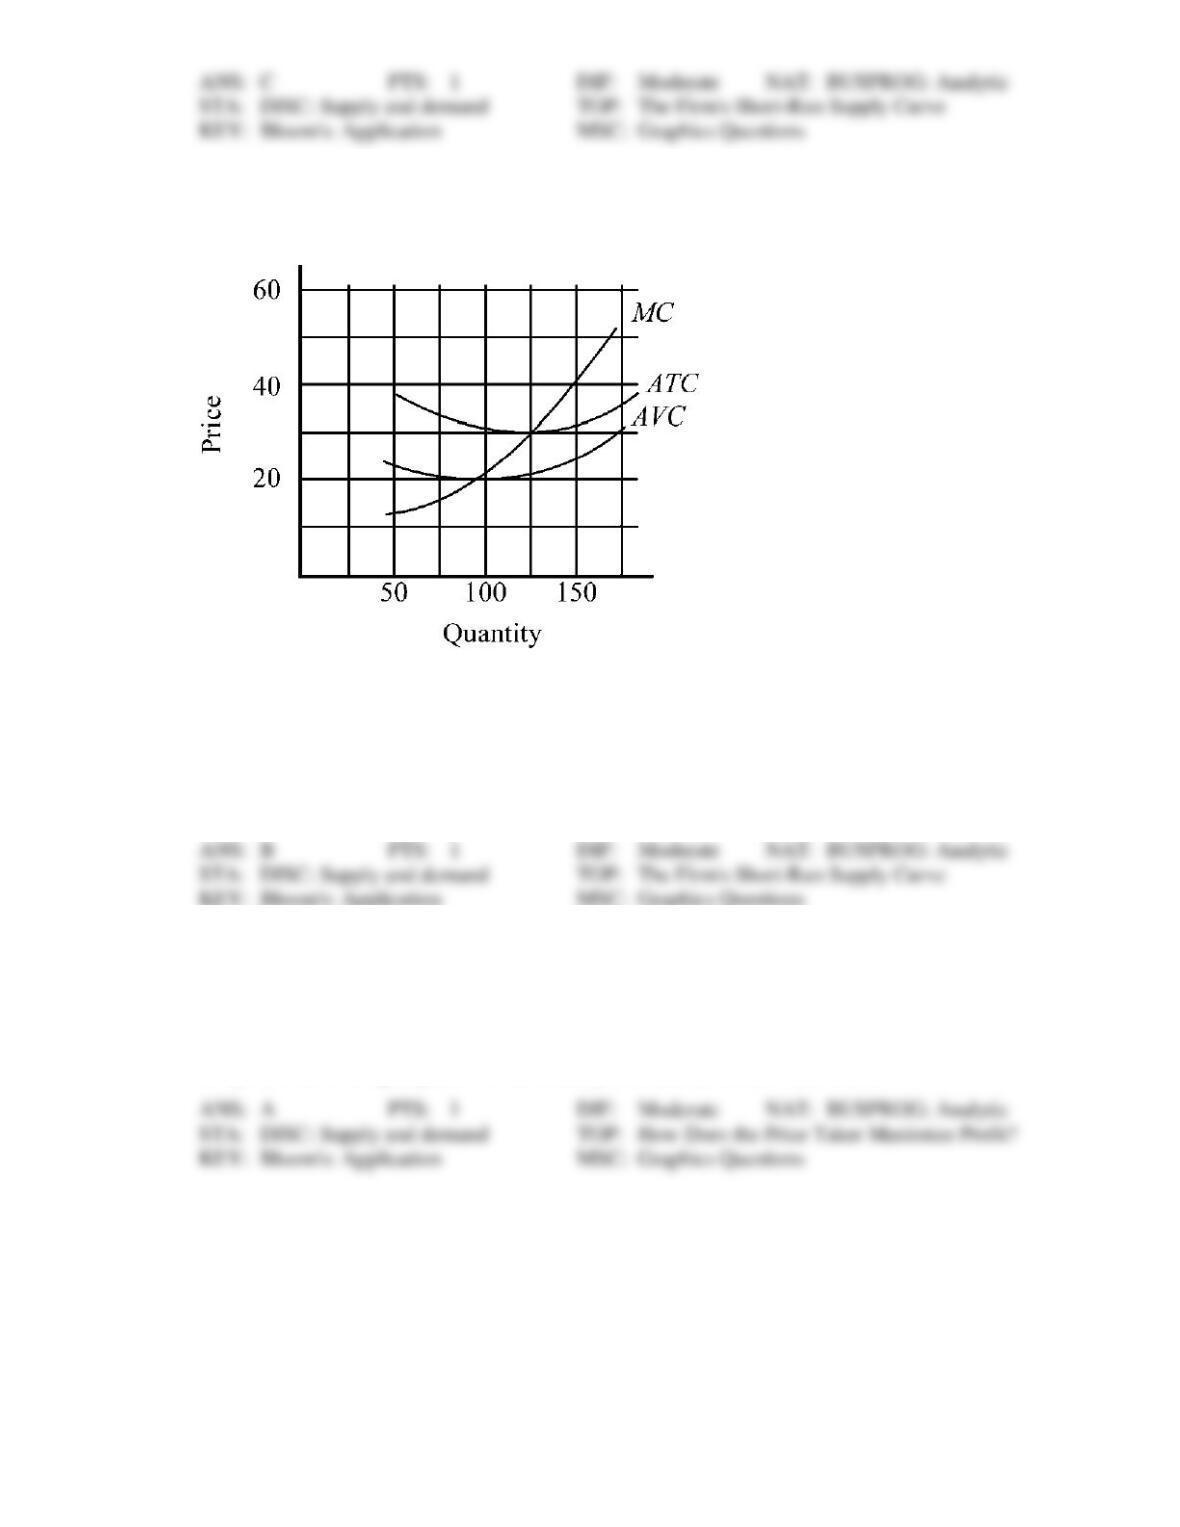
152. Figure 9-3 depicts the cost curves of a firm in a price-taker industry. At what output would the firm’s
per-unit cost be at a minimum?
a.
100
b.
125
c.
150
d.
an output greater than 150
153. For Figure 9-3, if the market price is $30, indicate the firm’s profit-maximizing output and maximum
profit.
a.
profit-maximizing output, 125; maximum profit, zero
b.
profit-maximizing output, 125; maximum profit, between $1,000 and $1,250
c.
profit-maximizing output, 150; maximum profit, $1,500
d.
profit-maximizing output, 150; maximum profit, between $1,250 and $1,500
Use the figure to answer the following question(s).
Figure 9-4
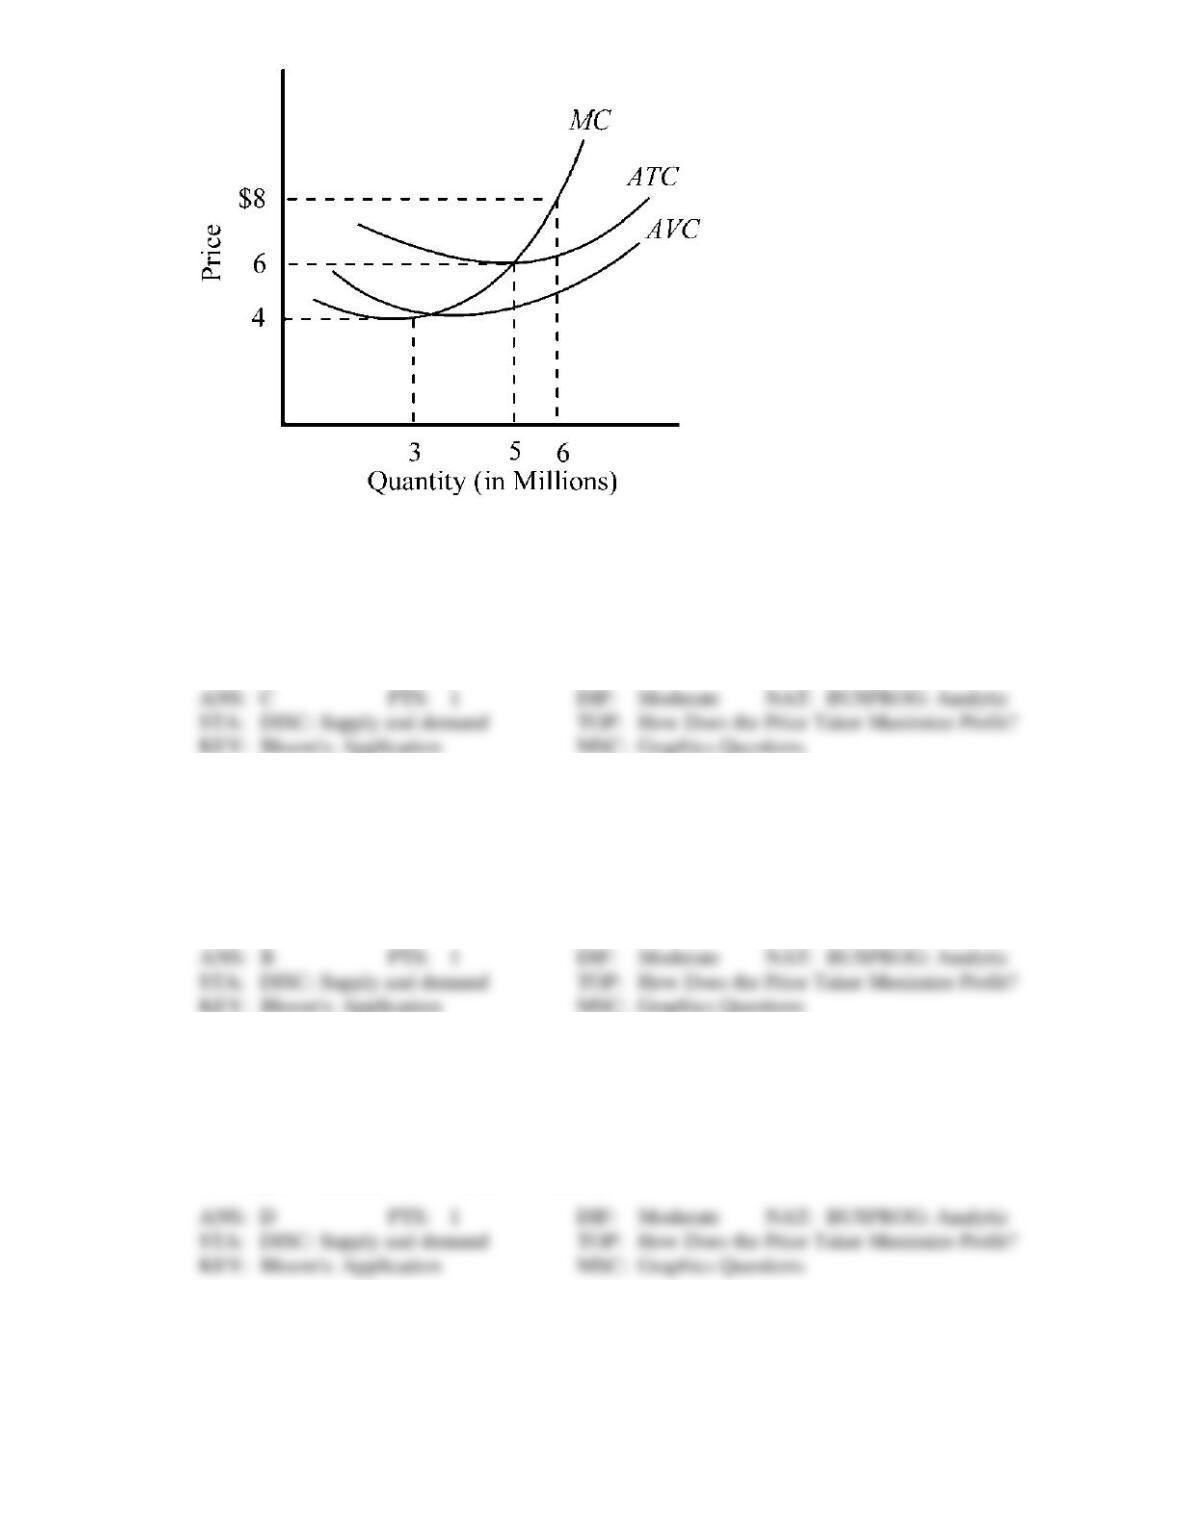
154. Figure 9-4 indicates the cost conditions for a firm operating in a price-taker market. If the market price
of the firm’s product is $6, what action will maximize the firm’s profit?
a.
go out of business since it cannot make a profit
b.
produce an output of 3 million
c.
produce an output of 5 million
d.
produce an output of 6 million
155. At the market price of $6 in Figure 9-4, indicate the firm’s total revenue and total cost at its
profit-maximizing level of output.
a.
total revenue, $30 million; total cost, $22.5 million (approx.)
b.
total revenue, $30 million; total cost, $30 million
c.
total revenue, $40 million; total cost, $30 million
d.
total revenue, $48 million; total cost, $38 million (approx.)
156. If the market price of the product in Figure 9-4 rose to $8, indicate the firm’s profit-maximizing output
and total revenue.
a.
output, 5 million; total revenue, $30 million
b.
output, 5 million; total revenue, $40 million
c.
output, 6 million; total revenue, $10 million (approx.)
d.
output, 6 million; total revenue, $48 million
Use the figure to answer the following question(s).
Figure 9-5
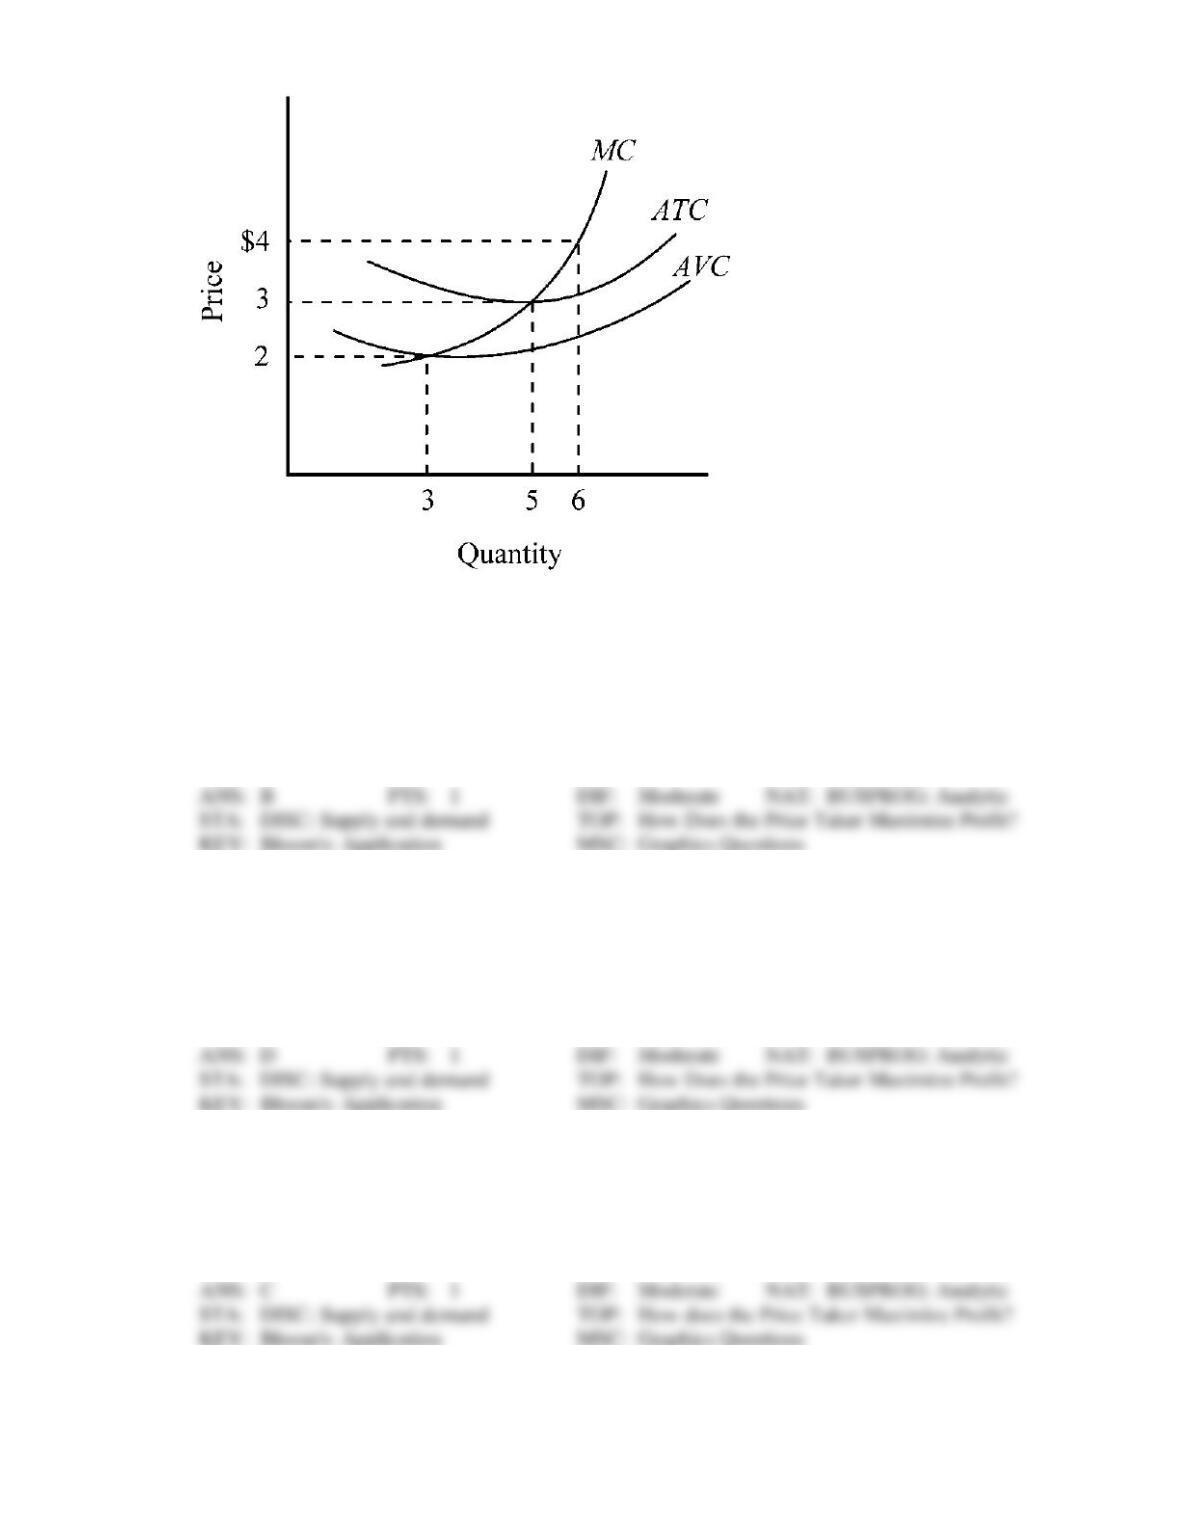
157. The cost conditions for a profit-maximizing firm operating in a price-taker market are indicated in
Figure 9-5. If the market price was $3, what output should the firm produce, and what would be the
firm’s maximum profit?
a.
output, 3; maximum profit, $3 loss
b.
output, 5; maximum profit, zero
c.
output, 5; maximum profit, $5
d.
output, 6; maximum profit, $6
158. If the market price in Figure 9-5 increases to $4, what output should the firm produce, and what would
be the firm’s maximum profit?
a.
output, 3; maximum profit, $3 loss
b.
output, 5; maximum profit, zero
c.
output, 5; maximum profit, slightly less than $5
d.
output, 6; maximum profit, slightly less than $6
159. If the market price in Figure 9-5 fell to $2.50, what should the firm do?
a.
raise its price
b.
shut down and wait for conditions to improve
c.
continue operating in the short run if it expects conditions to improve
d.
go out of business immediately

Use the figure to answer the following question(s).
Figure 9-6
160. The average total cost (ATC) and marginal costs (MC) of a firm producing in a price-taker industry are
depicted in Figure 9-6. If the current market price of the firm’s product is $15, what output should this
firm produce?
a.
10
b.
15
c.
20
d.
25
161. If the market price in Figure 9-6 increases to $20, what should the firm do?
a.
produce an output of 15
b.
expand output to 20
c.
expand output to 25
d.
increase its price to $25
162. When the market price in Figure 9-6 is $20, the firm’s maximum profit will be approximately
a.
zero.
b.
$3.
c.
$60.
d.
$400.
Use the figure to answer the following question(s).
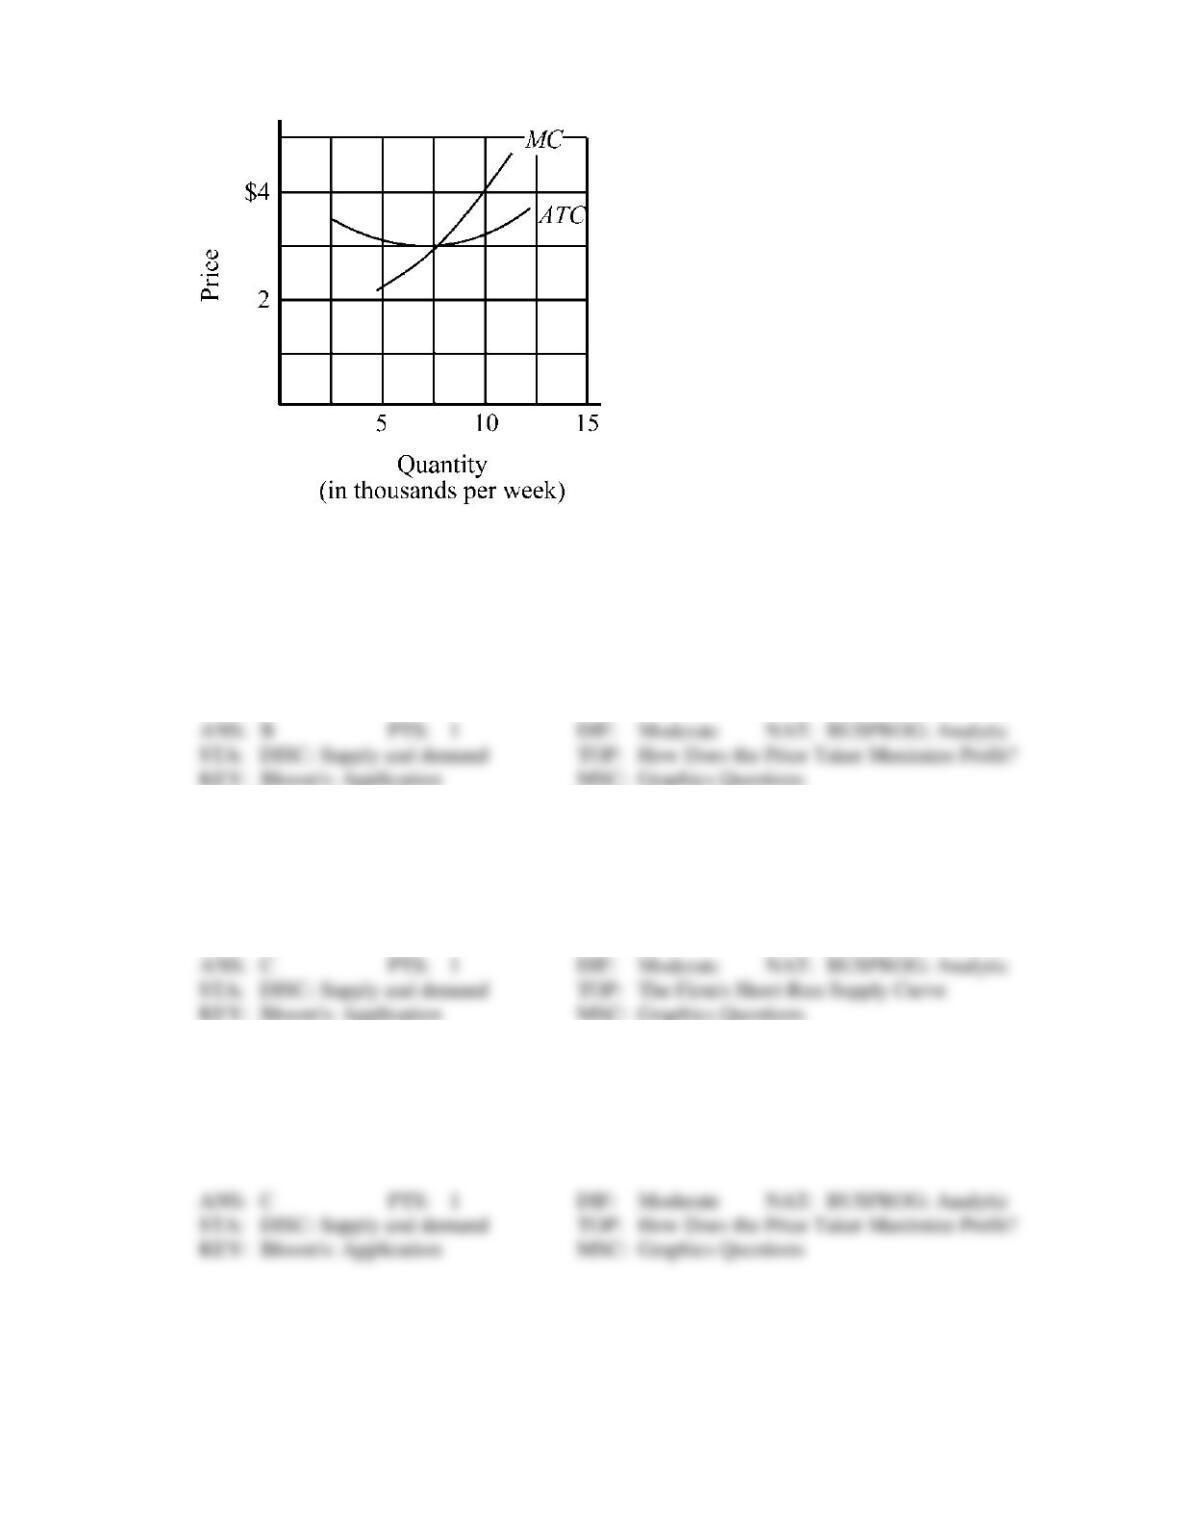
Figure 9-7
163. The average total cost (ATC) and marginal costs (MC) of a firm producing in a price-taker industry are
depicted in Figure 9-7. If the current market price of the firm’s product is $3, what output should this
firm produce per week?
a.
5,000
b.
7,500
c.
10,000
d.
12,500
164. If the market price in Figure 9-7 increases to $4, what should the firm do?
a.
produce 5,000 per week
b.
produce 7,500 per week
c.
produce 10,000 per week
d.
increase its price to $5
165. When the market price in Figure 9-7 is $4, the firm’s maximum weekly profit will be approximately
a.
zero.
b.
$40.
c.
$6,000.
d.
$40,000.
Use the figure to answer the following question(s).
Figure 9-8
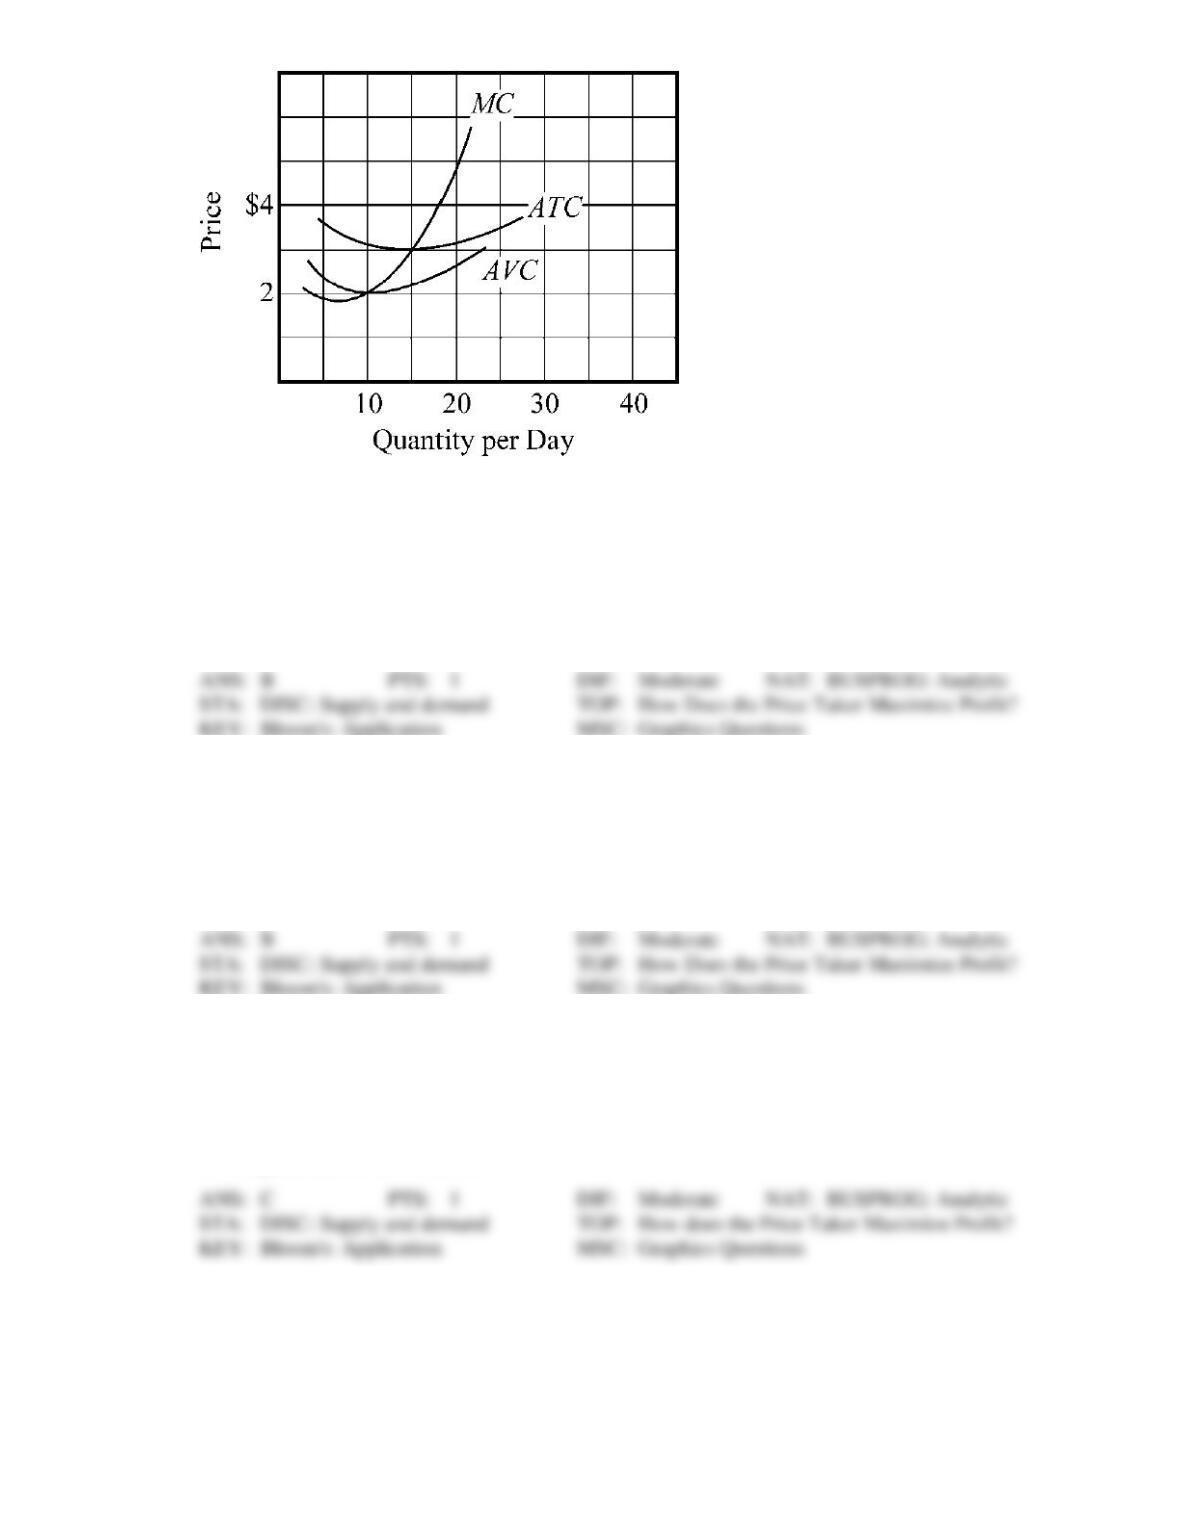
166. The average total cost (ATC) and marginal costs (MC) of a firm producing in a price-taker industry are
depicted in Figure 9-8. If the current market price of the firm’s product is $3, what output should this
firm produce per day?
a.
10
b.
15
c.
20
d.
25
167. At the market price of $3 in Figure 9-8, indicate the firm’s total revenue and total cost at its
profit-maximizing level of output.
a.
total revenue, $45; total cost, $37 (approx.)
b.
total revenue, $45; total cost, $45
c.
total revenue, $60; total cost, $45
d.
total revenue, $80; total cost, $65 (approx.)
168. If the market price in Figure 9-8 increases to $4, indicate the firm’s profit-maximizing output and total
revenue.
a.
output, 15; total revenue, $45
b.
output, 15; total revenue, $60
c.
output, 17; total revenue, $68 (approx.)
d.
output, 20; total revenue, $80
Use the figure to answer the following question(s).
Figure 9-9
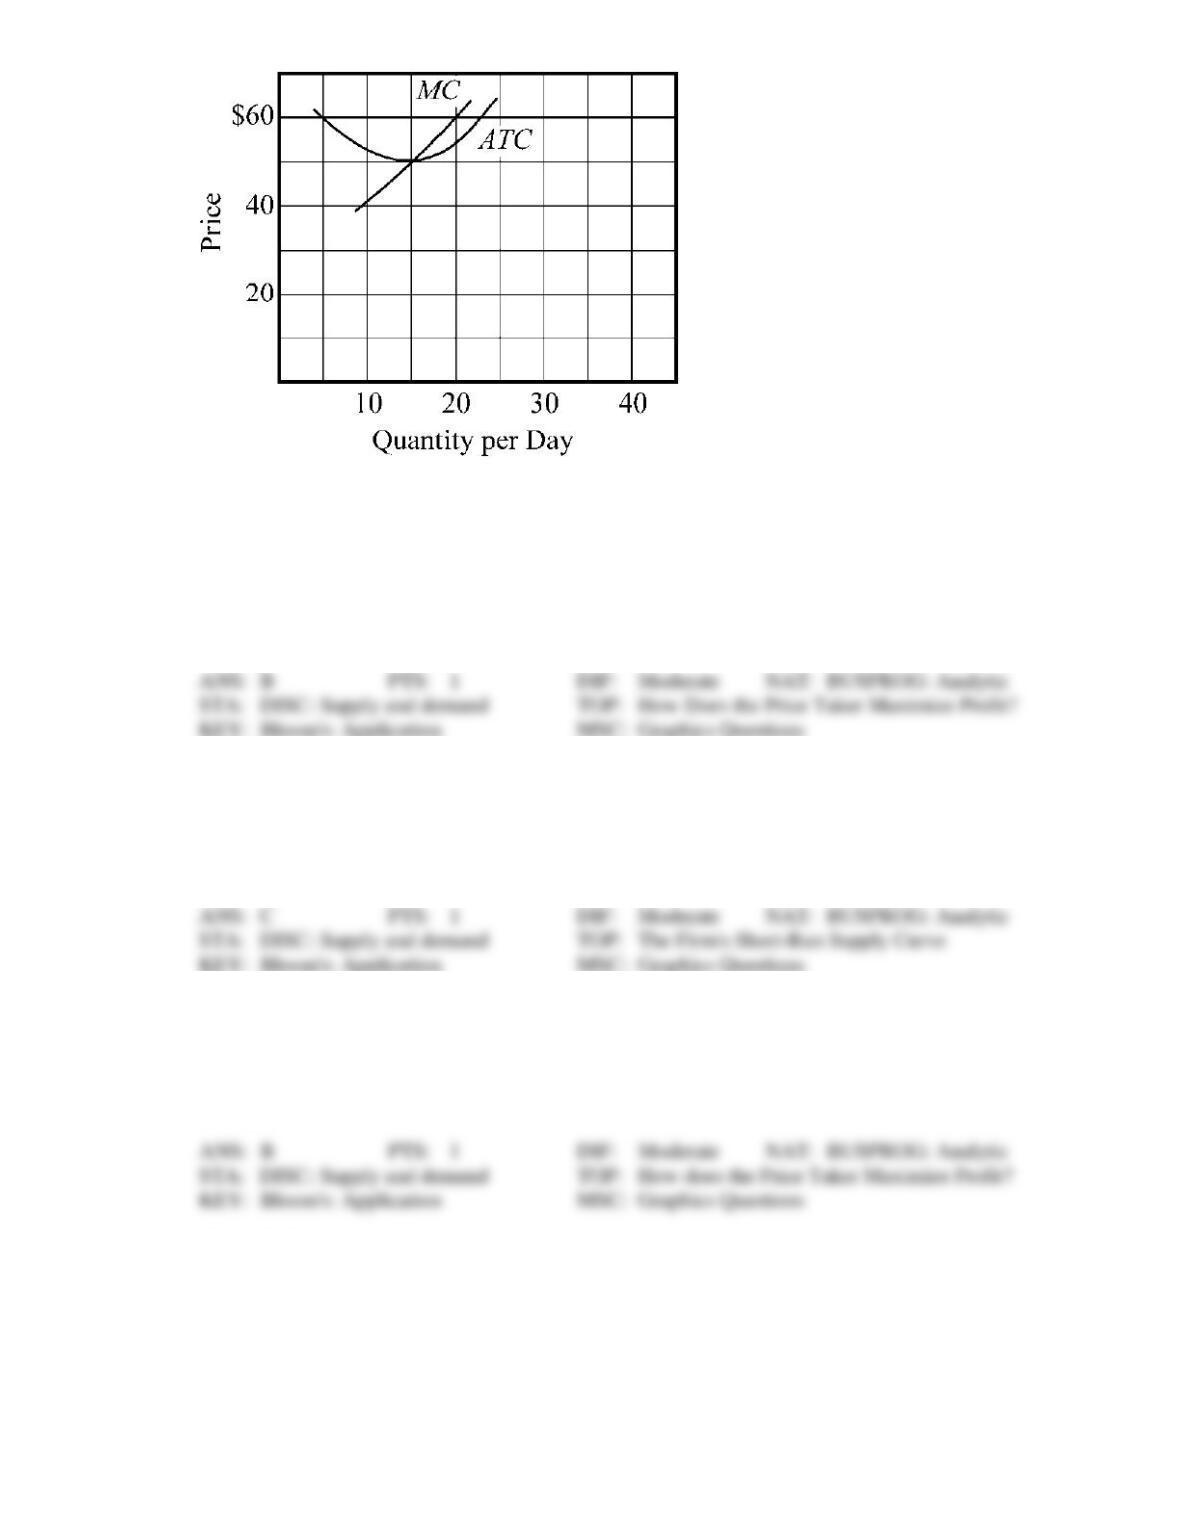
169. The average total cost (ATC) and marginal costs (MC) of a firm producing in a price-taker industry are
depicted in Figure 9-9. If the current market price of the firm’s product is $50, what output should this
firm produce per day?
a.
10
b.
15
c.
20
d.
25
170. If the market price in Figure 9-9 increases to $60, what should the firm do?
a.
produce 10 per day
b.
produce 15 per day
c.
produce 20 per day
d.
increase its price to $70
171. When the market price is $60 in Figure 9-9, the firm’s maximum daily profit will be approximately
a.
zero.
b.
$100.
c.
$900.
d.
$1,200.
Figure 9-10
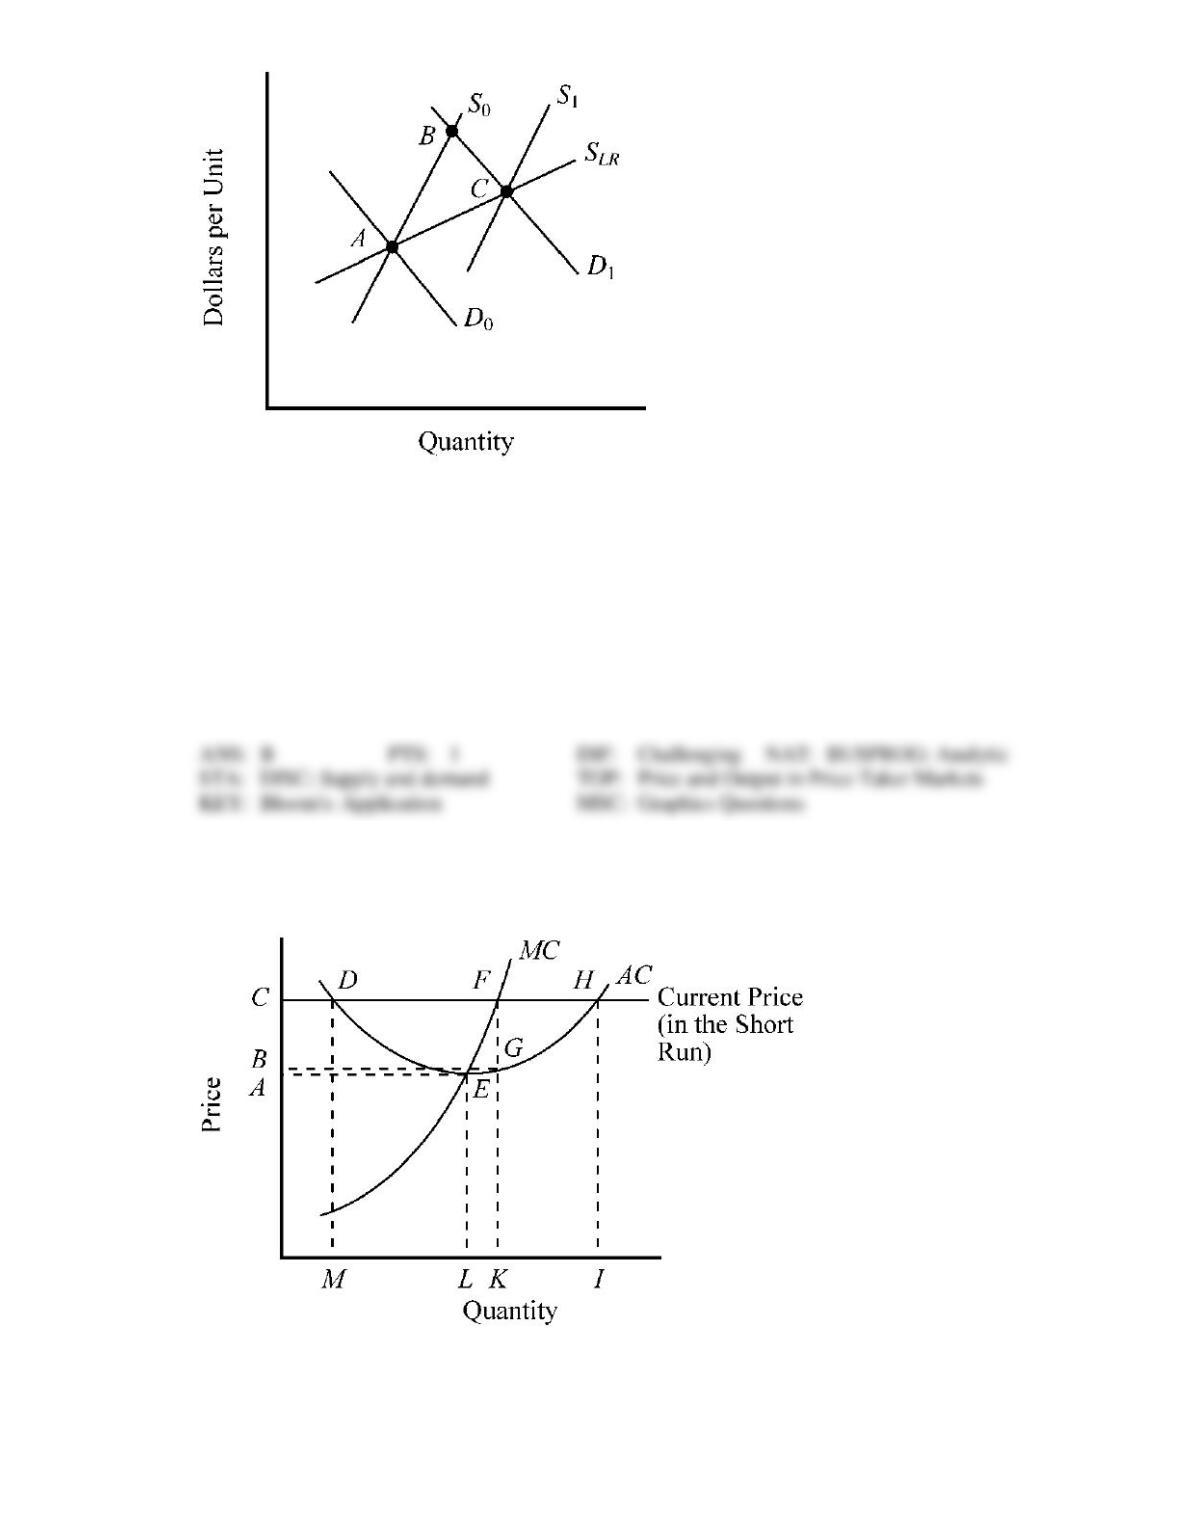
172. In Figure 9-10, the movement from points A to B to C can best be explained by which of the following
factors?
a.
a decrease in demand, followed by the entry of new firms and an expansion in supply in a
constant cost industry.
b.
an increase in demand, followed by the entry of new firms and an expansion in supply in
an increasing cost industry.
c.
a decrease in demand, followed by the exit of firms and a decline in supply in an
increasing cost industry.
d.
an increase in demand, followed by the exit of firms and a decline in supply in a constant
cost industry.
Use the figure to answer the following question(s).
Figure 9-11
173. If the current market price for the firm depicted in Figure 9-11 is A, given the firm’s cost conditions,
which output should it produce?
a.
OM
b.
OL
c.
OK
d.
OI
174. Which of the following represents the firm’s total cost of producing the profit-maximizing output in
Figure 9-11?
a.
OCFK
b.
OBGK
c.
OAEL
d.
OCHI
175. Which of the following indicates the firm’s profit (or loss) at the profit-maximizing output in Figure
9-11?
a.
profit BCFG
b.
profit OCDM
c.
zero economic profit
d.
loss AEFC
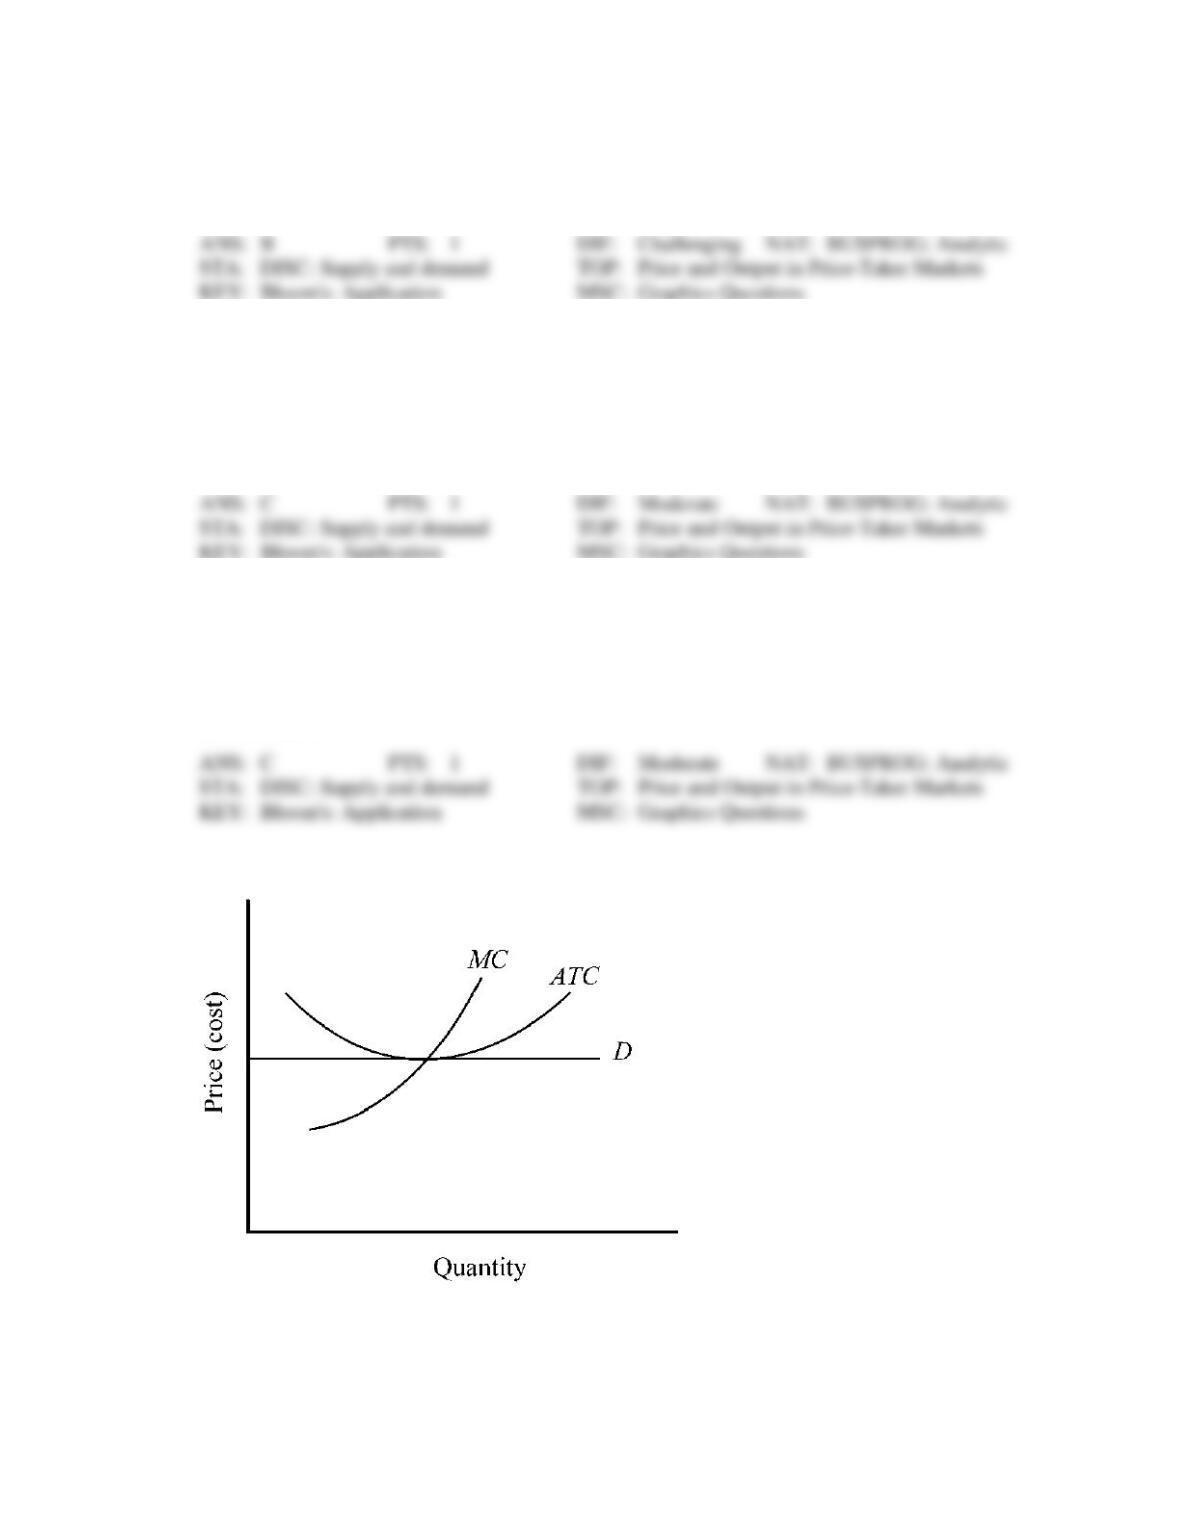
Figure 9-12
176. Figure 9-12 illustrates a
a.
competitive price-taker firm that is earning economic profit.
b.
competitive price-taker firm that is only able to break even when it is maximizing
economic profit.
c.
firm that should shut down immediately.
d.
competitive price-taker firm that is making economic losses.
The graph below depicts the cost structure for a firm in a competitive market.
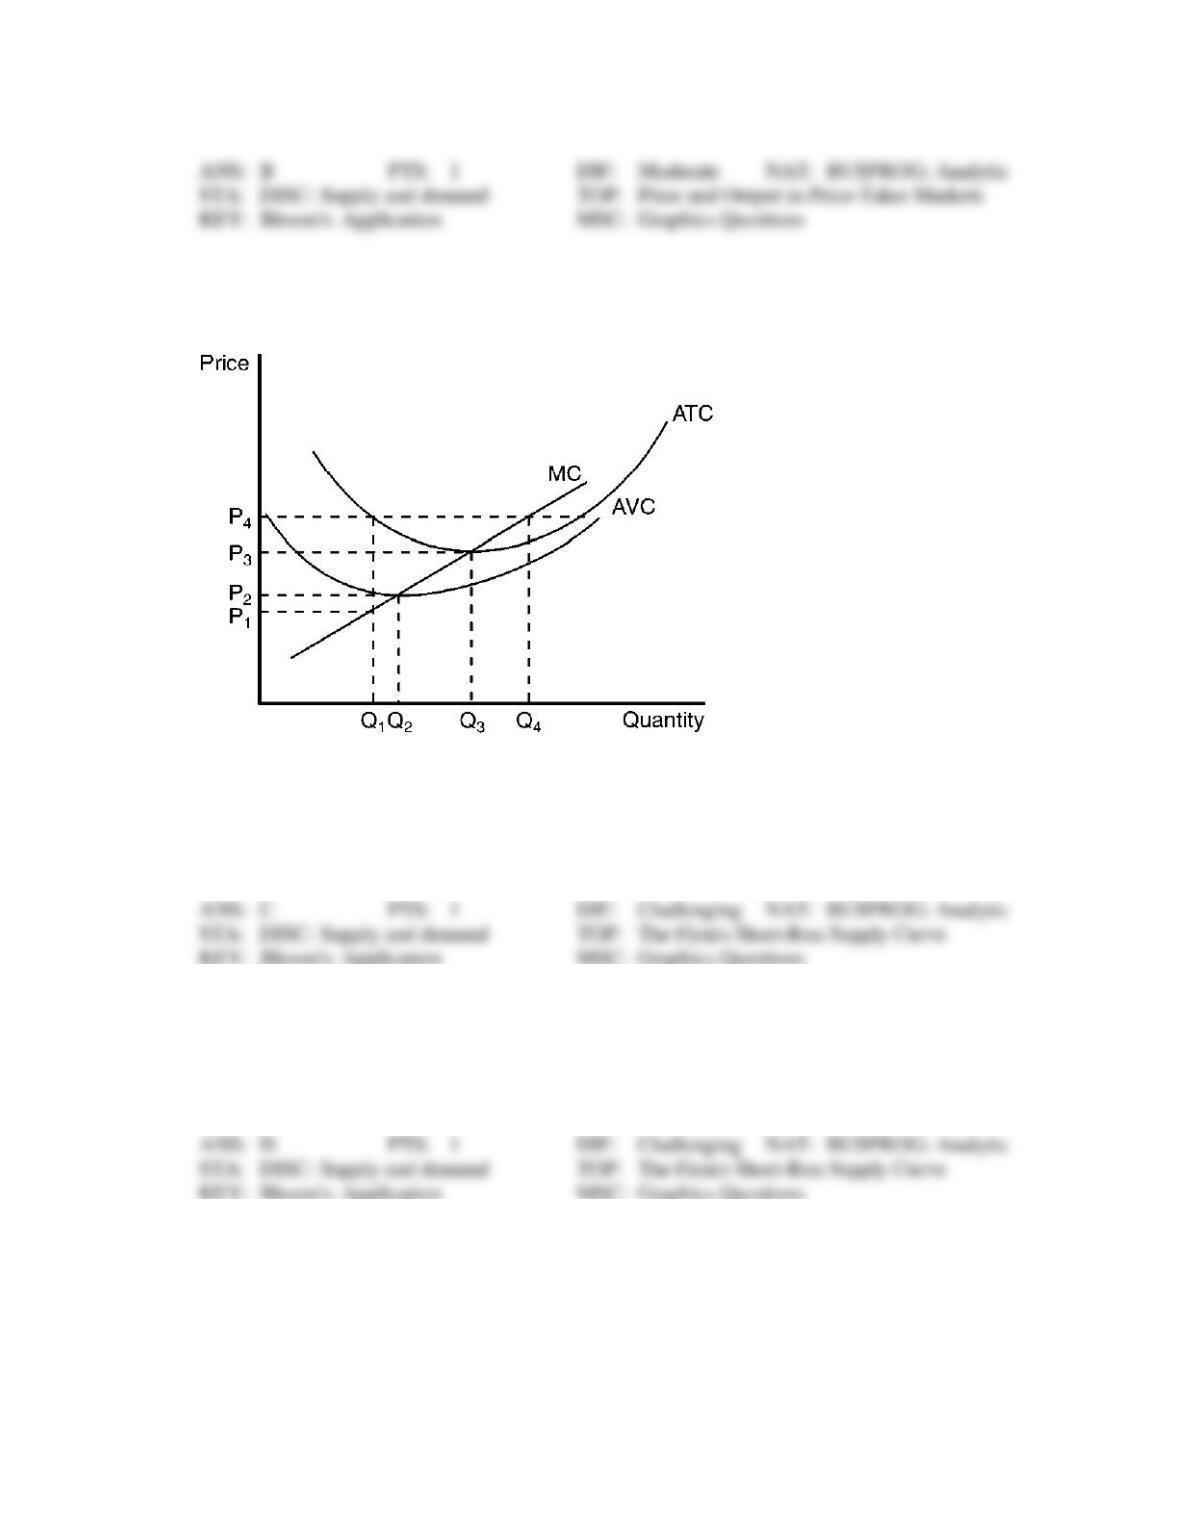
Figure 9-13
177. Refer to Figure 9-13. When price rises from P2 to P3, the firm finds that
a.
marginal cost exceeds marginal revenue at a production level of Q2.
b.
if it produces at output level Q3 it will earn a positive profit.
c.
expanding output to Q4 would leave the firm with losses.
d.
it could increase profits by lowering output from Q3 to Q2.
178. Refer to Figure 9-13. When price falls from P3 to P1, the firm finds that
a.
fixed cost is higher at a production level of Q1 than it is at Q3.
b.
it should produce Q1 units of output.
c.
it should produce Q3 units of output.
d.
it should shut down immediately.
179. Refer to Figure 9-13. When price rises from P3 to P4, the firm finds that
a.
fixed costs are lower at a production level of Q4.
b.
it can earn a positive profit by increasing production to Q4.
c.
profit is still maximized at a production level of Q3.
d.
average revenue exceeds marginal revenue at a production level of Q4.
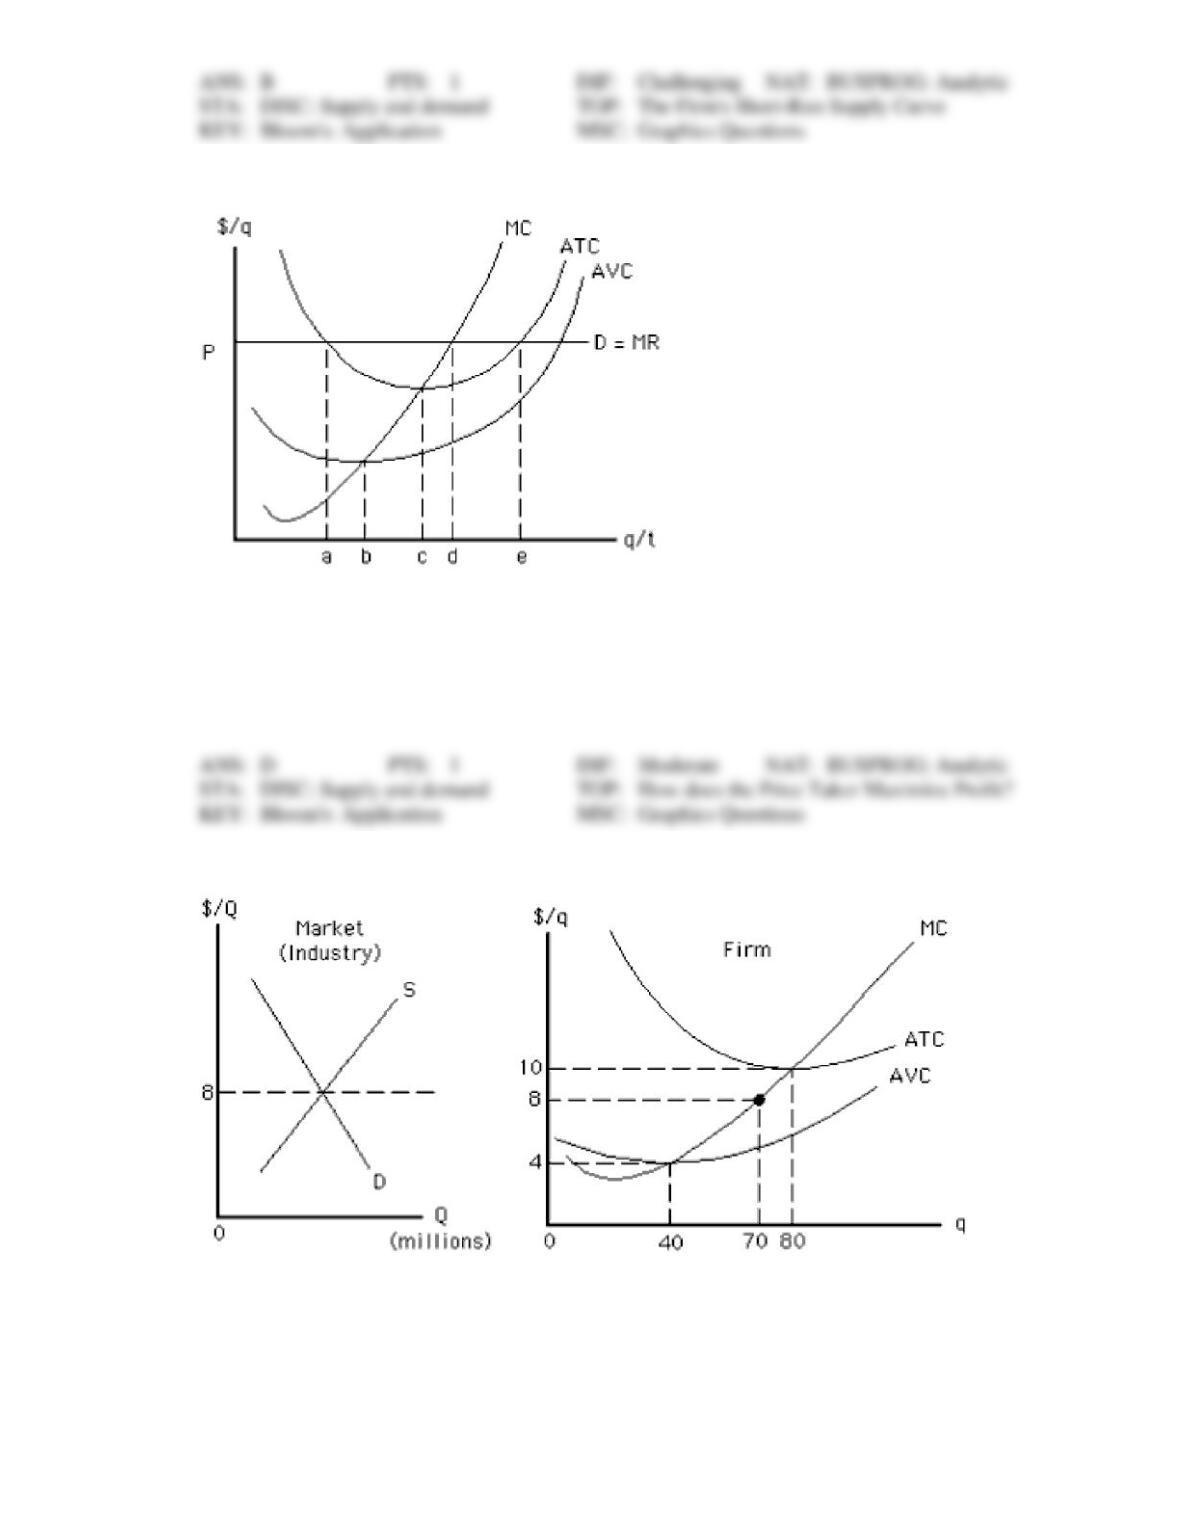
Figure 9-14
180. Consider Figure 9-14. At which quantity will this firm maximize profit?
a.
point a
b.
point b
c.
point c
d.
point d
e.
point e
Figure 9-15
181. At which price and quantity is profit maximized for the competitive price-taker firm represented in
Figure 9-15?
a.
$40 and 80
b.
$8 and 70
c.
$4 and 40
d.
$40 and 70
e.
$8 and zero output
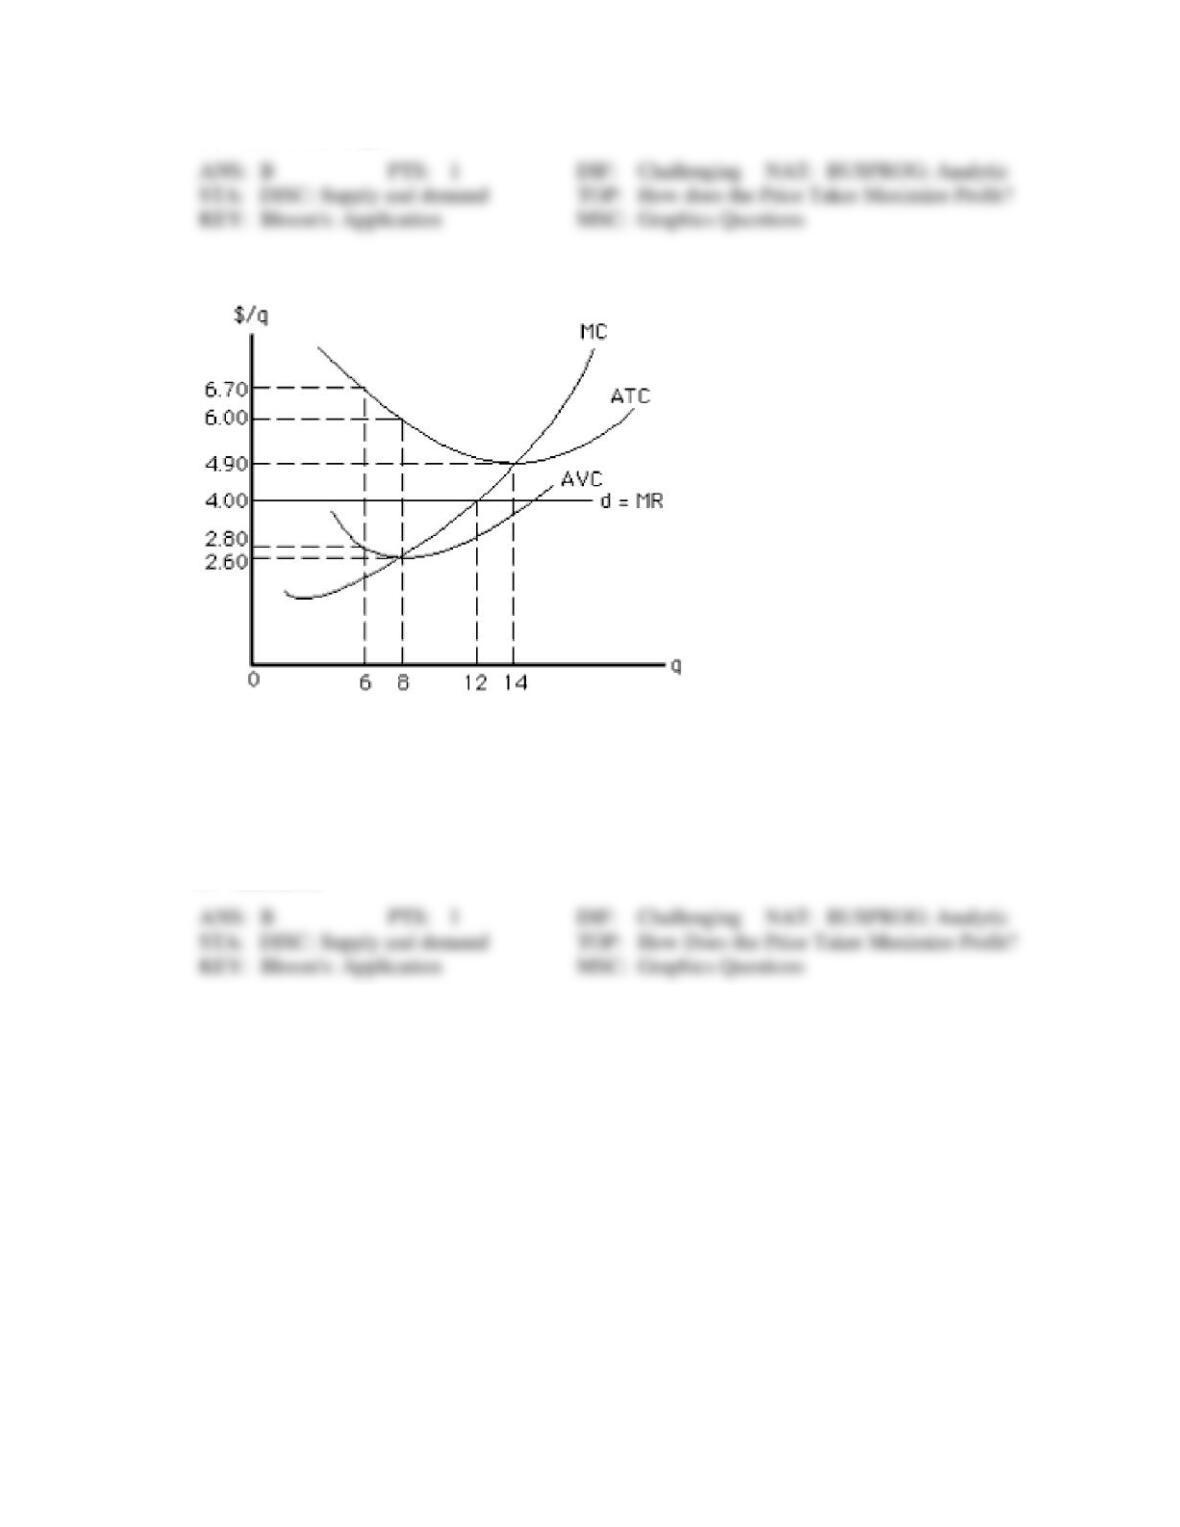
Figure 9-16
182. If the price-taker firm in Figure 9-16 is currently producing 6 units, then to maximize profit in the
short run, it should
a.
keep producing 6 units
b.
increase production to 12 units
c.
increase production to 14 units
d.
increase production to 8 units
e.
shut down
Figure 9-17
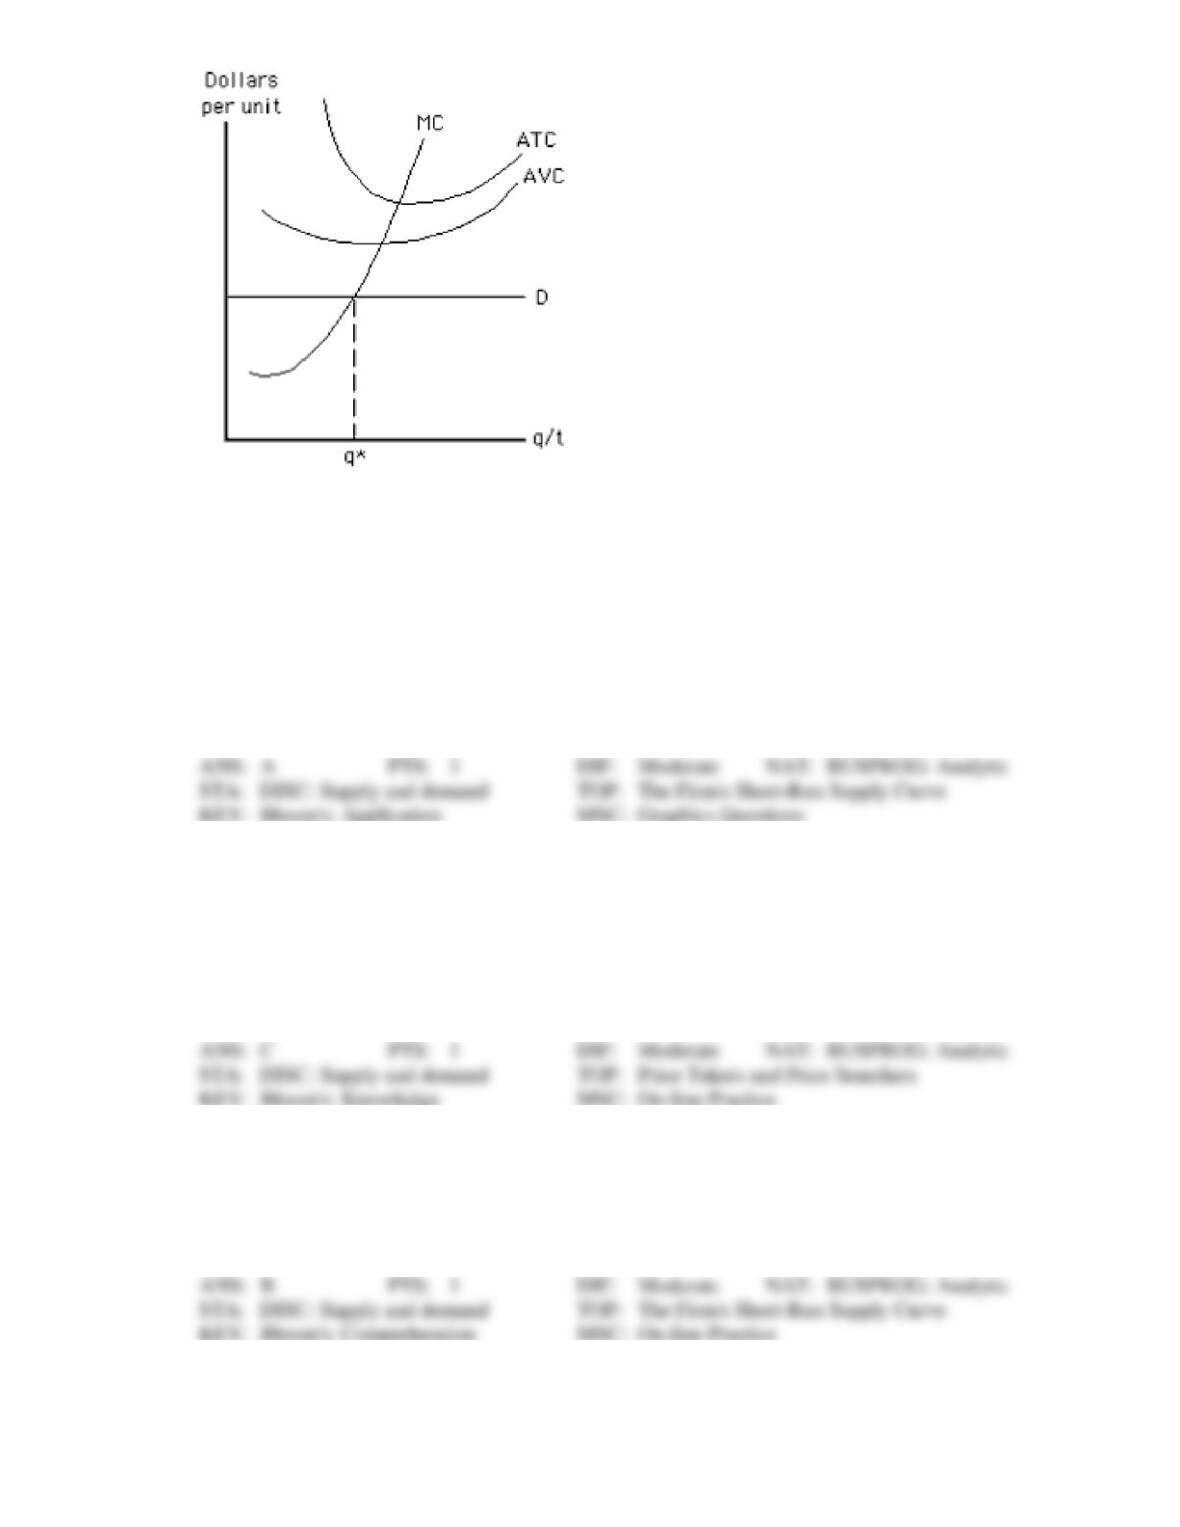
183. Which of the following statements about the competitive price-taker firm represented in Figure 9-17 is
false?
a.
Short-run losses are minimized at output level q* because MR = MC there.
b.
The firm should shut down in the short run.
c.
If the firm shuts down in the short run, it will suffer a loss equal to the amount of its fixed
cost.
d.
If the firm operates in the short run, it will suffer a loss greater than the amount of its fixed
cost.
e.
If the firm operates in the short run, it will suffer a loss equal to the amount of its fixed
cost plus the uncovered portion of its variable cost.
184. The dynamic process of competition
a.
provides profit-seeking sellers with little incentive to heed consumer preferences.
b.
was shown by Adam Smith to be a major source of economic inefficiency.
c.
provides consumers with alternative suppliers and thus a mechanism with which they can
discipline sellers.
d.
will permit business decision makers to earn long-run economic profit unless they are
regulated by government officials.
185. In the short run, a profit-maximizing price taker will expand output as long as the market price exceeds
a.
average variable cost.
b.
marginal cost.
c.
average total cost.
d.
average fixed cost.