
Chapter 21: Quality Control – Quiz A Name ___________________
21.1.5 Understand concepts and terms involved with quality control.
1. Machine oil is used by clothing manufacturers to lubricate and protect sewing
machines. A company that produces machine oil must ensure that the viscosity of its
product meets customer requirements. Consequently, the viscosity of every batch of
oil produced is measured. Suppose that the process mean is 101 cP and the process
standard deviation is 1.50 cP.
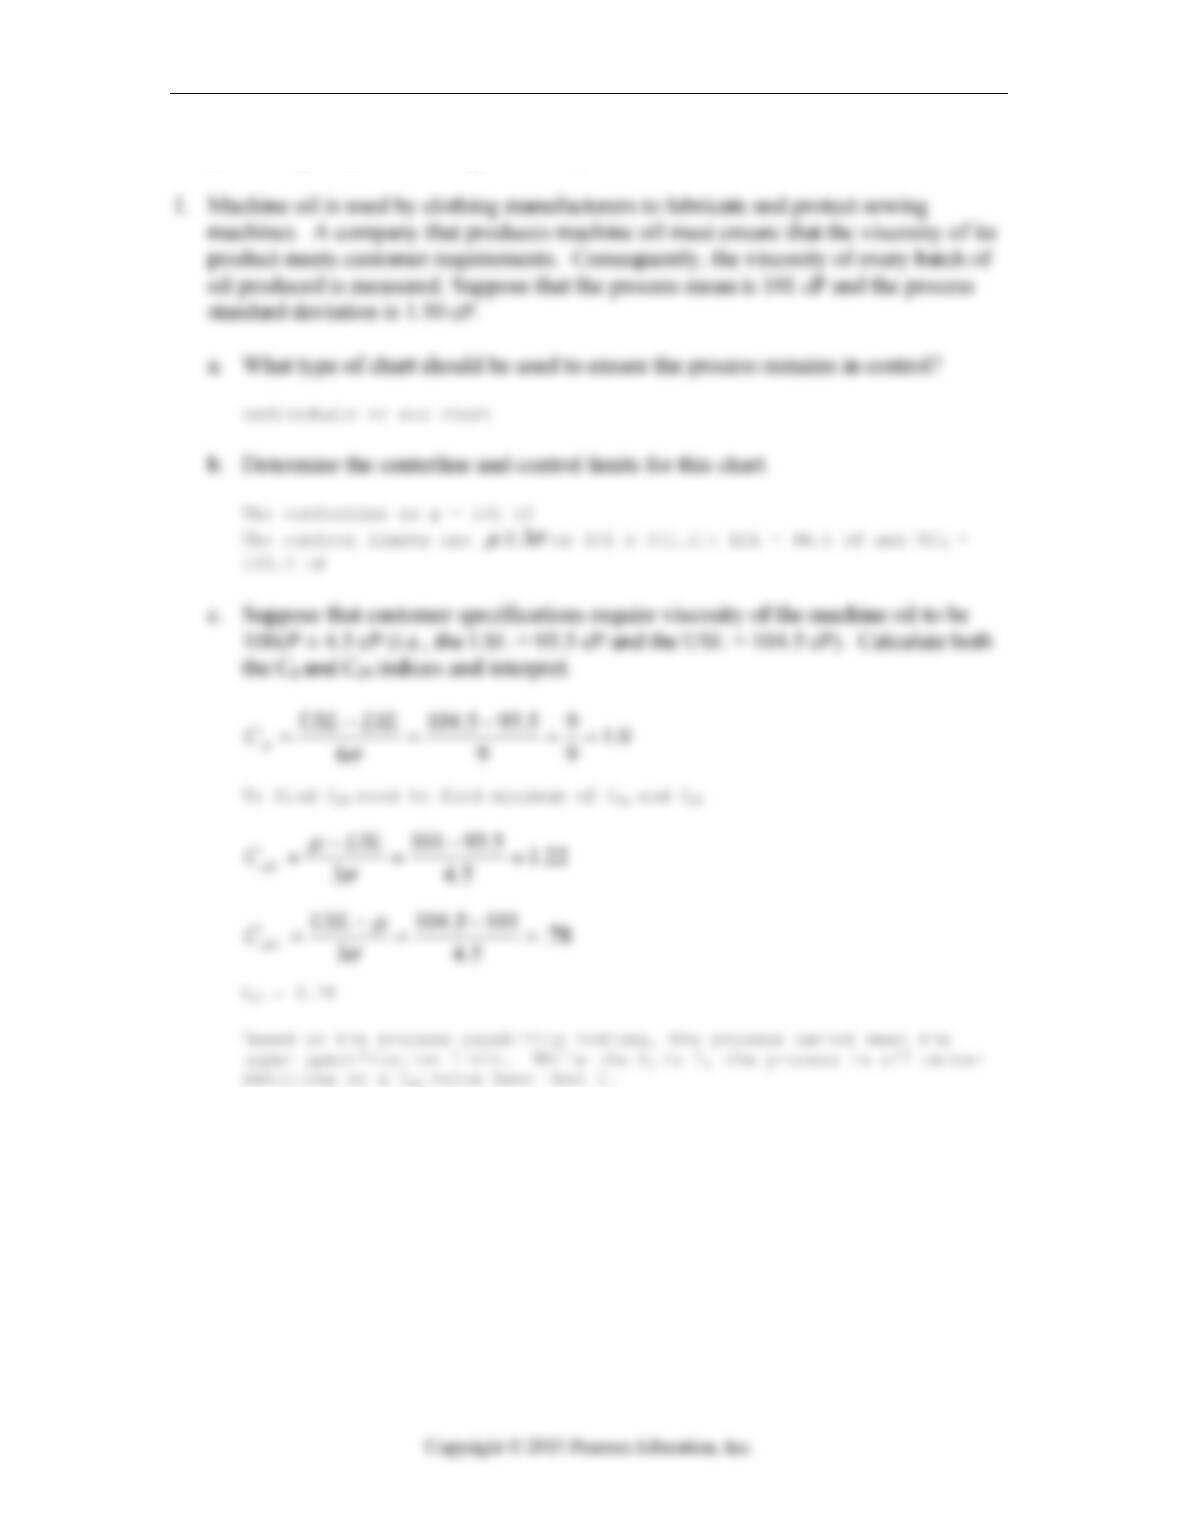
a. What type of chart should be used to ensure the process remains in control?
b. Determine the centerline and control limits for this chart.
c. Suppose that customer specifications require viscosity of the machine oil to be
100cP ± 4.5 cP (i.e., the LSL = 95.5 cP and the USL = 104.5 cP). Calculate both
the Cp and Cpk indices and interpret.
21.3.1 Create x-bar and R charts
2. A company that manufactures health food snacks produces low sodium rice chips. To
monitor the process for sodium levels, chips are selected periodically and the amount
of sodium (mg) measured. For each of thirty samples consisting of 8 chips, the mean
and range in sodium content is determined. The average of the means across all
samples is 55 mg and the average range is 2.2 mg.
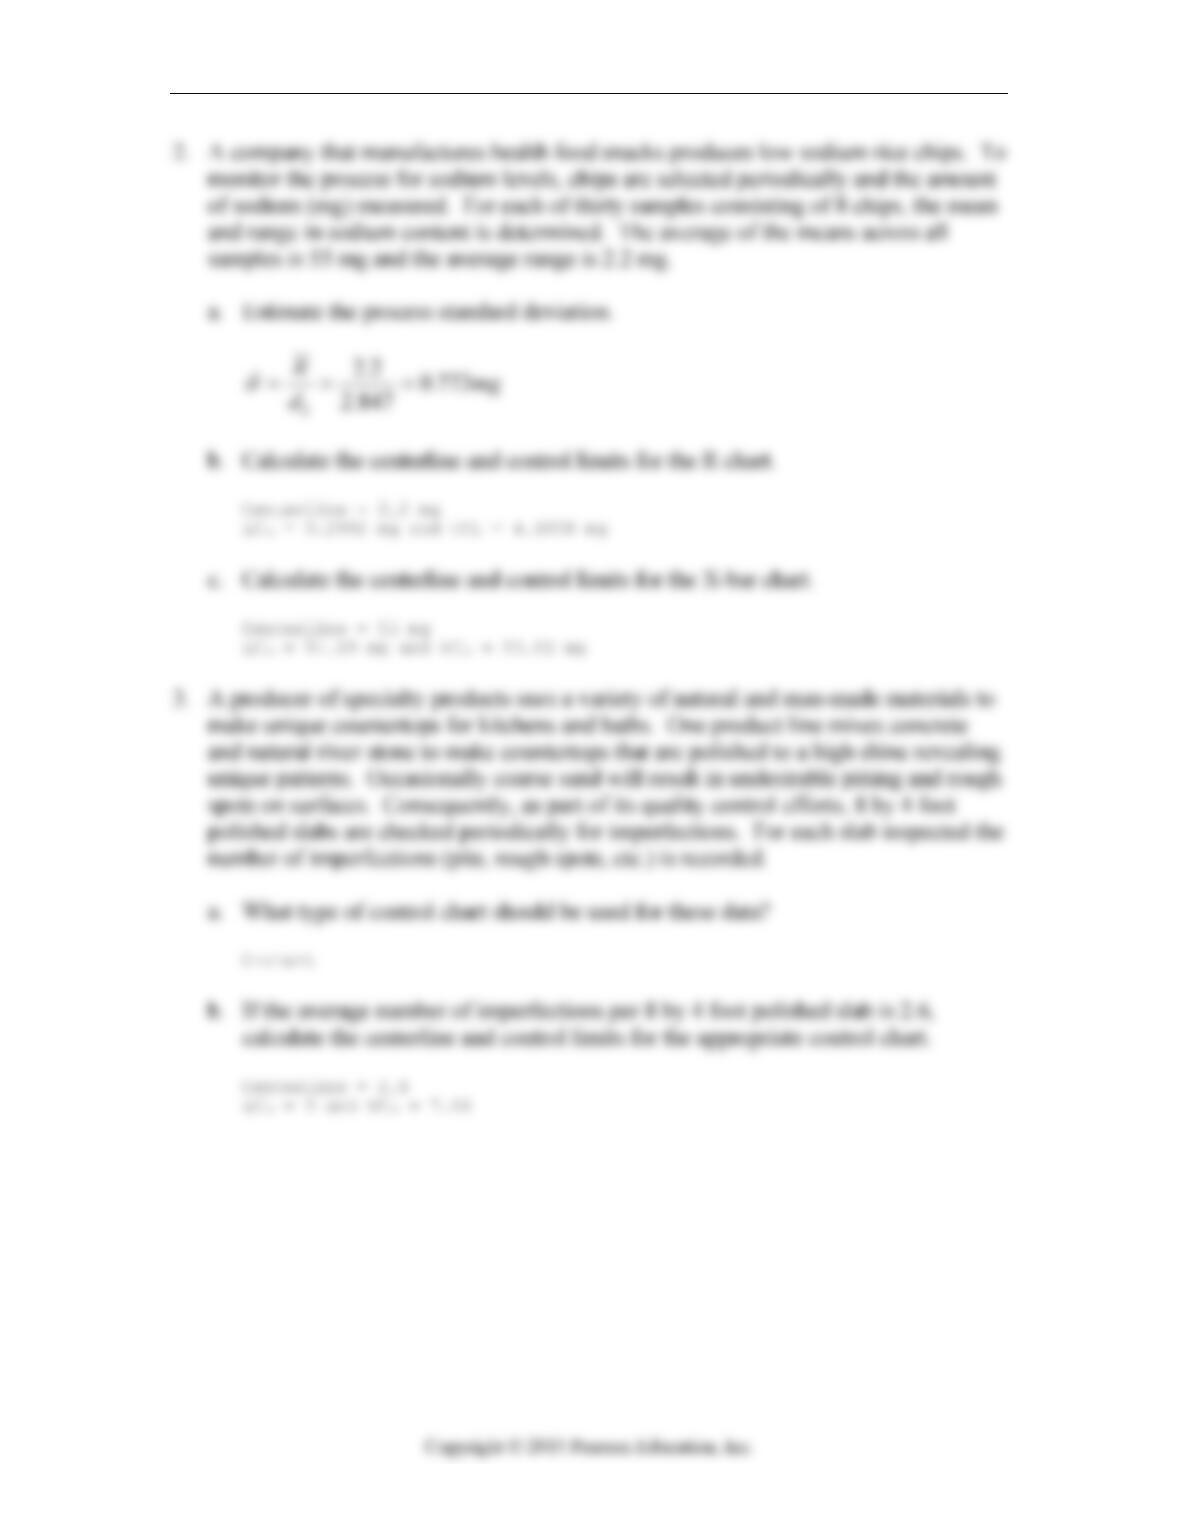
a. Estimate the process standard deviation.
b. Calculate the centerline and control limits for the R chart.
c. Calculate the centerline and control limits for the X-bar chart.
21.5.5 Understand concepts and terms involved with quality control.
3. A producer of specialty products uses a variety of natural and man-made materials to
make unique countertops for kitchens and baths. One product line mixes concrete
and natural river stone to make countertops that are polished to a high shine revealing
unique patterns. Occasionally coarse sand will result in undesirable pitting and rough
spots on surfaces. Consequently, as part of its quality control efforts, 8 by 4 foot
polished slabs are checked periodically for imperfections. For each slab inspected the
number of imperfections (pits, rough spots, etc.) is recorded.
a. What type of control chart should be used for these data?
b. If the average number of imperfections per 8 by 4 foot polished slab is 2.6,
calculate the centerline and control limits for the appropriate control chart.

21-2 Chapter 21 Quality Control
21.4.2 Create p charts.
4. An importer of decorative ceramic tile samples 50 tiles each day from incoming
shipments. Some tiles are cracked or broken before or during transit, rendering them
useless scrap. Sampling from incoming shipments for 30 days reveals that a total of
250 tiles are cracked or broken.
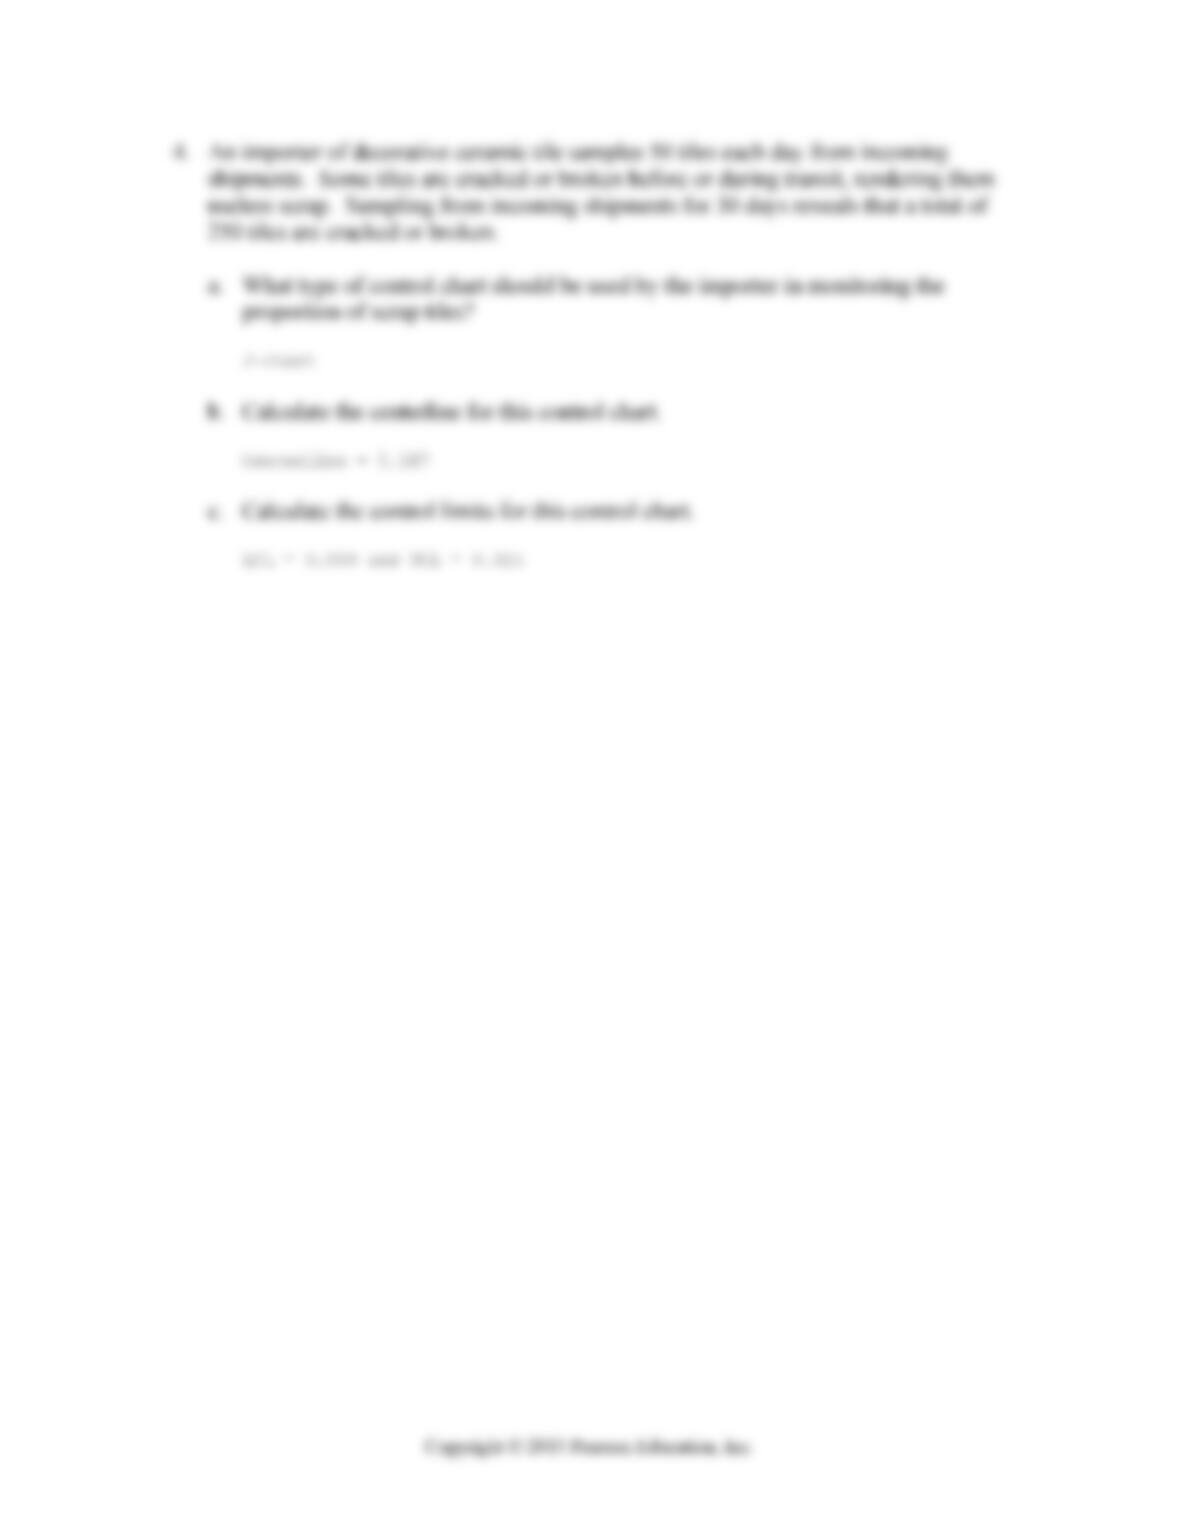
a. What type of control chart should be used by the importer in monitoring the
proportion of scrap tiles?
b. Calculate the centerline for this control chart.
c. Calculate the control limits for this control chart.
Quiz A 21-3
Chapter 21: Quality Control – Quiz A – Key
21-4 Chapter 21 Quality Control
Quiz A 21-5

21-6 Chapter 21 Quality Control
Chapter 21: Quality Control – Quiz B Name _________________________
21.2.5 Understand concepts and terms involved with quality control
1. By design, a required dimension on a part is 0.575 inches plus or minus 0.008 inches.
Assume that the process producing this part is stable with a mean of 0.579 inches and
standard deviation of 0.002 inches.
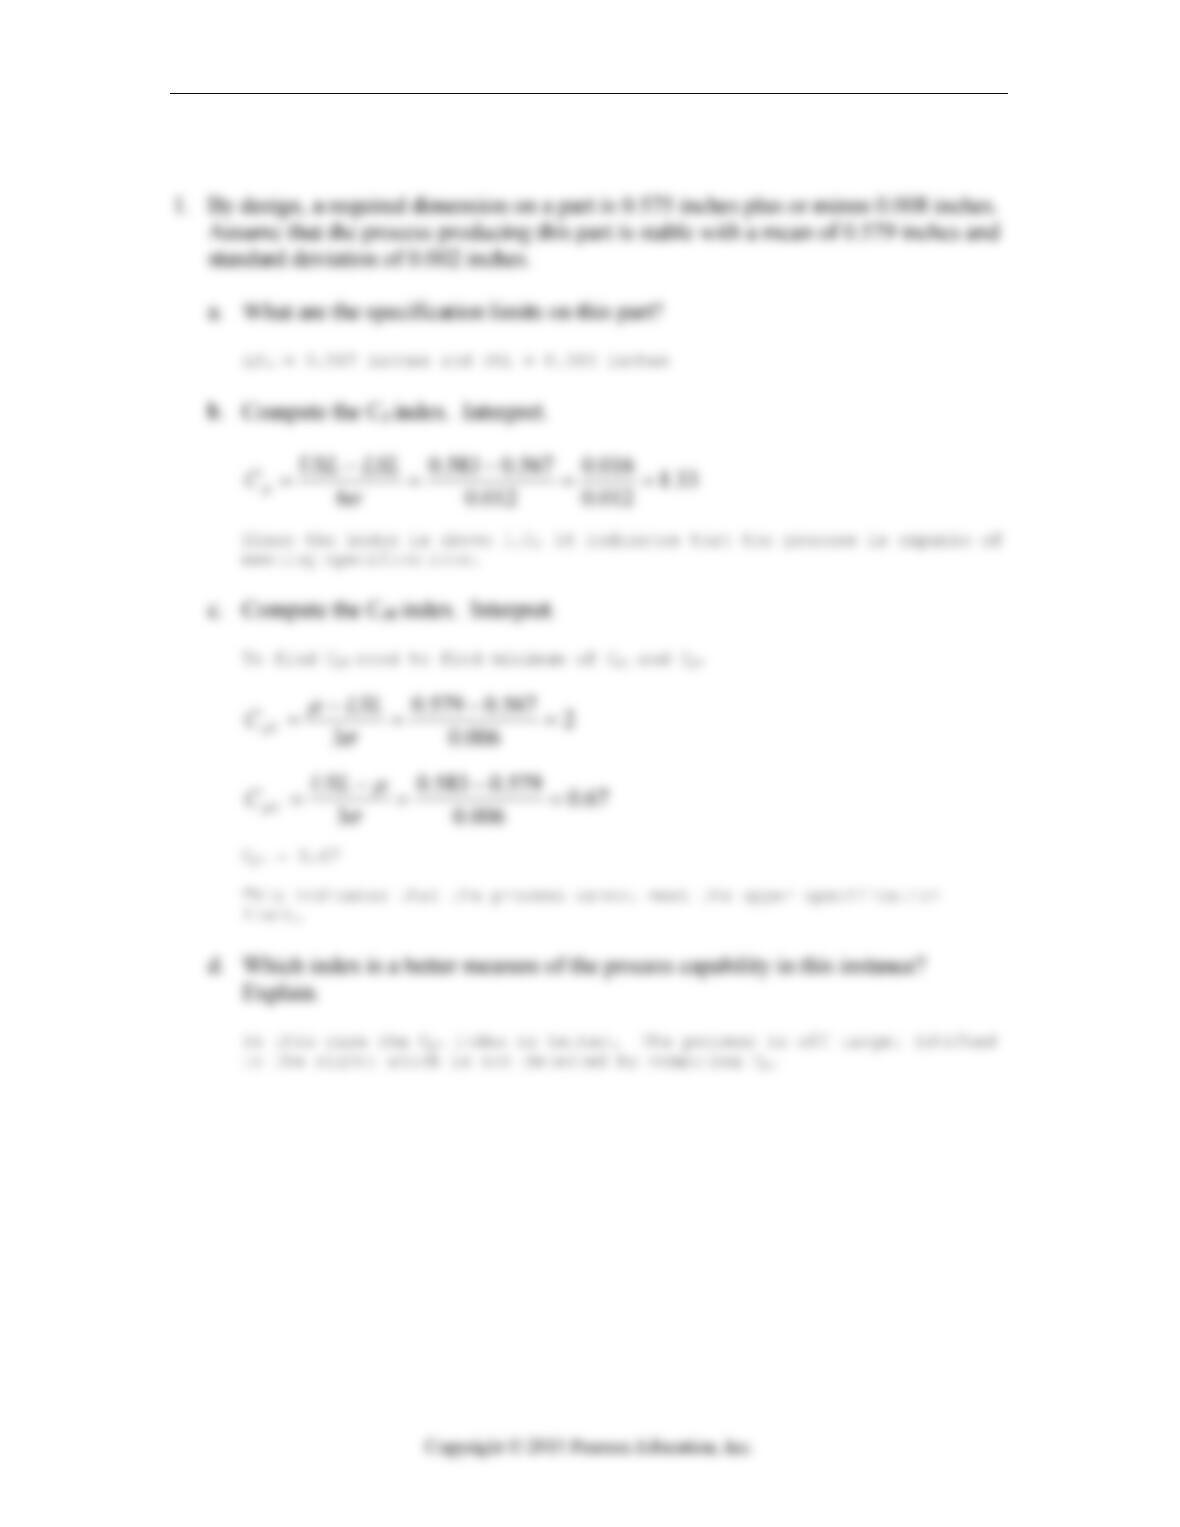
a. What are the specification limits on this part?
b. Compute the Cp index. Interpret.
c. Compute the Cpk index. Interpret.
d. Which index is a better measure of the process capability in this instance?
Explain.
21.3.1 Create x-bar and R charts.
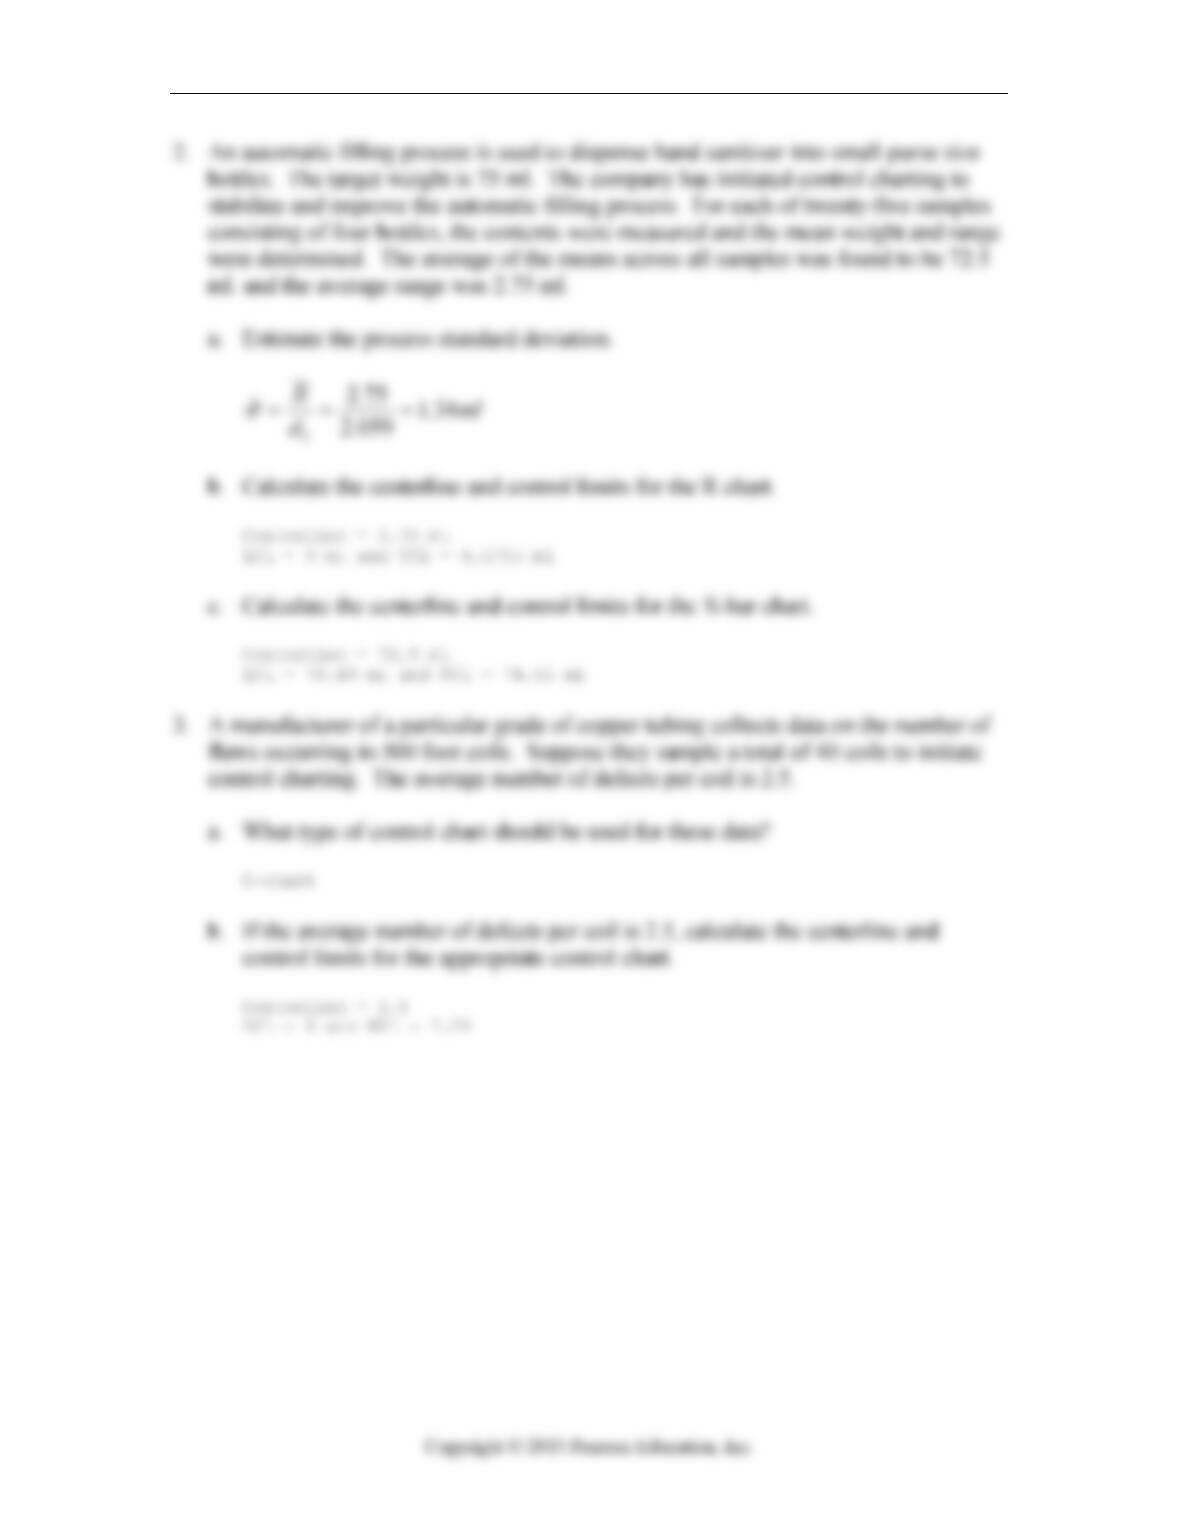
2. An automatic filling process is used to dispense hand sanitizer into small purse size
bottles. The target weight is 75 ml. The company has initiated control charting to
stabilize and improve the automatic filling process. For each of twenty-five samples
consisting of four bottles, the contents were measured and the mean weight and range
were determined. The average of the means across all samples was found to be 72.5
ml. and the average range was 2.75 ml.
a. Estimate the process standard deviation.
b. Calculate the centerline and control limits for the R chart.
c. Calculate the centerline and control limits for the X-bar chart.
21.5.5 Understand concepts and terms involved with quality control.
3. A manufacturer of a particular grade of copper tubing collects data on the number of
flaws occurring in 500 foot coils. Suppose they sample a total of 40 coils to initiate
control charting. The average number of defects per coil is 2.5.
a. What type of control chart should be used for these data?
b. If the average number of defects per coil is 2.5, calculate the centerline and
control limits for the appropriate control chart.

Quiz B 21-7
21.5.2 Create p charts.
4. In order to achieve higher levels of customer satisfaction, a company initiates
monitoring the complaint resolution process of its customer service representatives.
As a first step, the company decides to collect data on the number of unanswered calls
out of the first 250 incoming calls to its call center made each day. At the end of
monitoring 25 days, it was found that a total of 500 incoming calls went unanswered.
a. What type of control chart should be used by the importer in monitoring the
proportion of scrap tiles?
b. Calculate the centerline for this control chart.
c. Calculate the control limits for this control chart.
21-8 Chapter 21 Quality Control
Chapter 21: Quality Control – Quiz B – Key Name________________________
Quiz B 21-9
21-10 Chapter 21 Quality Control

Quiz C 21-11
Chapter 21: Quality Control Name___________________
Quiz C – Multiple Choice
21.1.5 Understand concepts and terms involved with quality control.
1. Which of the following statements is false regarding control charts?
A. If we view using a control chart as a graphical hypothesis test, the null hypothesis
is that the process has not changed.
B. A type I error in control charting results in an unnecessary adjustment to the
process.
C. A type II error in control charting results in an unnecessary adjustment to the
process.
D. A process within which special cause variation is present is said to be out of
control.
E. A process which exhibits only common cause variation is said to be in control.
21.6.5 Understand concepts and terms involved with quality control.
2. A paper products manufacturer coats paper with a thin film of wax. To initiate
control charting, data are collected on the thickness of the coating (measured in
mm) by taking twenty-five samples each of size five. The appropriate control chart
for these data is the
A. c chart.
B. p chart.
C. Cp index.
D. x-bar and R chart.
E. ARL chart.
21.1.5 Understand concepts and terms involved with quality control.
3. By design, a required dimension on a part is 0.575 inches plus or minus 0.008 inches.
Assume that the process producing this part is stable with a mean of 0.579 inches and
standard deviation of 0.002 inches. The specification limits for this part are
A. 0.554 to 0.596 inches.
B. 0.567 to 0.583 inches.
C. 0.576 to 0.598 inches.
D. 0.572 to 0.584 inches.
E. 0.575 to 0.578 inches.

21-12 Chapter 21 Quality Control
21.3.1 Create x-bar and R charts.
4. A company that manufactures health food snacks produces low sodium rice chips. To
monitor the process for sodium levels, chips are selected periodically and the amount
of sodium (mg) measured. For each of thirty samples consisting of 8 chips, the mean
and range in sodium content is determined. The average of the means across all
samples is 55 mg and the average range is 2.2 mg. The estimated process standard
deviation (
ˆ) is
A. 0.773 mg.
B. 2.683 mg.
C. 0.073 mg.
D. 16.176 mg.
E. 1.833 mg.
21.3.1 Create x-bar and R charts.
5. A company that manufactures health food snacks produces low sodium rice chips. To
monitor the process for sodium levels, chips are selected periodically and the amount
of sodium (mg) measured. For each of thirty samples consisting of 8 chips, the mean
and range in sodium content is determined. The average of the means across all
samples is 55 mg and the average range is 2.2 mg. The lower and upper control
limits for the x-bar chart are
A. 52.67 and 57.33 mg.
B. 51.15 and 58.85 mg.
C. 54.18 and 55.82 mg.
D. 48.89 and 57.61 mg.
E. 37.84 and 72.16 mg.
21.3.1 Create x-bar and R charts.
6. A company that manufactures health food snacks produces low sodium rice chips. To
monitor the process for sodium levels, chips are selected periodically and the amount
of sodium (mg) measured. For each of thirty samples consisting of 8 chips, the mean
and range in sodium content is determined. The average of the means across all
samples is 55 mg and the average range is 2.2 mg. The lower and upper control
limits for the R chart are
A. 0.2992 and 4.1008 mg.
B. 0 and 4.4088 mg.
C. 0.136 and 1.864 mg.
D. 2.1999 and 30.152 mg.
E. 0.2493 and 3.4167 mg.

Quiz C 21-13
21.5.2 Create p charts.
7. An importer of decorative ceramic tile samples 50 tiles each day from incoming
shipments. Some tiles are cracked or broken before or during transit, rendering them
useless scrap. Sampling from incoming shipments for 30 days reveals that a total of
250 tiles are cracked or broken. The centerline on the p chart for these data is
A. 0.250
B. 1.83.
C. 2.5.
D. 0.167.
E. 6.1.
21.5.2 Create p charts.
8. An importer of decorative ceramic tile samples 50 tiles each day from incoming
shipments. Some tiles are cracked or broken before or during transit, rendering them
useless scrap. Sampling from incoming shipments for 30 days reveals that a total of
250 tiles are cracked or broken. The lower and upper control limits on the p chart for
these data are
A. 0.067 and 0.299.
B. 0.157 and 0.177.
C. 0 and 0.299.
D. 1.314 and 10.886.
E. 0.009 and 0.325.
21.5.5 Understand concepts and terms involved with quality control.
9. A manufacturer of a particular grade of copper tubing collects data on the number of
flaws occurring in 500 foot coils. Suppose they sample a total of 40 coils to initiate
control charting. The average number of defects per coil is 2.5. The appropriate
control chart for these data is the
A. R chart.
B. c chart.
C. x-bar and R chart.
D. p chart.
E. ARL chart.

21-14 Chapter 21 Quality Control
21.5.5 Understand concepts and terms involved with quality control.
10. A manufacturer of a particular grade of copper tubing collects data on the number of
flaws occurring in 500 foot coils. Suppose they sample a total of 40 coils to initiate
control charting. The average number of defects per coil is 2.5. The lower and upper
control limits for the appropriate control chart for these data are
A. 0 and 7.24.
B. 0 and 5.66.
C. 2.24 and 7.24.
D. 2.24 and 4.08.
E. none of the above.
Quiz C 21-15
Chapter 21: Quality Control – Quiz C – Key

21-16 Chapter 21 Quality Control
Chapter 21: Quality Control Name_________________________
Quiz D — Multiple Choice
21.1.5 Understand concepts and terms involved with quality control.
1. Machine oil is used by clothing manufacturers to lubricate and protect sewing
machines. A company that produces machine oil must ensure that the viscosity of its
product meets customer requirements. Consequently, the viscosity of every batch of
oil produced is measured. Suppose that the process mean is 101 cP and the process
standard deviation is 1.50 cP. What type of chart should be used to ensure the process
remains in control?
A. p-chart
B. c-chart
C. R-chart
D. Individuals chart
E. ARL chart
21.1.5 Understand concepts and terms involved with quality control.
2. Machine oil is used by clothing manufacturers to lubricate and protect sewing
machines. A company that produces machine oil must ensure that the viscosity of its
product meets customer requirements. Consequently, the viscosity of every batch of
oil produced is measured. Suppose that the process mean is 101 cP and the process
standard deviation is 1.50 cP. What are the limits for a runs chart to be used to see
that the process remains control?
A. 99.5 cP and 102.5 cP
B. 96.5 cP and 105.5 cP
C. 95.5 cP and 106.5 cP
D. 92.5 cP and 110.5 cP
E. None of the above
21.1.5 Understand concepts and terms involved with quality control.
3. Machine oil is used by clothing manufacturers to lubricate and protect sewing
machines. A company that produces machine oil must ensure that the viscosity of its
product meets customer requirements. Consequently, the viscosity of every batch of
oil produced is measured. Suppose that the process mean is 101 cP and the process
standard deviation is 1.50 cP. What is the Cpk index if the customer specifications
require viscosity of the machine oil to be 100cP ± 4.5 cP?
A. 1.0
B. 1.22
C. 0.78
D. 1.67
E. None of the above

Quiz D 21-17
21.1.5 Understand concepts and terms involved with quality control.
4. By design, a required dimension on a part is 0.575 inches plus or minus 0.008 inches.
Assume that the process producing this part is stable with a mean of 0.579 inches and
standard deviation of 0.002 inches. What is the Cp index?
A. 1.33
B. 2.00
C. 0.67
D. 1.00
E. None of the above
21.5.5 Understand concepts and terms involved with quality control.
5. A producer of specialty products uses a variety of natural and man-made materials to
make unique countertops for kitchens and baths. One product line mixes concrete
and natural river stone to make countertops that are polished to a high shine revealing
unique patterns. Occasionally coarse sand will result in undesirable pitting and rough
spots on surfaces. Consequently, as part of its quality control efforts, 8 by 4 foot
polished slabs are checked periodically for imperfections. For each slab inspected the
number of imperfections (pits, rough spots, etc.) is recorded. What type of control
chart should be used for these data?
A. Individuals chart
B. P-chart
C. C-chart
D. X-bar and R charts
E. ARL chart
21.5.5 Understand concepts and terms involved with quality control.
6. A producer of specialty products uses a variety of natural and man-made materials to
make unique countertops for kitchens and baths. One product line mixes concrete
and natural river stone to make countertops that are polished to a high shine revealing
unique patterns. Occasionally coarse sand will result in undesirable pitting and rough
spots on surfaces. Consequently, as part of its quality control efforts, 8 by 4 foot
polished slabs are checked periodically for imperfections. For each slab inspected the
number of imperfections (pits, rough spots, etc.) is recorded. If the average number
of imperfections per 8 by 4 foot polished slab is 2.6, the control limits for the
appropriate control chart are
A. 0 and 7.44
B. 0.98 and 4.21
C. 0 and 9.89
D. 1.24 and 3.96
E. None of the above

21-18 Chapter 21 Quality Control
21.3.1 Create x-bar and R charts.
7. An automatic filling process is used to dispense hand sanitizer into small purse size
bottles. The target weight is 75 ml. The company has initiated control charting to
stabilize and improve the automatic filling process. For each of twenty-five samples
consisting of four bottles, the contents were measured and the mean weight and range
were determined. The average of the means across all samples was found to be 72.5
ml. and the average range was 2.75 ml. The estimate of the process standard
deviation is
A. 2.75 ml
B. 2.44 ml
C. 1.88 ml
D. 1.34 ml
E. None of the above
21.3.1 Create x-bar and R charts.
8. An automatic filling process is used to dispense hand sanitizer into small purse size
bottles. The target weight is 75 ml. The company has initiated control charting to
stabilize and improve the automatic filling process. For each of twenty-five samples
consisting of four bottles, the contents were measured and the mean weight and range
were determined. The average of the means across all samples was found to be 72.5
ml. and the average range was 2.75 ml. The control limits for the R chart are
A. 0 and 4.3566 ml
B. 0 and 6.2755 ml
C. 0 and 2.8875 ml
D. 2.00 and 3.50 ml
E. None of the above
21.3.1 Create x-bar and R charts.
9. An automatic filling process is used to dispense hand sanitizer into small purse size
bottles. The target weight is 75 ml. The company has initiated control charting to
stabilize and improve the automatic filling process. For each of twenty-five samples
consisting of four bottles, the contents were measured and the mean weight and range
were determined. The average of the means across all samples was found to be 72.5
ml. and the average range was 2.75 ml. The control limits for the X-bar chart are
A. 68.48 and 76.52 ml
B. 71.16 and 73.84 ml
C. 70.49 and 74.51 ml
D. 72 and 73 ml
E. None of the above

Quiz D 21-19
21.2.2 Create p charts.
10. In order to achieve higher levels of customer satisfaction, a company initiates
monitoring the complaint resolution process of its customer service representatives.
As a first step, the company decides to collect data on the number of unanswered calls
out of the first 250 incoming calls to its call center made each day. At the end of
monitoring 25 days, it was found that a total of 500 incoming calls went unanswered.
The control limits for the p-chart of these data are
A. 0.029 and 0.131
B. 0 and 0.304
C. 0.066 and 0.094
D. 0.048 and 0.112
E. None of the above

21-20 Chapter 21 Quality Control
Chapter 21, Quality Control, Quiz D, Key